Copyright
©The Author(s) 2025.
World J Hepatol. Oct 27, 2025; 17(10): 110430
Published online Oct 27, 2025. doi: 10.4254/wjh.v17.i10.110430
Published online Oct 27, 2025. doi: 10.4254/wjh.v17.i10.110430
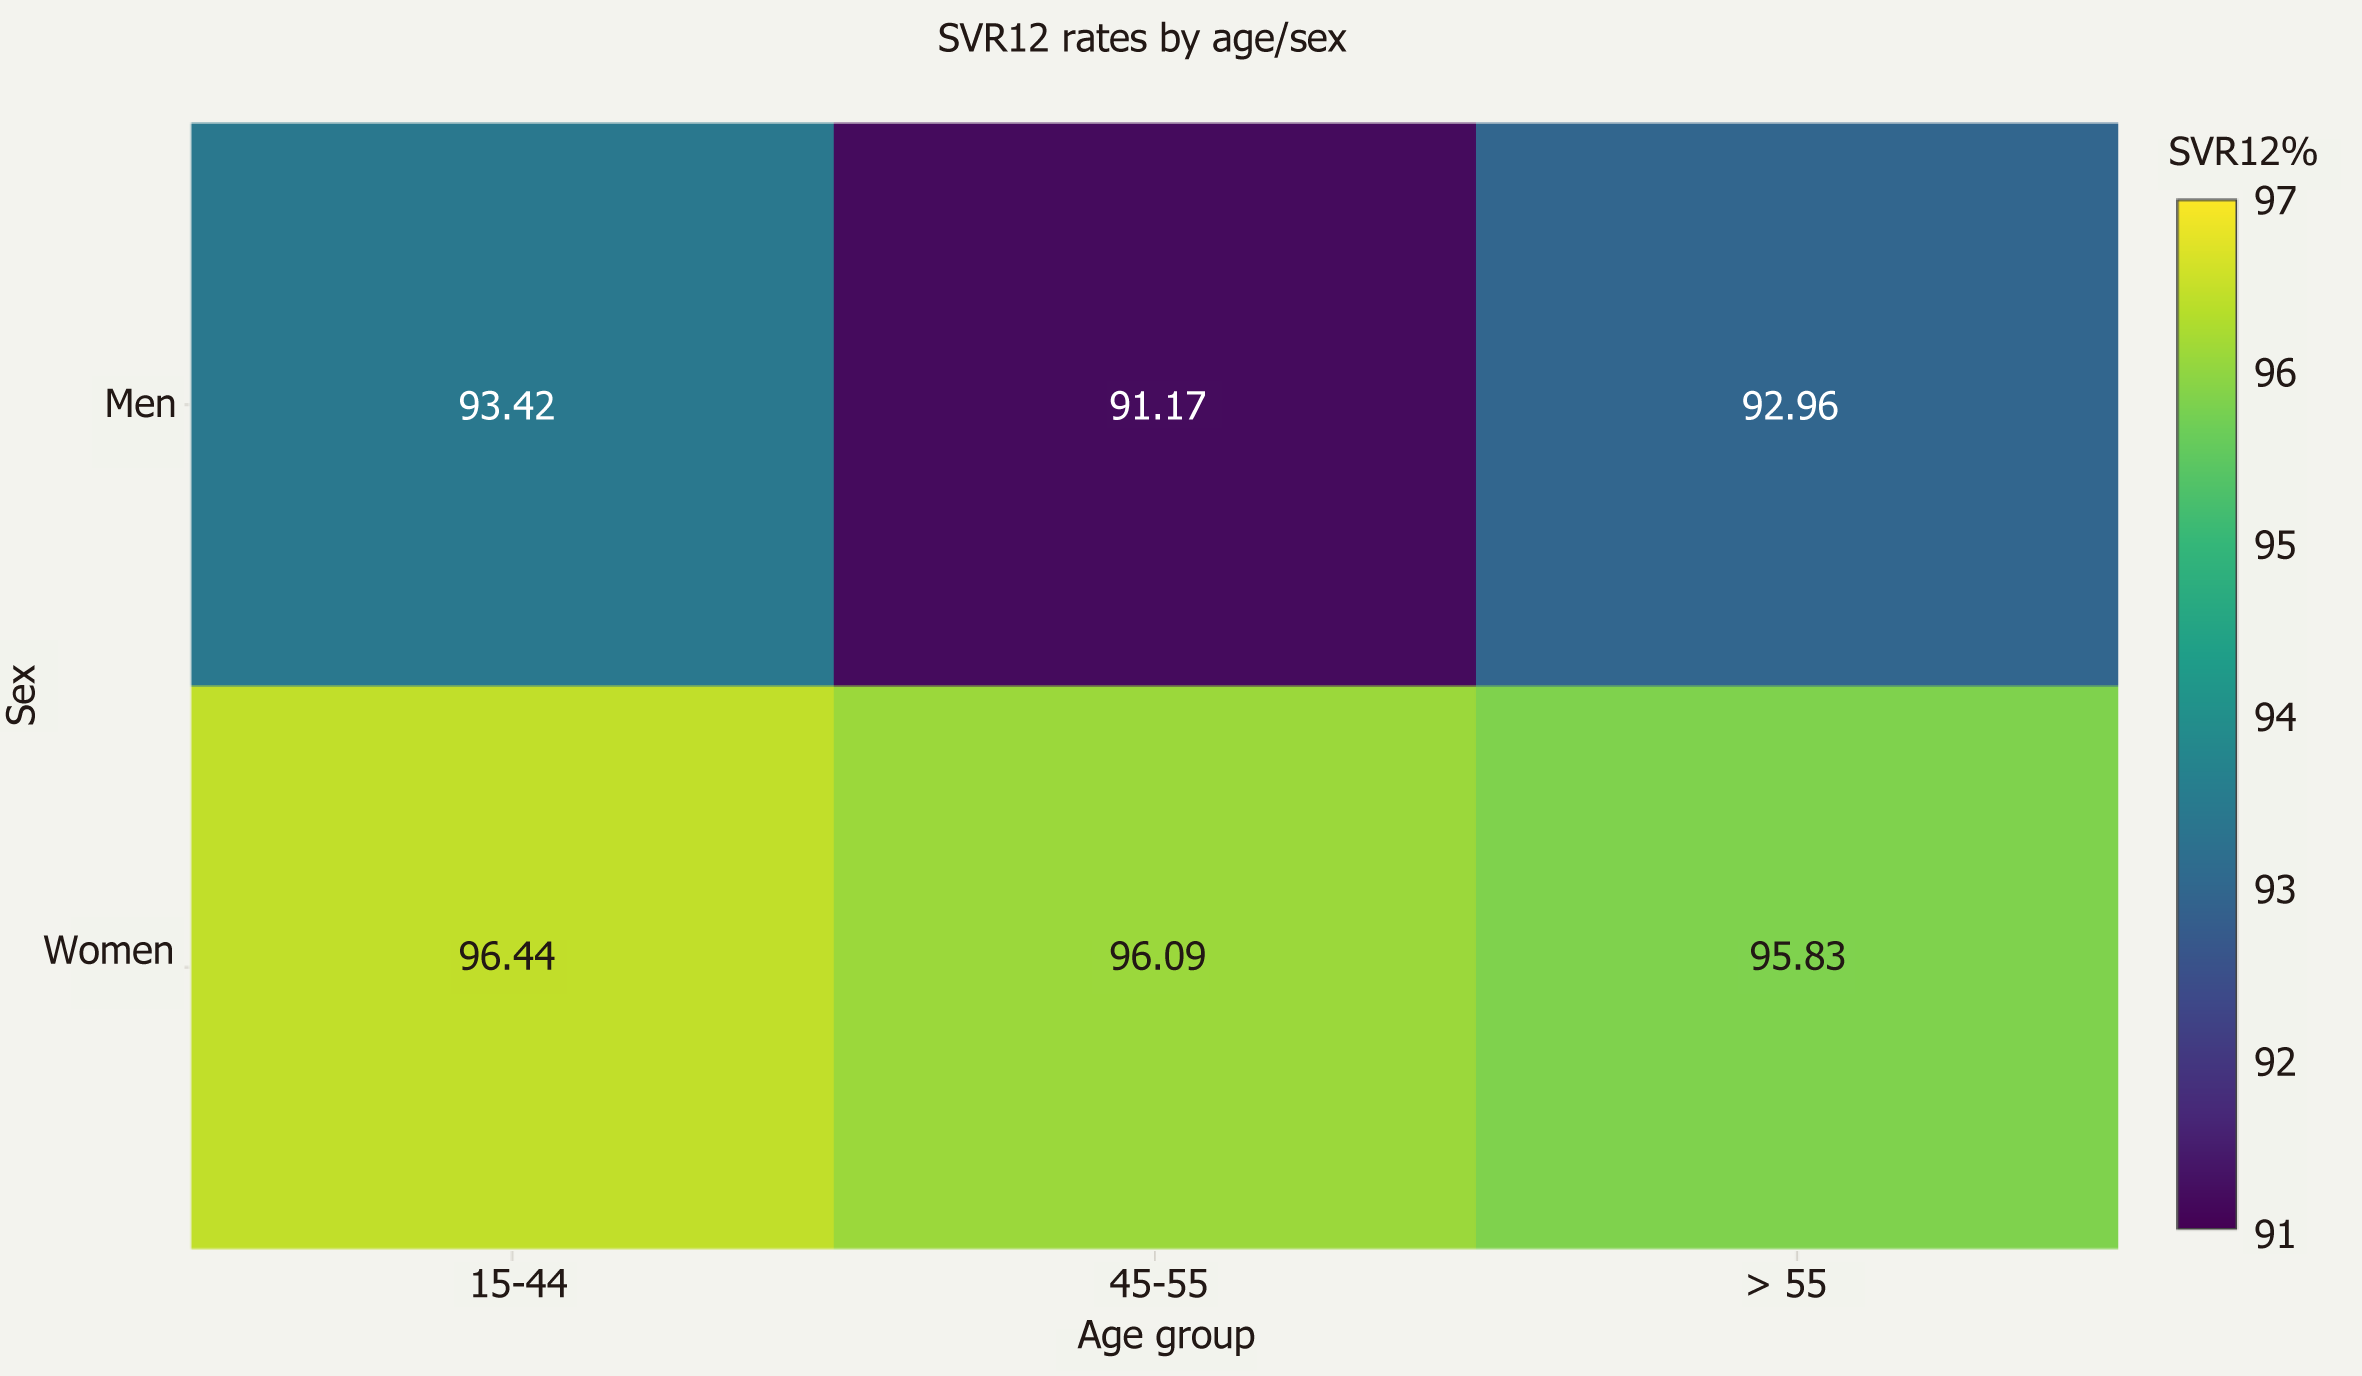
Figure 1 Sustained virologic response at 12 weeks post-treatment by age group and sex.
Color gradients indicate the magnitude of response success, and each cell shows the precise sustained virologic response at 12 weeks post-treatment percentage for clarity. SVR12: Sustained virologic response at 12 weeks post-treatment.
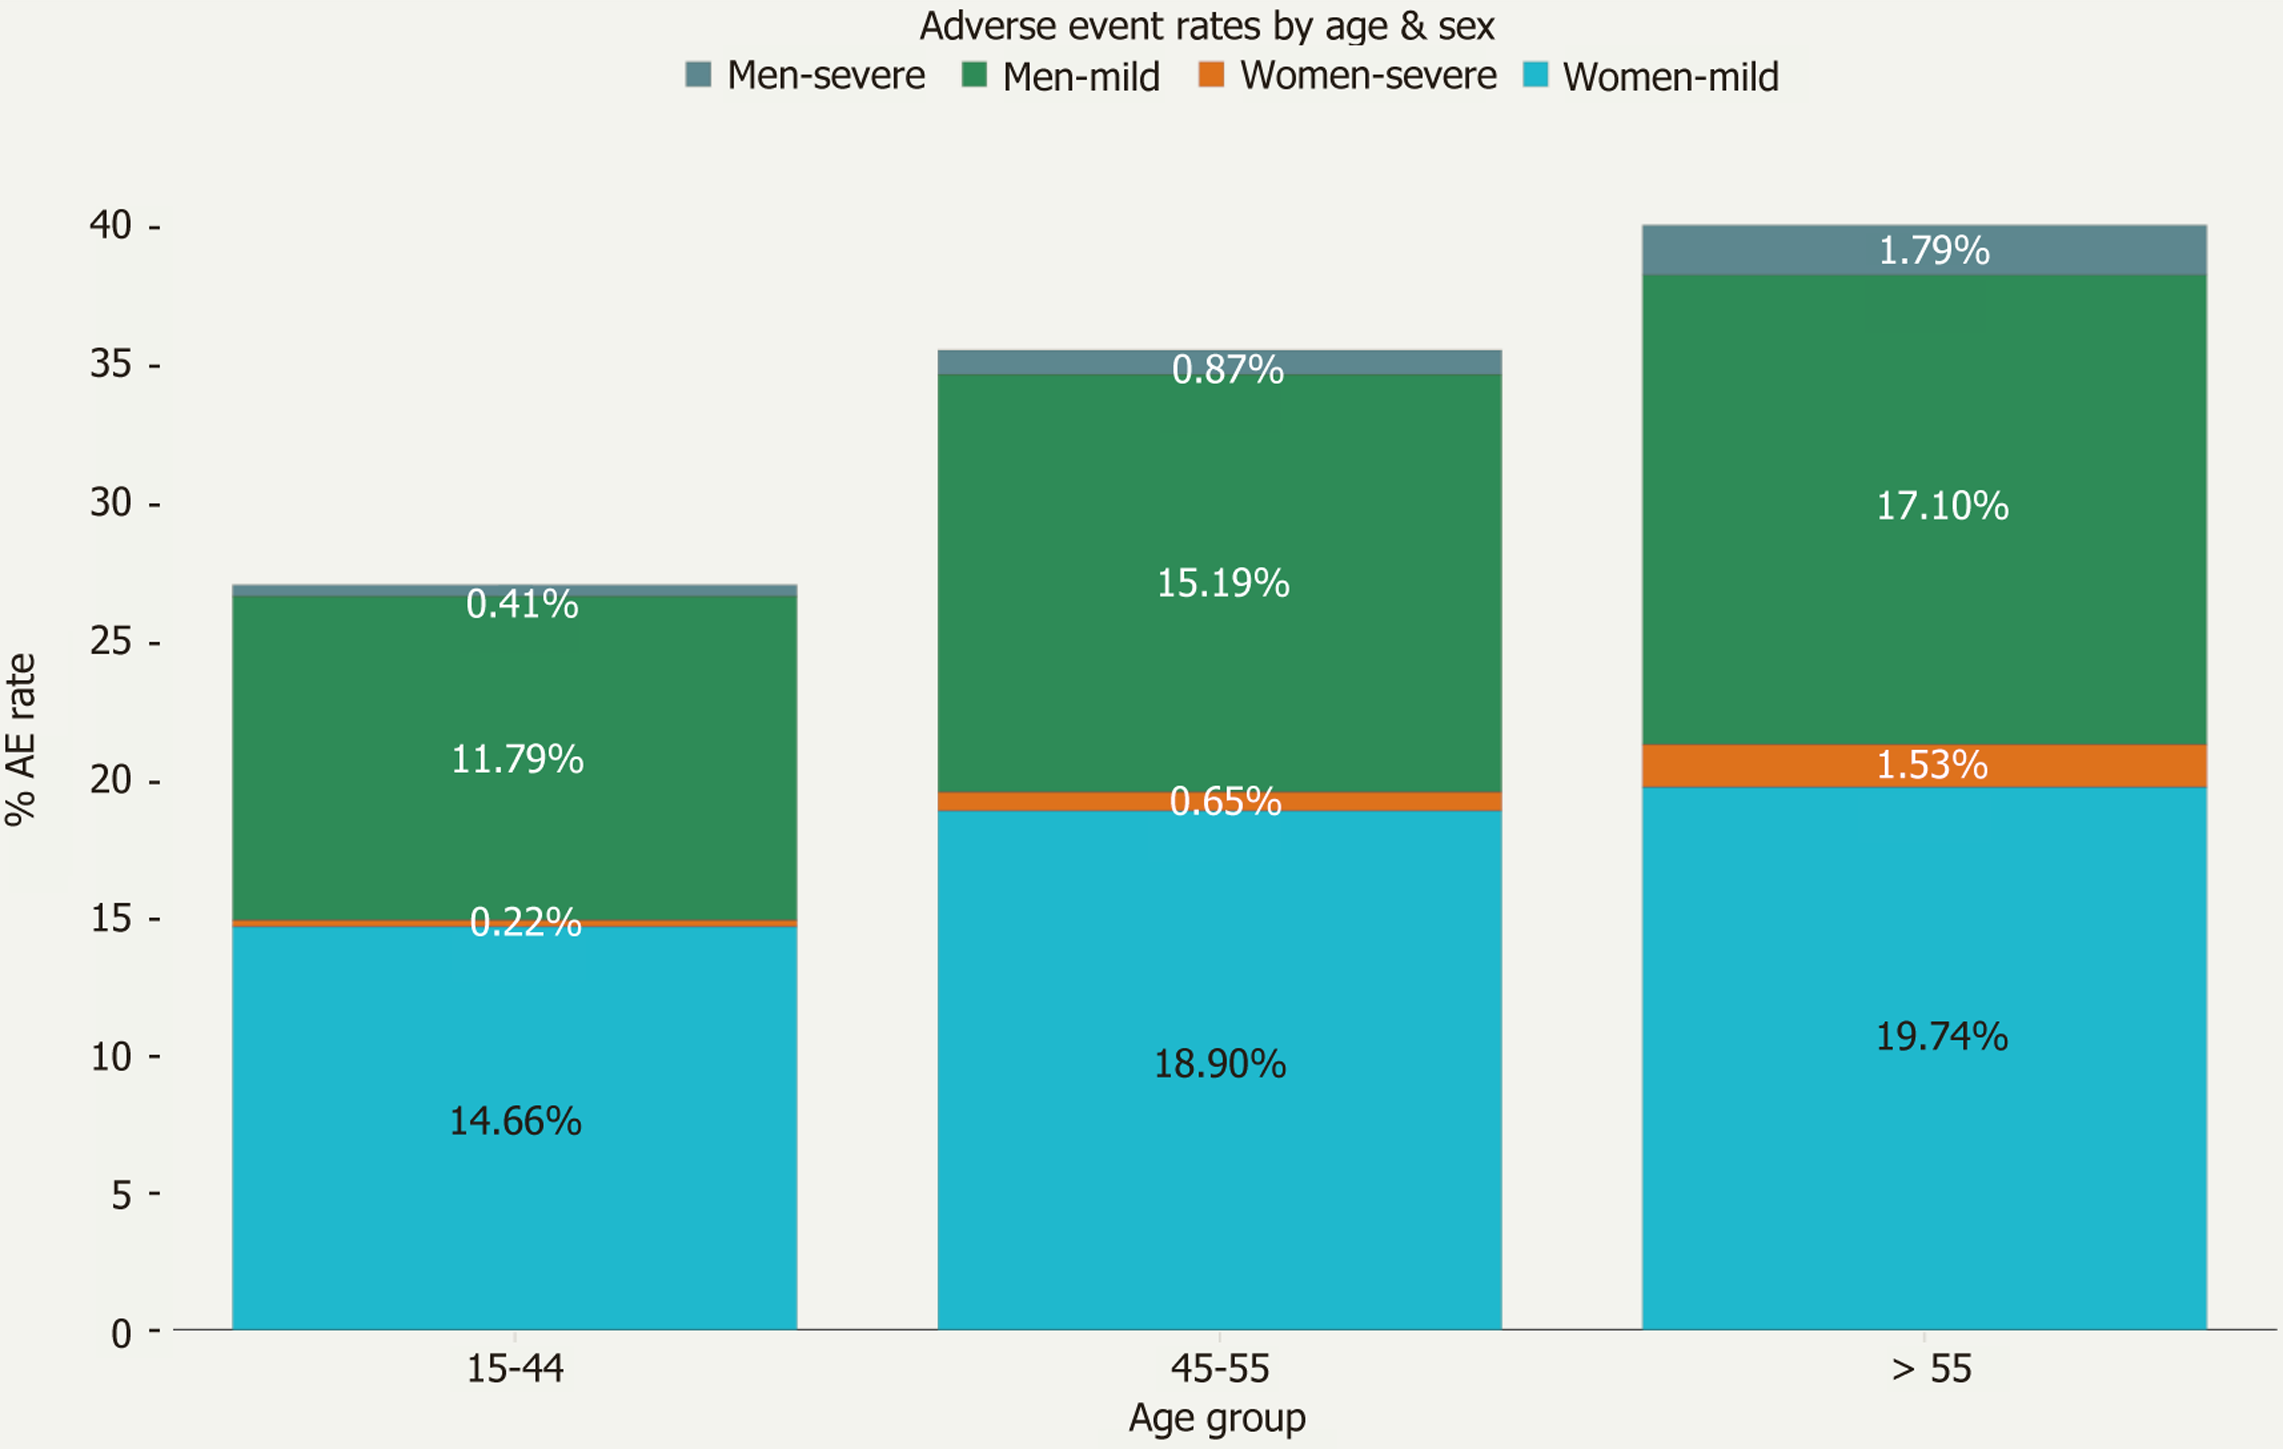
Figure 2 Mild and severe adverse event rates by sex and age group for direct-acting antivirals-treated hepatitis C virus patients.
Mild adverse event (AE) represent any reported event, while severe AEs comprise liver transplant, hepatocellular carcinoma, and decompensated liver cirrhosis. AE: Adverse event.
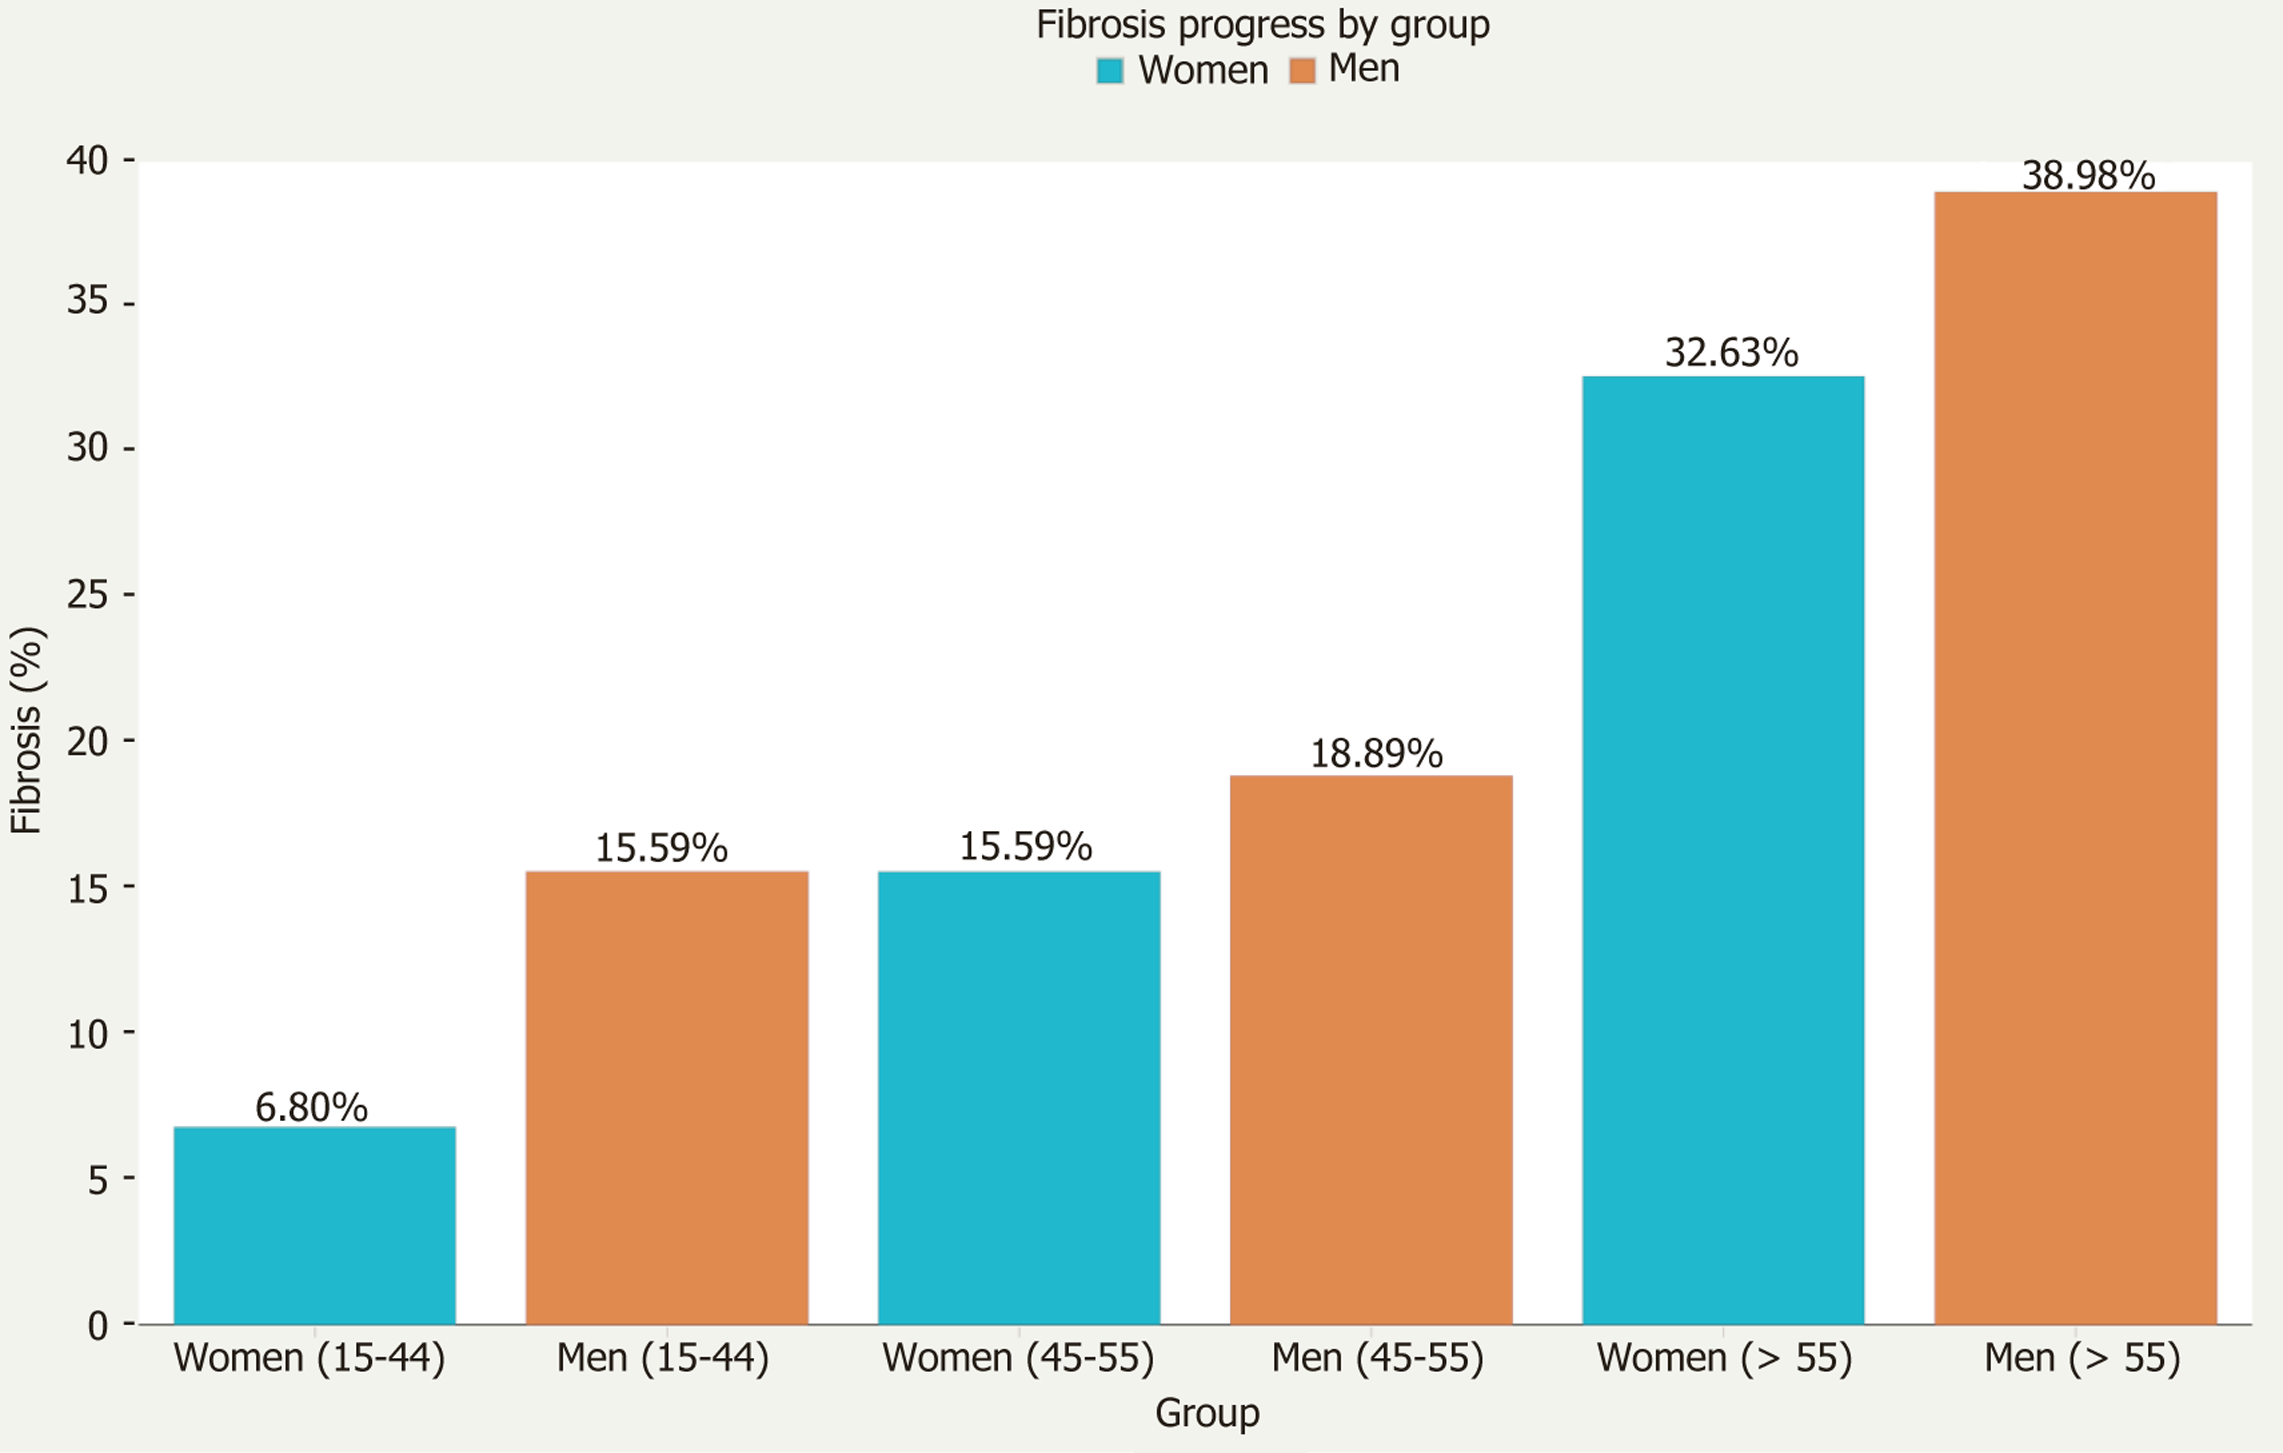
Figure 3 Fibrosis progression trends by sex and age group.
- Citation: Feyissa GD. Sex-related differences in treatment outcomes of chronic hepatitis C with direct-acting antivirals. World J Hepatol 2025; 17(10): 110430
- URL: https://www.wjgnet.com/1948-5182/full/v17/i10/110430.htm
- DOI: https://dx.doi.org/10.4254/wjh.v17.i10.110430


