Copyright
©The Author(s) 2025.
World J Hepatol. Oct 27, 2025; 17(10): 109517
Published online Oct 27, 2025. doi: 10.4254/wjh.v17.i10.109517
Published online Oct 27, 2025. doi: 10.4254/wjh.v17.i10.109517
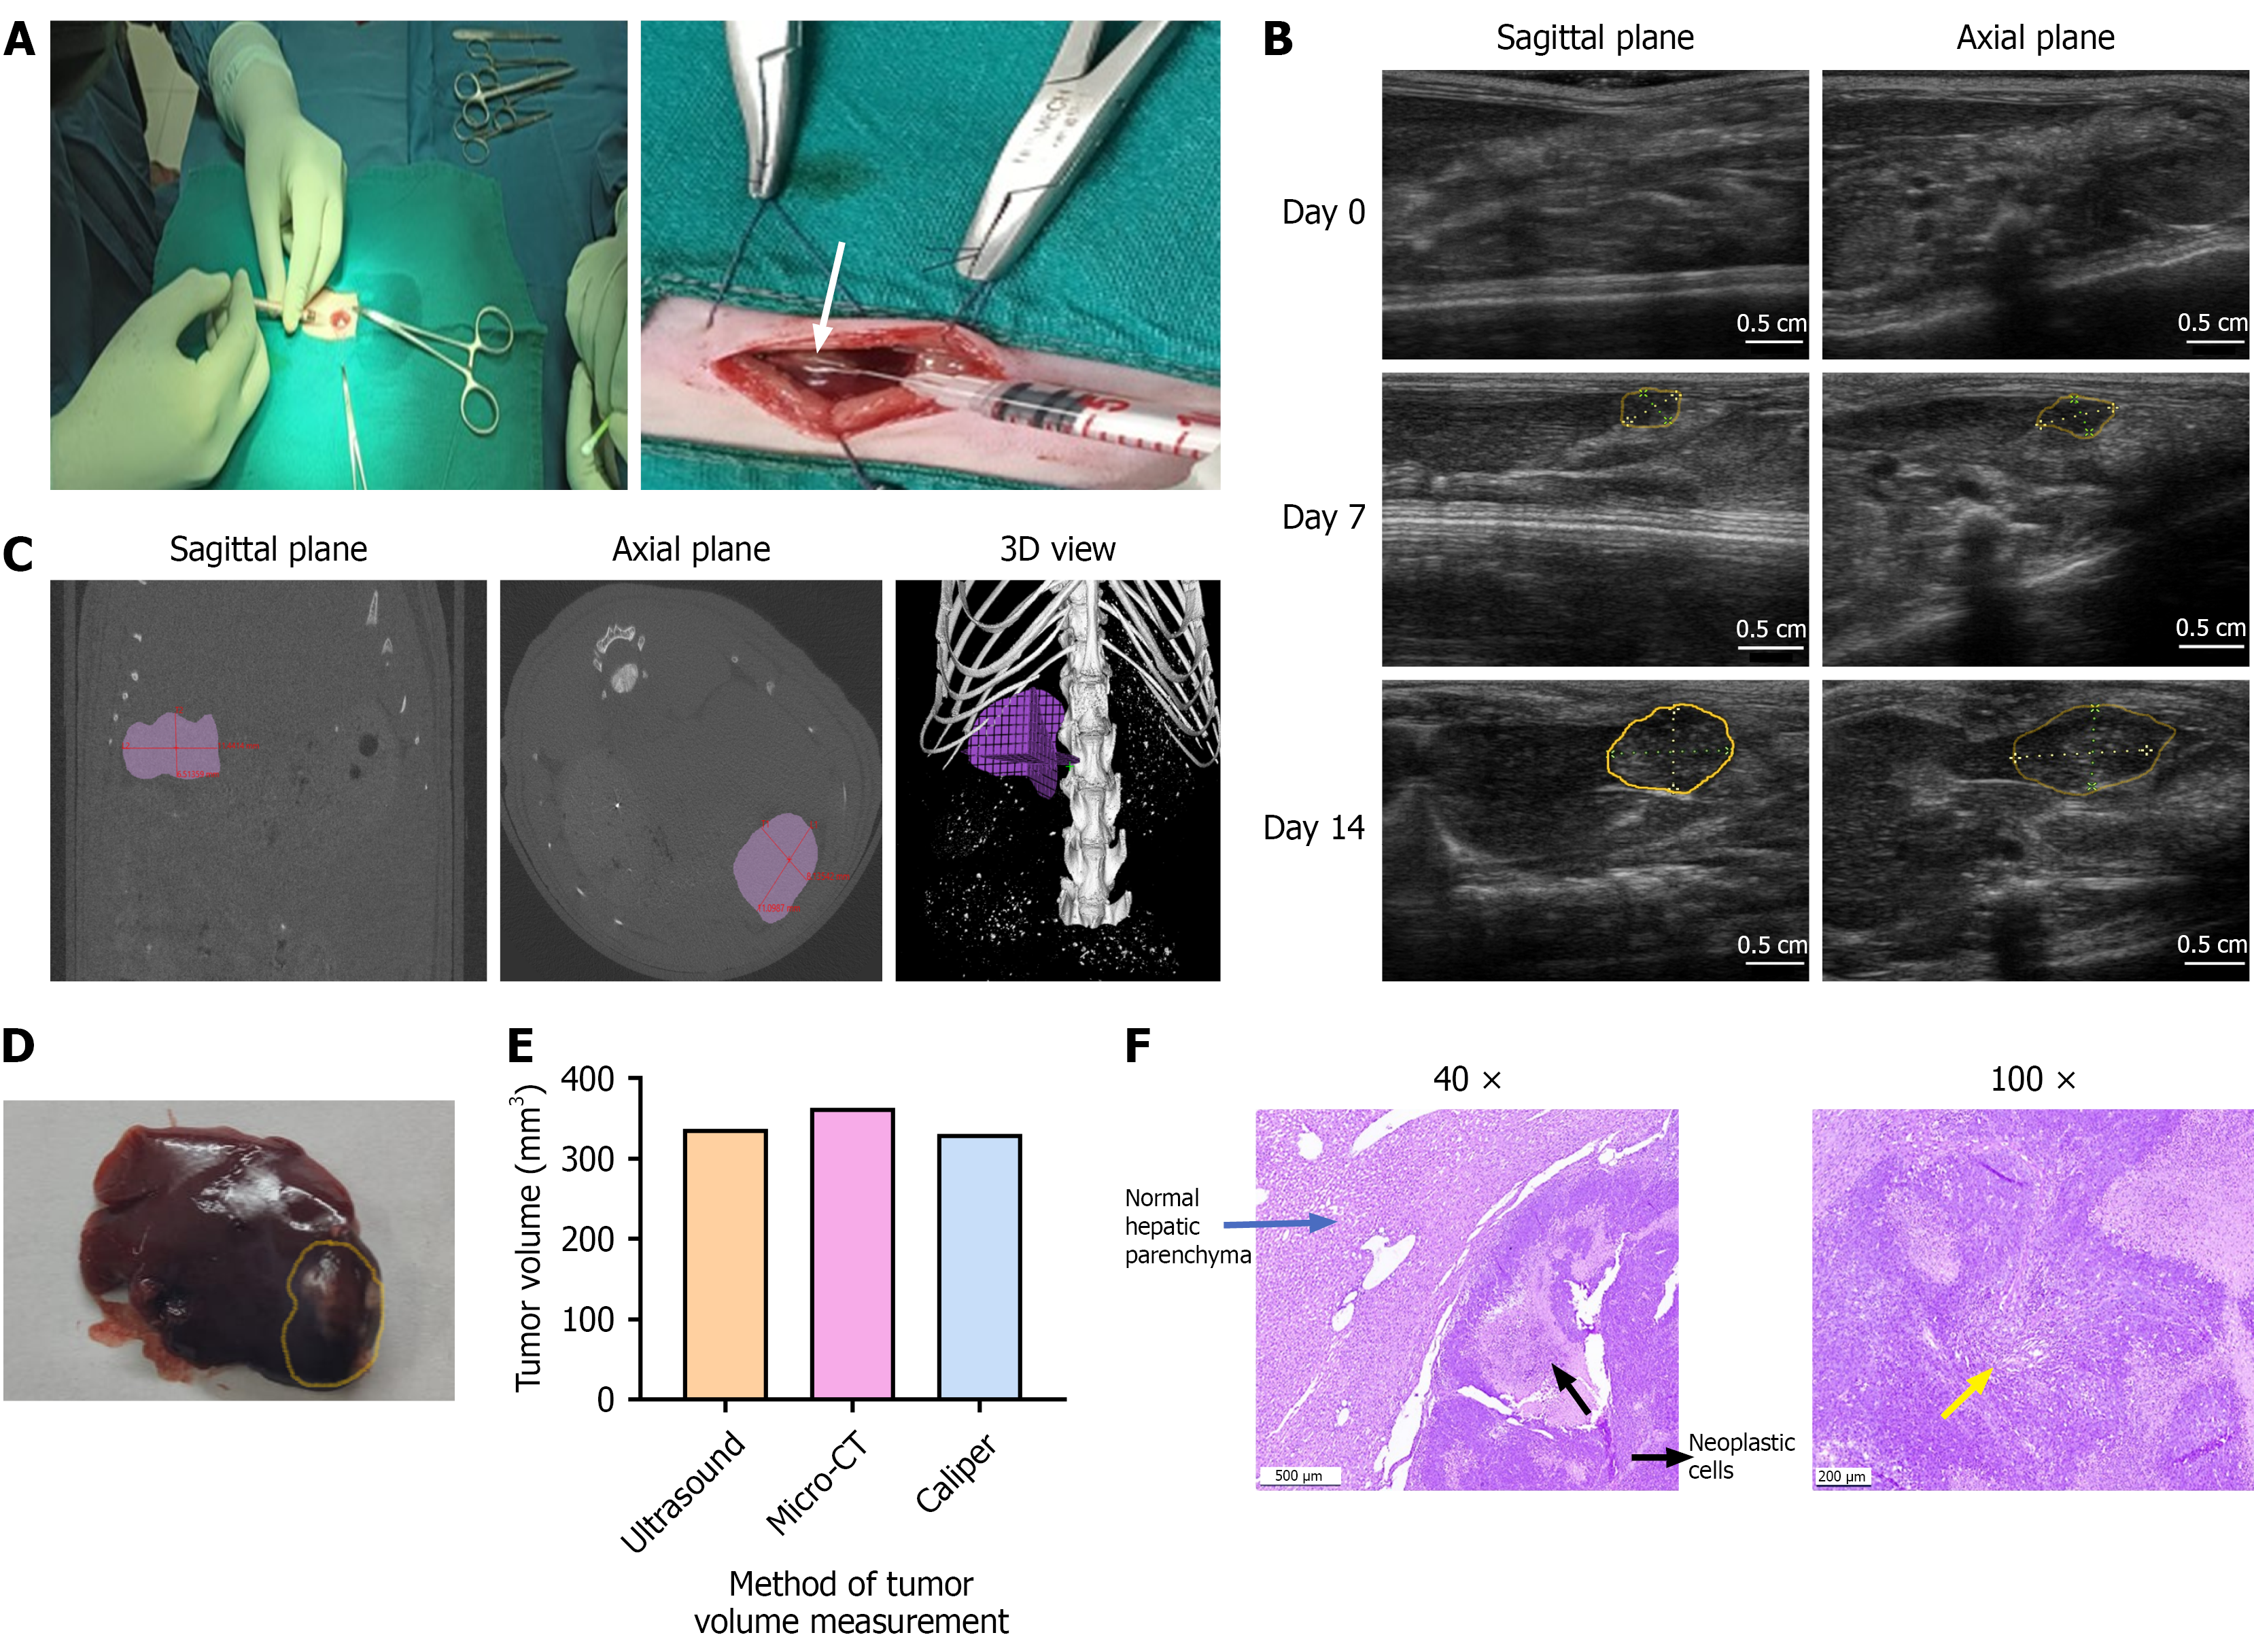
Figure 1 Surgical induction of hepatocellular carcinoma and validation of ultrasound imaging for tumor monitoring in comparison with micro-computed tomography.
A: Hepatocellular carcinoma (HCC) was induced by injecting 5 × 10⁶ N1S1 cells into the subcapsular region at the tip of the left lateral liver lobe of Sprague-Dawley rats. The formation of a white bleb on the liver surface (white arrow) confirmed successful cell implantation. The tumor induction rate was 100%, with a single, well-defined hypoechoic nodule developing in all animals by day 7 post-implantation; B: Ultrasound (US) imaging of the liver was performed in both sagittal and axial planes prior to cell injection (day 0) and weekly thereafter (days 7 and 14). Tumor formation was confirmed by day 7, with evident tumor progression by day 14 (tumor area outlined in yellow); C: Micro-computed tomography (micro-CT) imaging was performed on day 14 and analysed in planes (sagittal and axial) similar to those used for US imaging. Tumor dimensions were measured and validated with 3D view. micro-CT confirmed the presence of a growing tumor with volume measurements comparable to those obtained by US; D: Gross liver morphology on day 14 revealed a tumor nodule at the tip of the left lateral lobe (tumor area outlined in yellow), with tumor volume measured using a vernier caliper (VC); E: Comparative tumor volume measurements from US, CT and VC in a representative rat bearing orthotopic N1S1 HCC tumor. All imaging and measurements were performed on day 14 post-implantation; F: Representative histology images of H&E staining in the liver tumor tissues of SD rats. Images include SD rat HCC tumor tissue on day 14 at 40 × and 100 × magnification (size bar for: For: 500 μm = 40 ×, 200 μm = 100 ×). Histopathological analysis confirmed mid-stage HCC consists of dense proliferating neoplastic cells (yellow arrow) invading into the adjacent normal hepatic parenchyma.
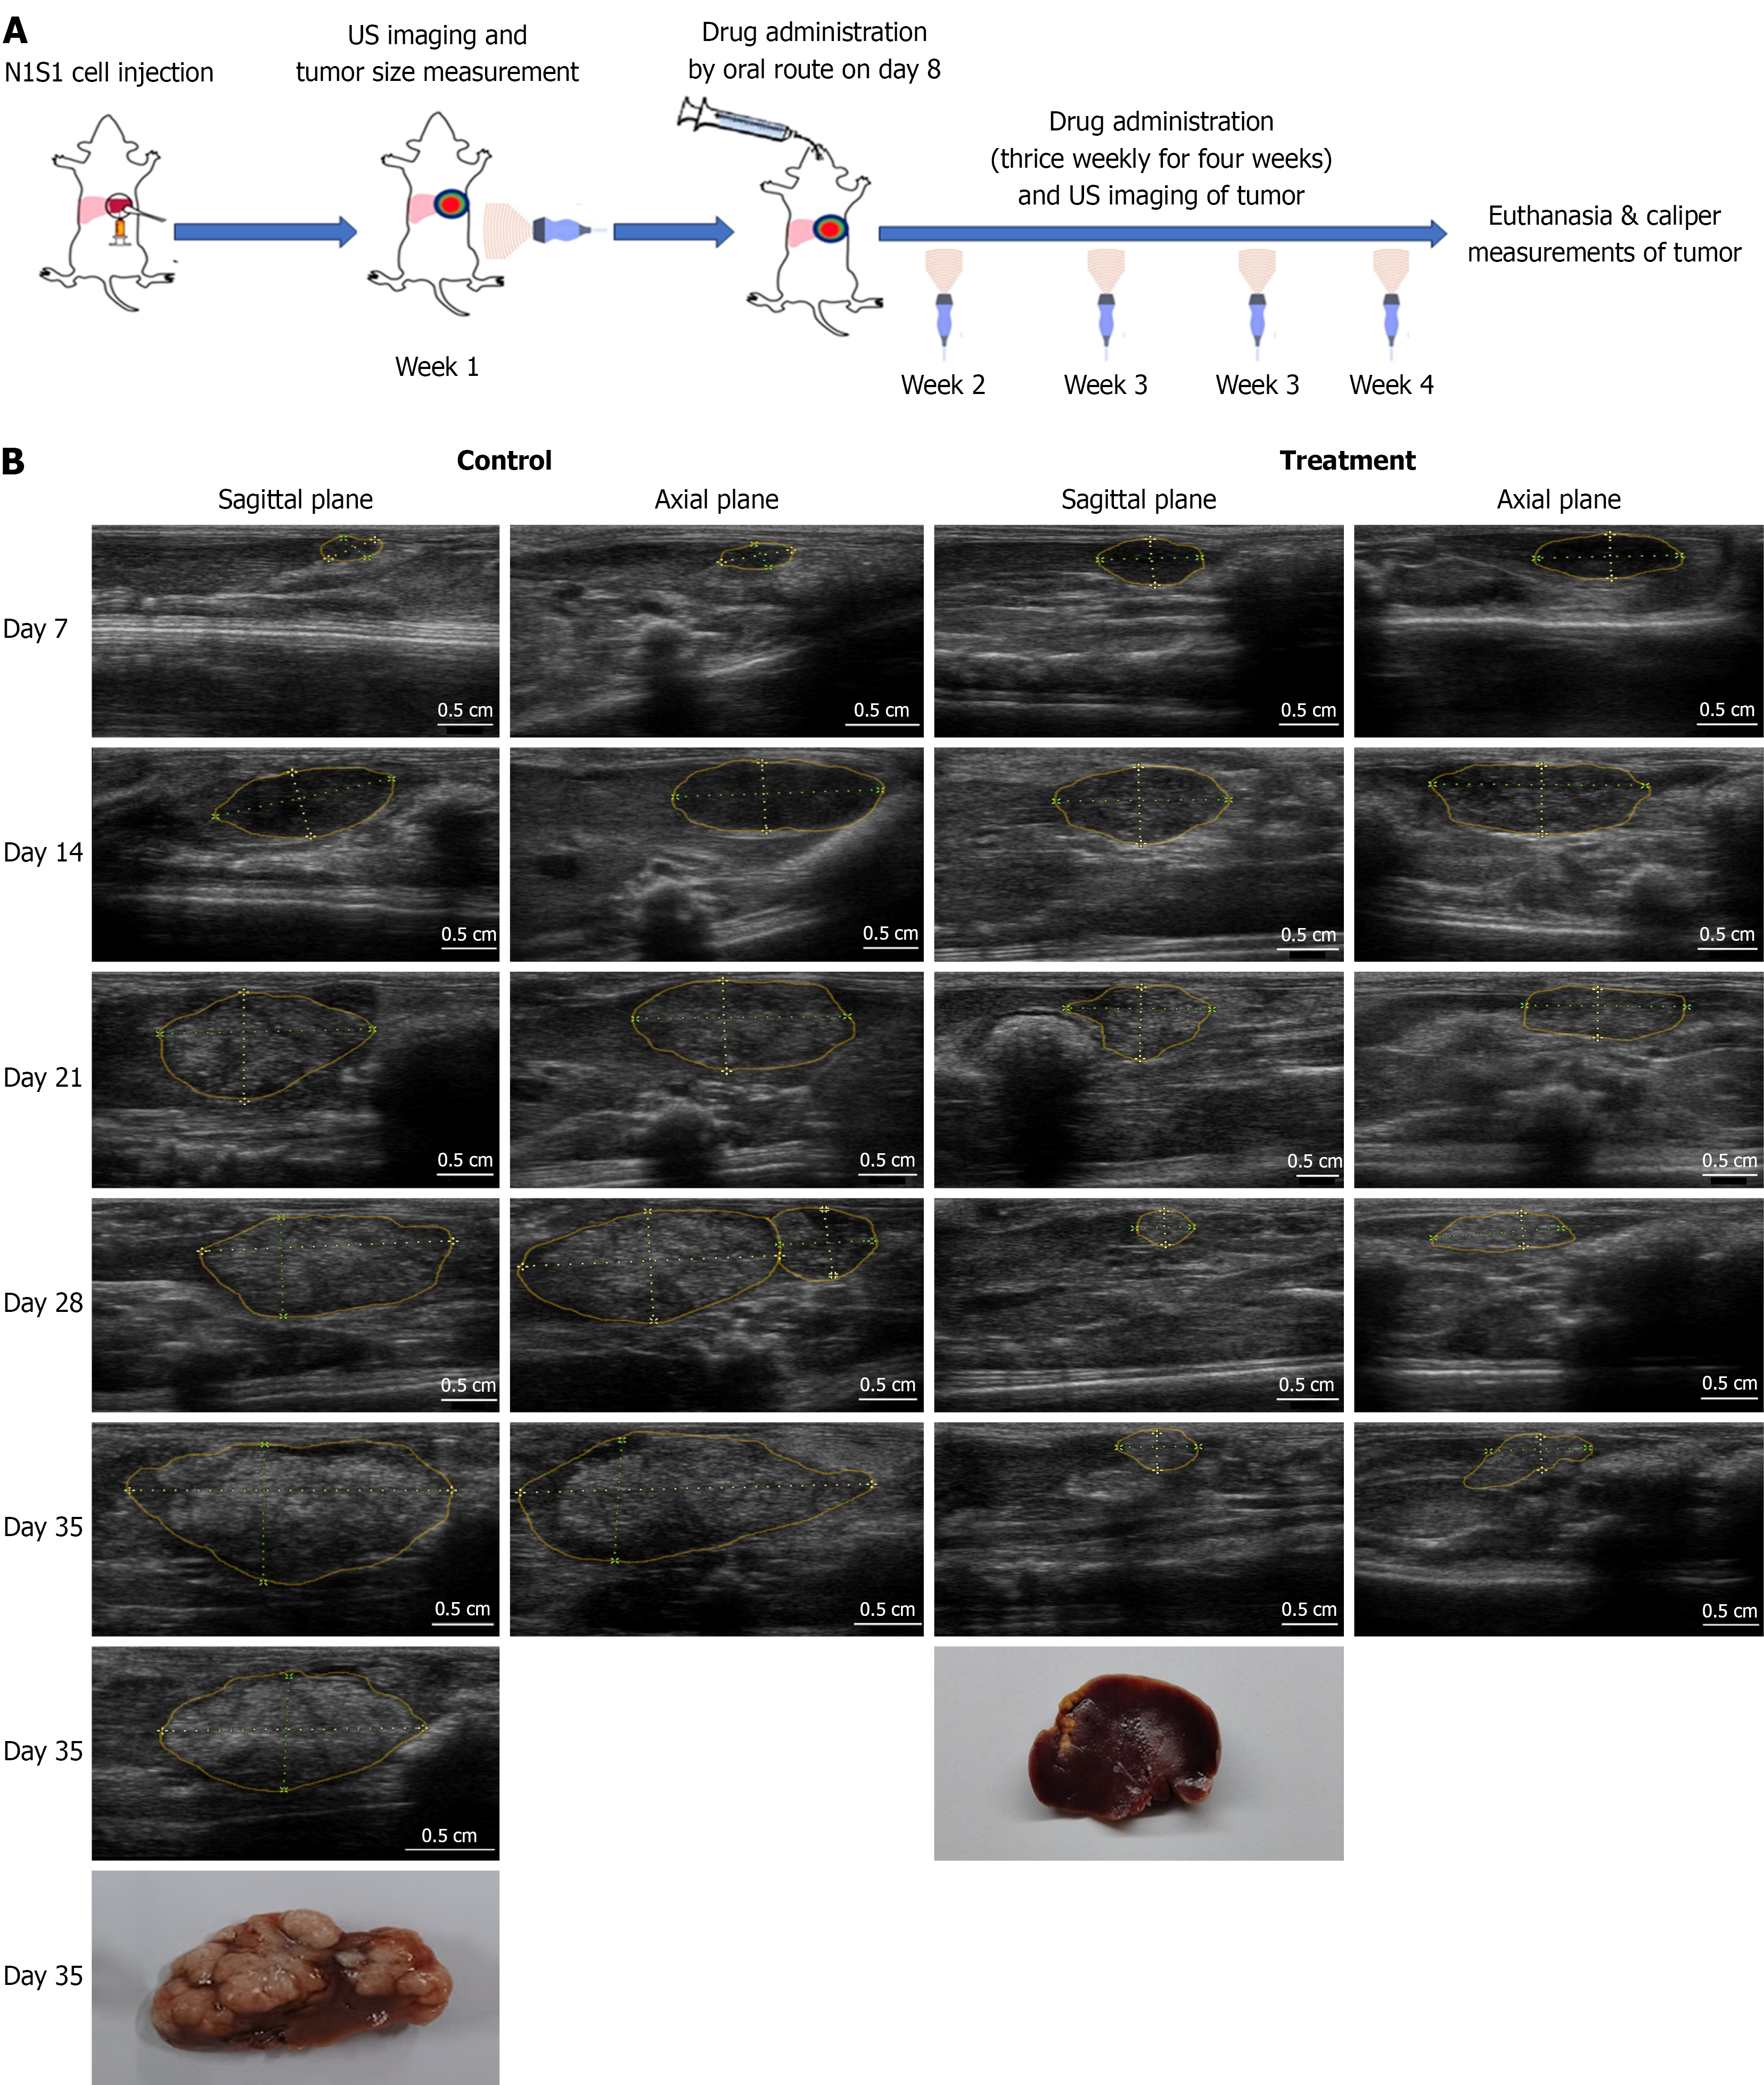
Figure 2 Evaluation of treatment efficacy on N1S1 tumor growth using ultrasound imaging.
A: Schematic representation of the experimental design of animal study; B: Representative ultrasound (US) images of orthotopic liver tumors from untreated and Sorafenib-treated (40 mg/kg) groups on Days 7, 14, 21, 28, and 35 post-cell implantation. Sagittal and axial plane images were acquired for tumor volume calculations. By injecting cells at the liver tip and imaging in both planes, a clear view of the tumor was achieved, minimizing interference from adjacent lobes and surrounding organs. Tumor regions are delineated with solid yellow lines, and linear measurements are indicated by yellow dotted lines. For tumor volume estimation, the longest dimension observed across both planes was recorded as the "long diameter," while the shortest dimension was considered the "short diameter". Tumor volume calculated using the ellipsoid formula: V = (l × s²)/2, where l is the long axis and s is the short axis, measured in mm. Post-necropsy, these dimensions were also measured using a vernier caliper and compared with US-based tumor volume assessments.
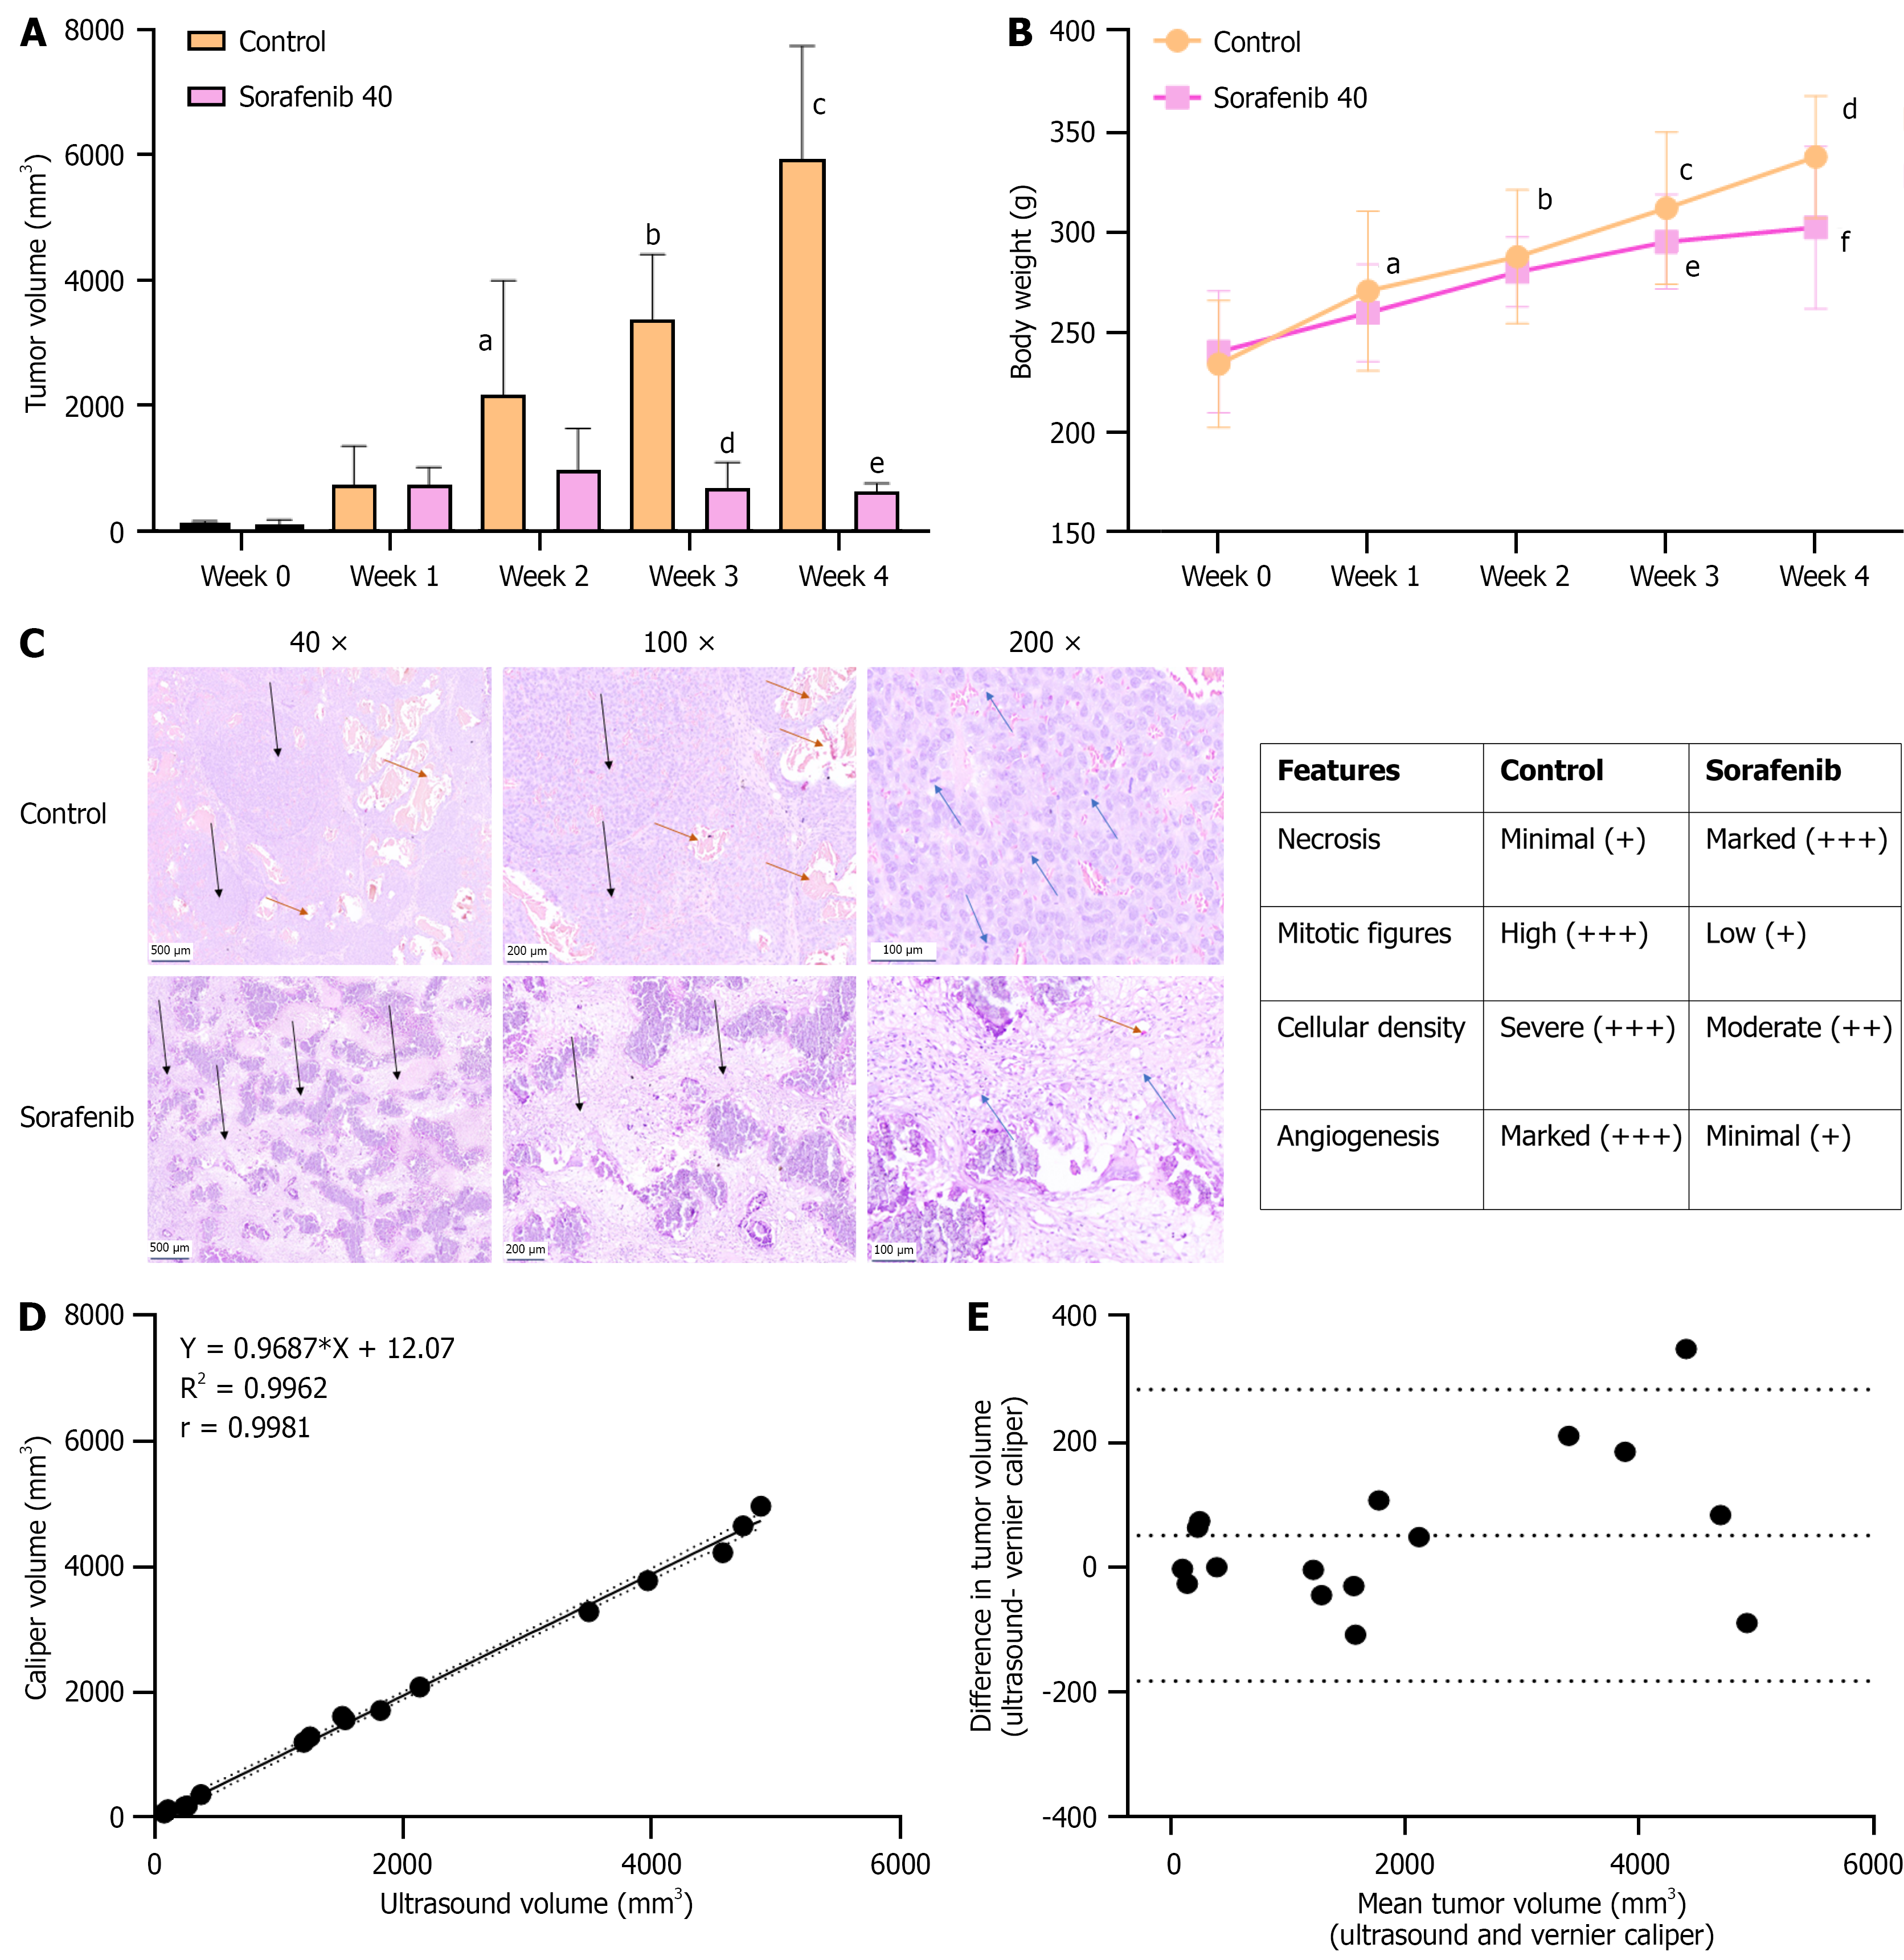
Figure 3 Correlation of ultrasound-guided tumor growth with gross tumor measurements and histopathologic features.
A: Mean tumor volume of N1S1 hepatocellular carcinoma tumors in control and Sorafenib-treated groups. Sorafenib was administered at 40 mg/kg, three times weekly for four weeks, resulting in significant tumor growth inhibition. Data represent mean ± SD (n = 14 per group). aP < 0.01 control, week 0 vs control, week 2); bP < 0.001 (control, week 0 vs control, week 3); cP < 0.001 (Control, week 0 vs control, week 4); dP < 0.001 (control, week 3 vs Sorafenib, week 3); eP < 0.001 (control, week 4 vs Sorafenib, week 4); B: Changes in body weight during the treatment period. Data represent mean ± SD (n = 14 per group). aP < 0.05 (control, week 0 vs week 1); bP < 0.001 (control, week 0 vs week 2); cP < 0.001 (control, week 0 vs week 3); dP < 0.001 (control, week 0 vs week 4); eP < 0.001 (Sorafenib, week 0 vs week 3); fP < 0.001 (Sorafenib, week 0 vs week 4); C: Histopathological evaluation of tumor tissues from control and Sorafenib-treated animals. Formalin-fixed sections were stained with hematoxylin and eosin. Images include control and Sorafenib treated tumor tissue at 40 ×, 100 × and 200 × magnification (size bar for: 500 μm = 40 ×, 200 μm = 100 ×, 100 μm = 200 ×). Control tumors showed proliferating neoplastic cells with complete liver parenchymal invasion, multifocal large neoplastic foci (black arrows), high cellularity, and numerous mitotic figures (blue arrows). Marked angiogenesis was observed (brown arrows). Sorafenib-treated tumors displayed reduced cellularity, fewer mitotic figures (blue arrows), prominent necrosis (black arrows), and mild angiogenesis (brown arrows); D: Correlation between tumor volume measurements by ultrasound (US) and vernier caliper (VC) methods. A linear correlation plot is shown with 95% confidence bands (dotted lines); Pearson correlation coefficient r = 0.9981, P < 0.001 (n = 16); E: Agreement between US and VC measurements is shown by a Bland-Altman plot. The central dotted line represents the mean bias (50.97), and the upper and lower dotted lines represent the limits of agreement (50.97 ± 1.96 × 118.9).
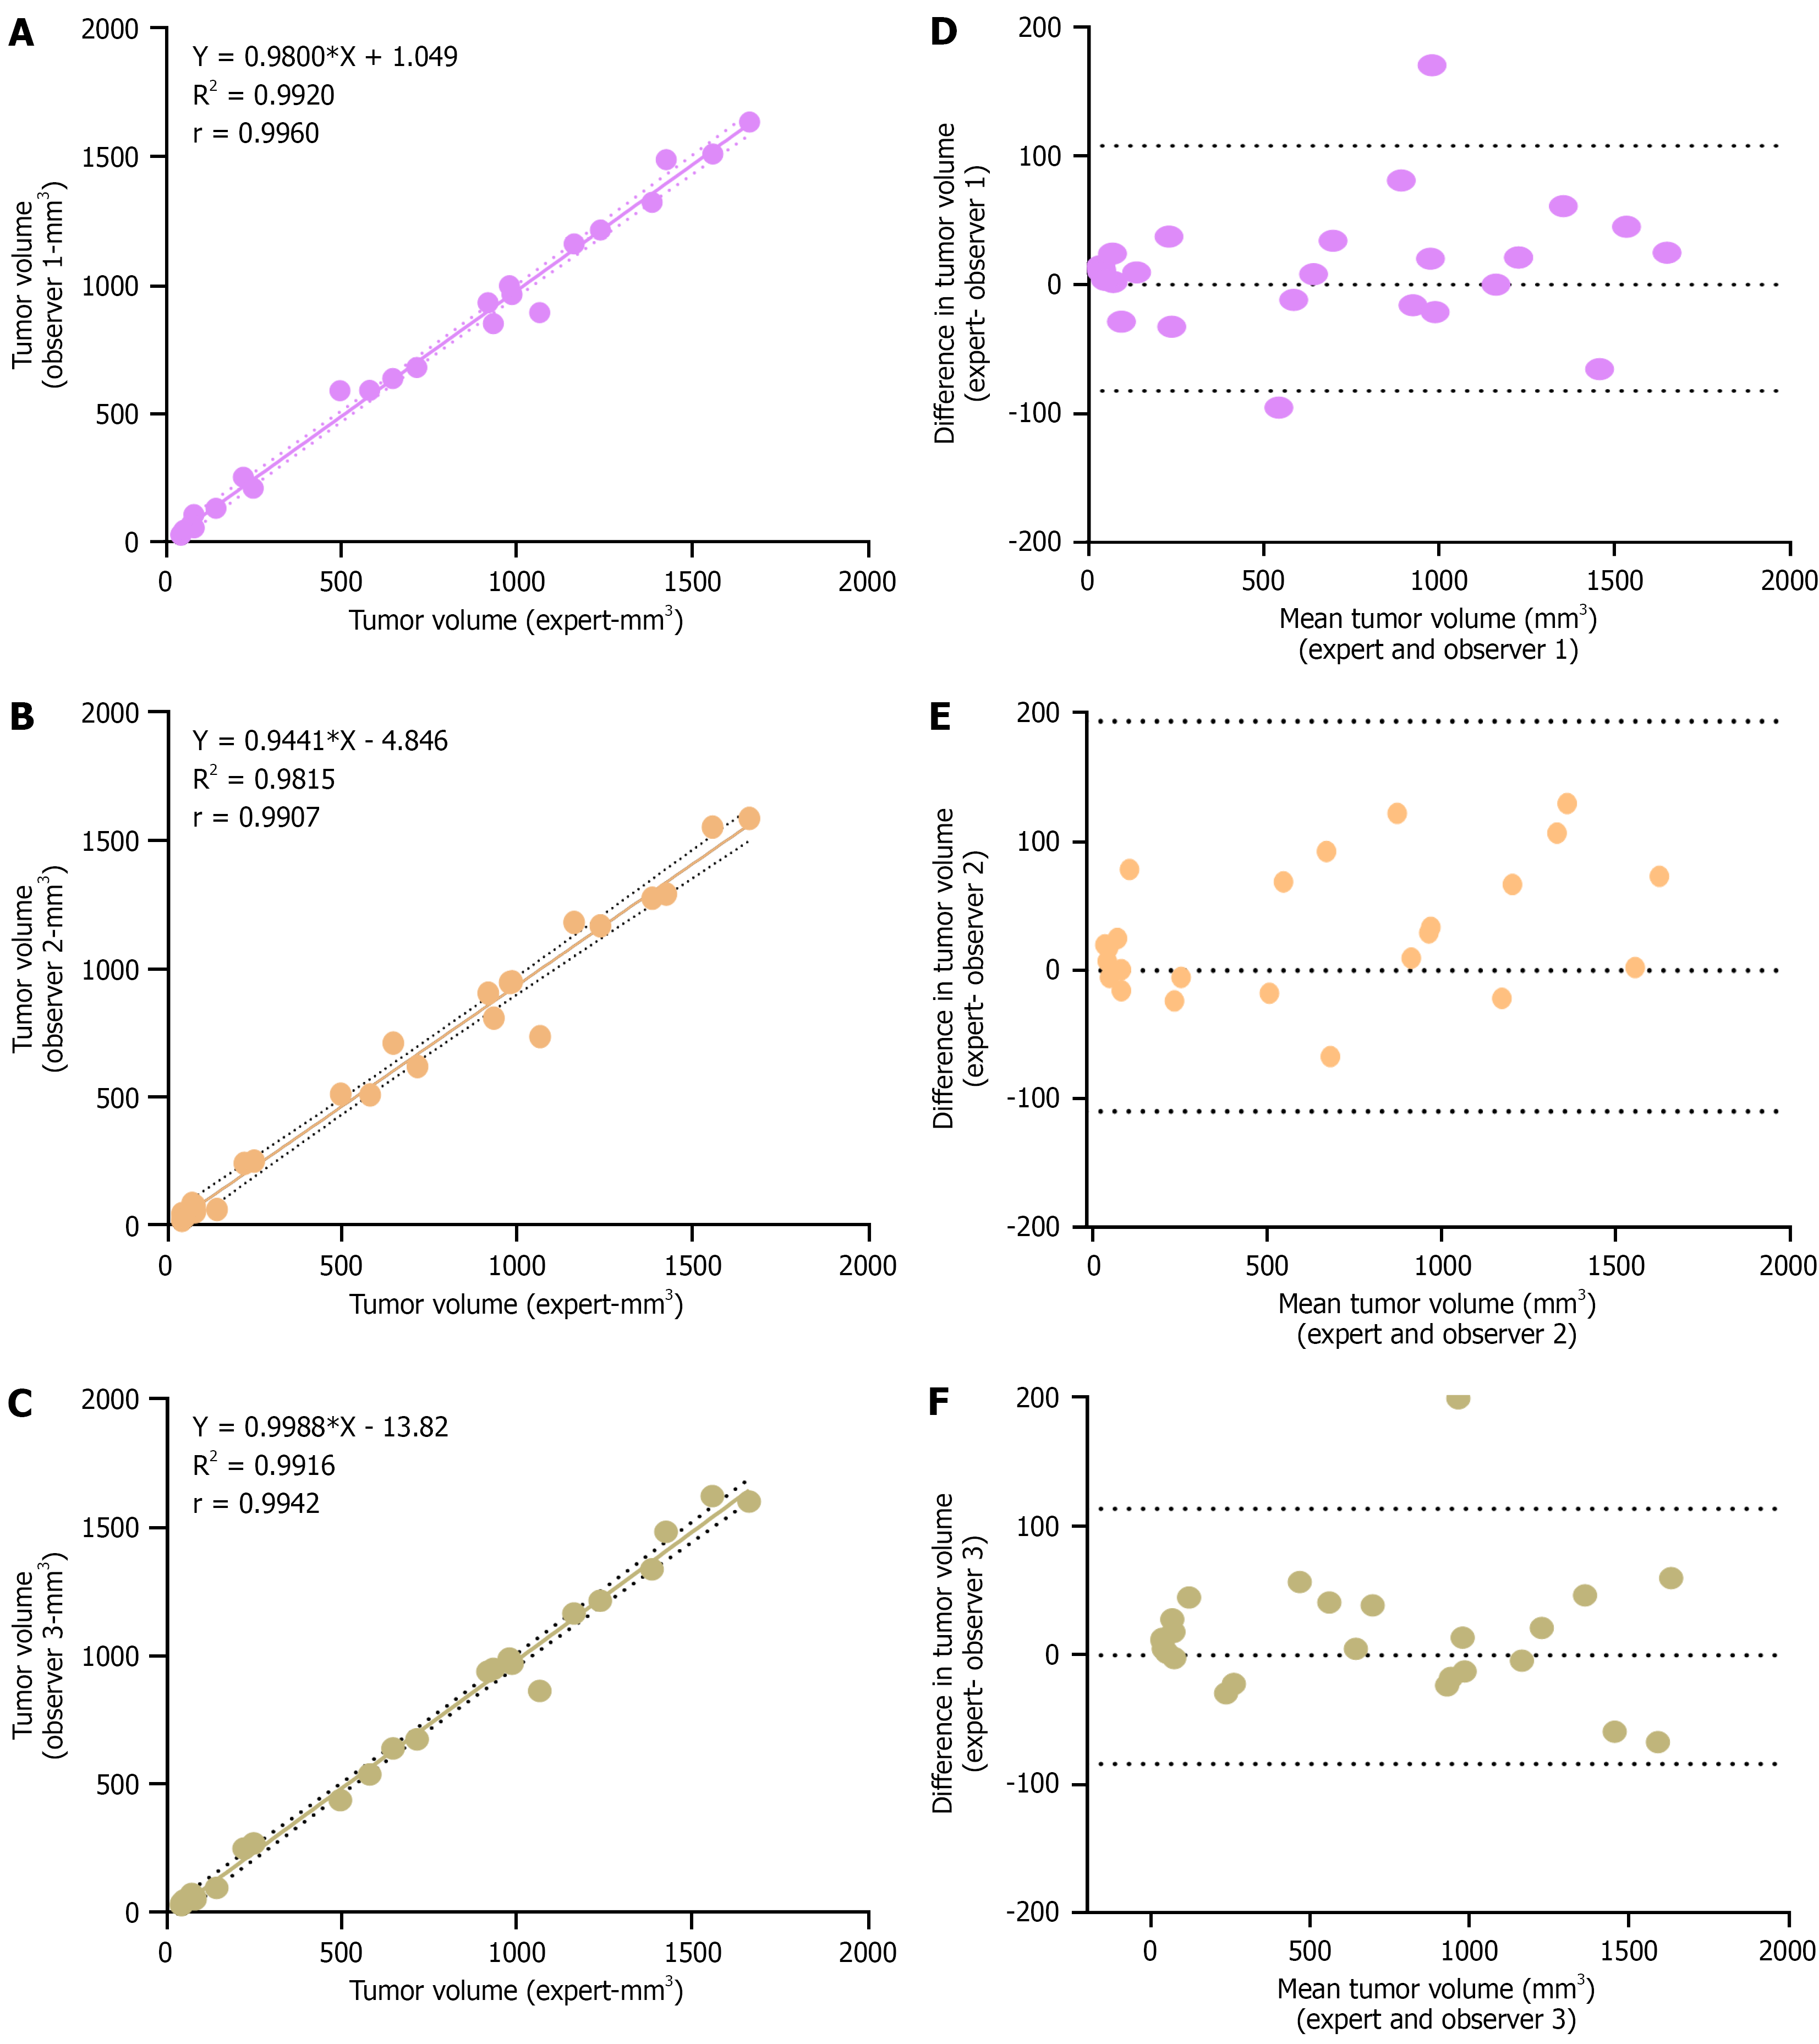
Figure 4 Evaluation of expert non-expert variability in tumor volume measurement by ultrasound imaging.
A-C: A linear correlation plot showing the association of tumour volume measurement by observer 1, 2 and 3 respectively with expert measurement. Dotted line indicates 95% confidence bands and Pearson correlation coefficient is mentioned in each plot (P < 0.001, n = 25 for each plot); D-F: Bland-Altman plots showing the deviation in observer measurements from expert measurements. Upper and lower dotted lines represent the limits of agreement.
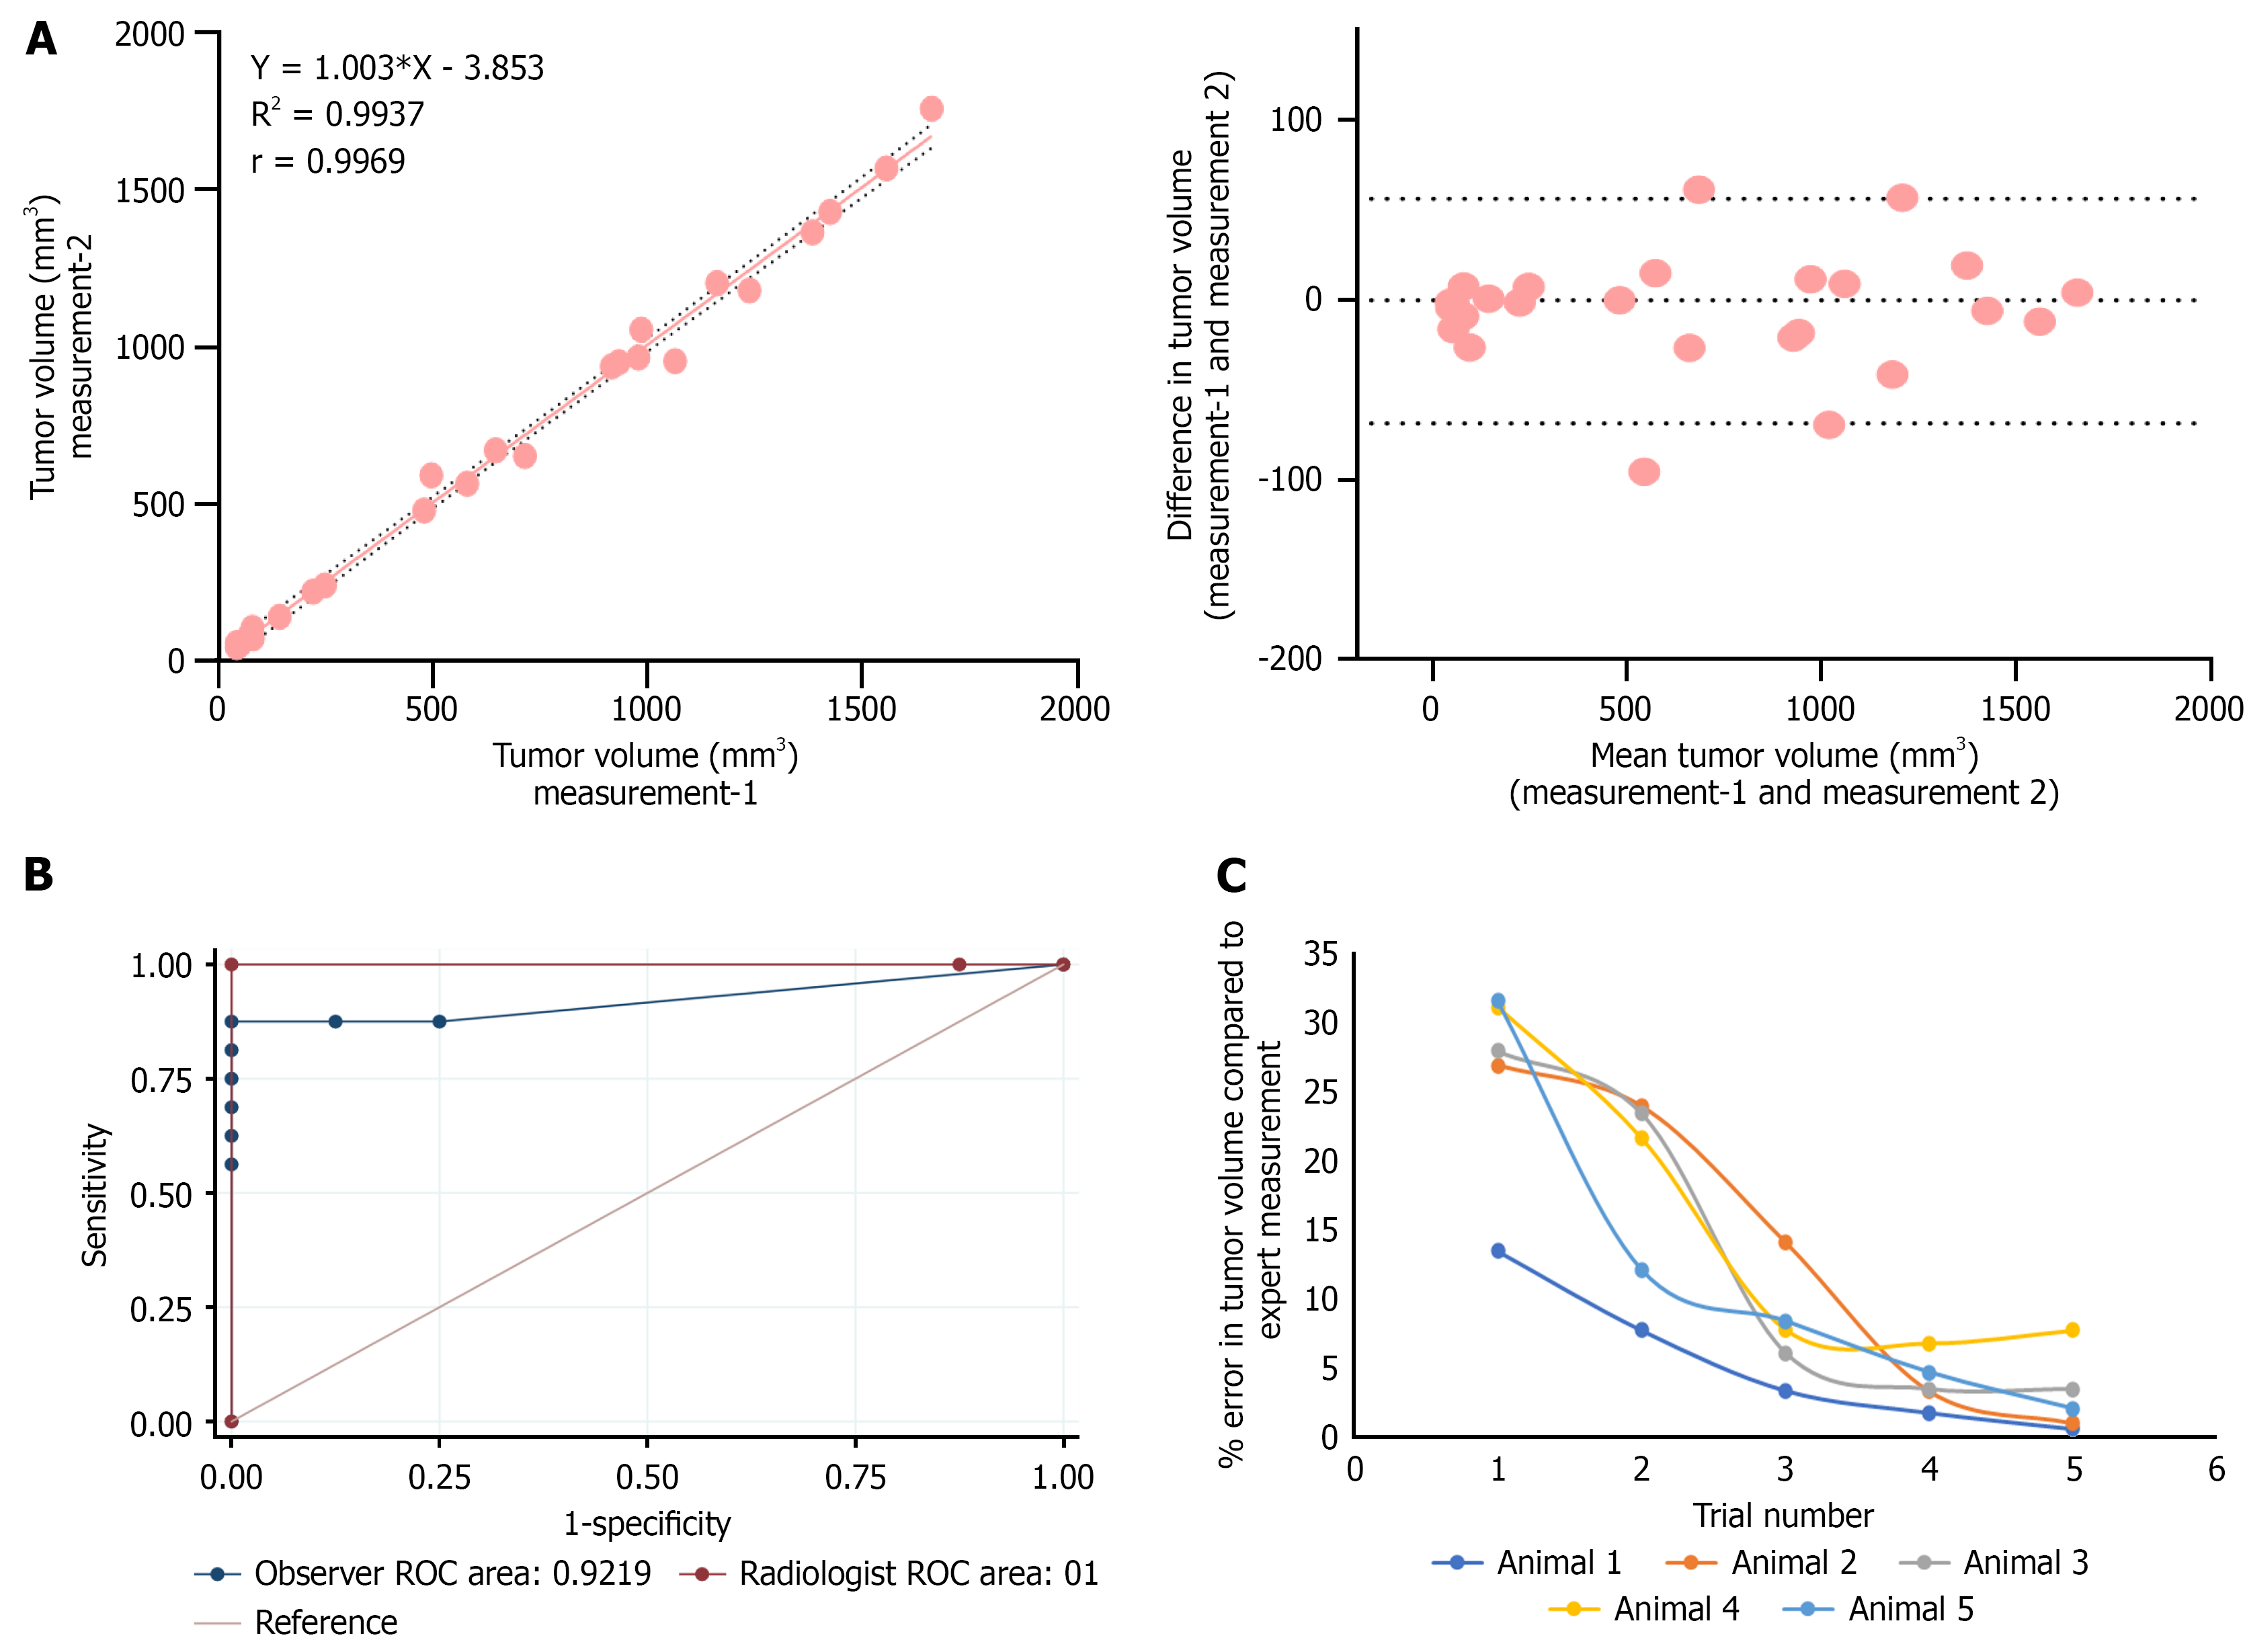
Figure 5 Evaluation of comparative receiver operating characteristics and intra-operator variability of tumor volume measurement by ultrasound imaging.
A: Linear correlation and Bland–Altman plot showing the agreement between two independent tumor volume measurements performed by a single observer(n = 25); B: Receiver operating characteristics curves evaluating the diagnostic accuracy of ultrasound-guided tumor volume measurement performed by an expert radiologist and a non-expert(n = 25). Sensitivity and specificity were calculated using visual inspection and histopathological confirmation as the gold standard. The area under the curve (AUC) for expert measurements was 1, indicating excellent discriminatory ability, while AUC of observer was slight reduced as 0.92 as the non-expert observer misclassified two tumor and two non-tumor samples, resulting in a sensitivity of 87.5% and specificity of 75%; C: Learning curve of a non-expert trainee for ultrasound-based tumor volume measurement (n = 5). The cumulative percentage error decreased from 148% to 16% by the fifth day of training. ROC: Receiver operating characteristics.
- Citation: Devan AR, Sasidharan SM, Sreekumar KP, Unni AKK, Mangalathillam S, Ansar A, Unni AR, Nath LR. Ultrasound imaging-guided protocol for monitoring tumor growth in orthotopic rat model of hepatocellular carcinoma. World J Hepatol 2025; 17(10): 109517
- URL: https://www.wjgnet.com/1948-5182/full/v17/i10/109517.htm
- DOI: https://dx.doi.org/10.4254/wjh.v17.i10.109517


