Copyright
©The Author(s) 2024.
World J Hepatol. Aug 27, 2024; 16(8): 1177-1184
Published online Aug 27, 2024. doi: 10.4254/wjh.v16.i8.1177
Published online Aug 27, 2024. doi: 10.4254/wjh.v16.i8.1177
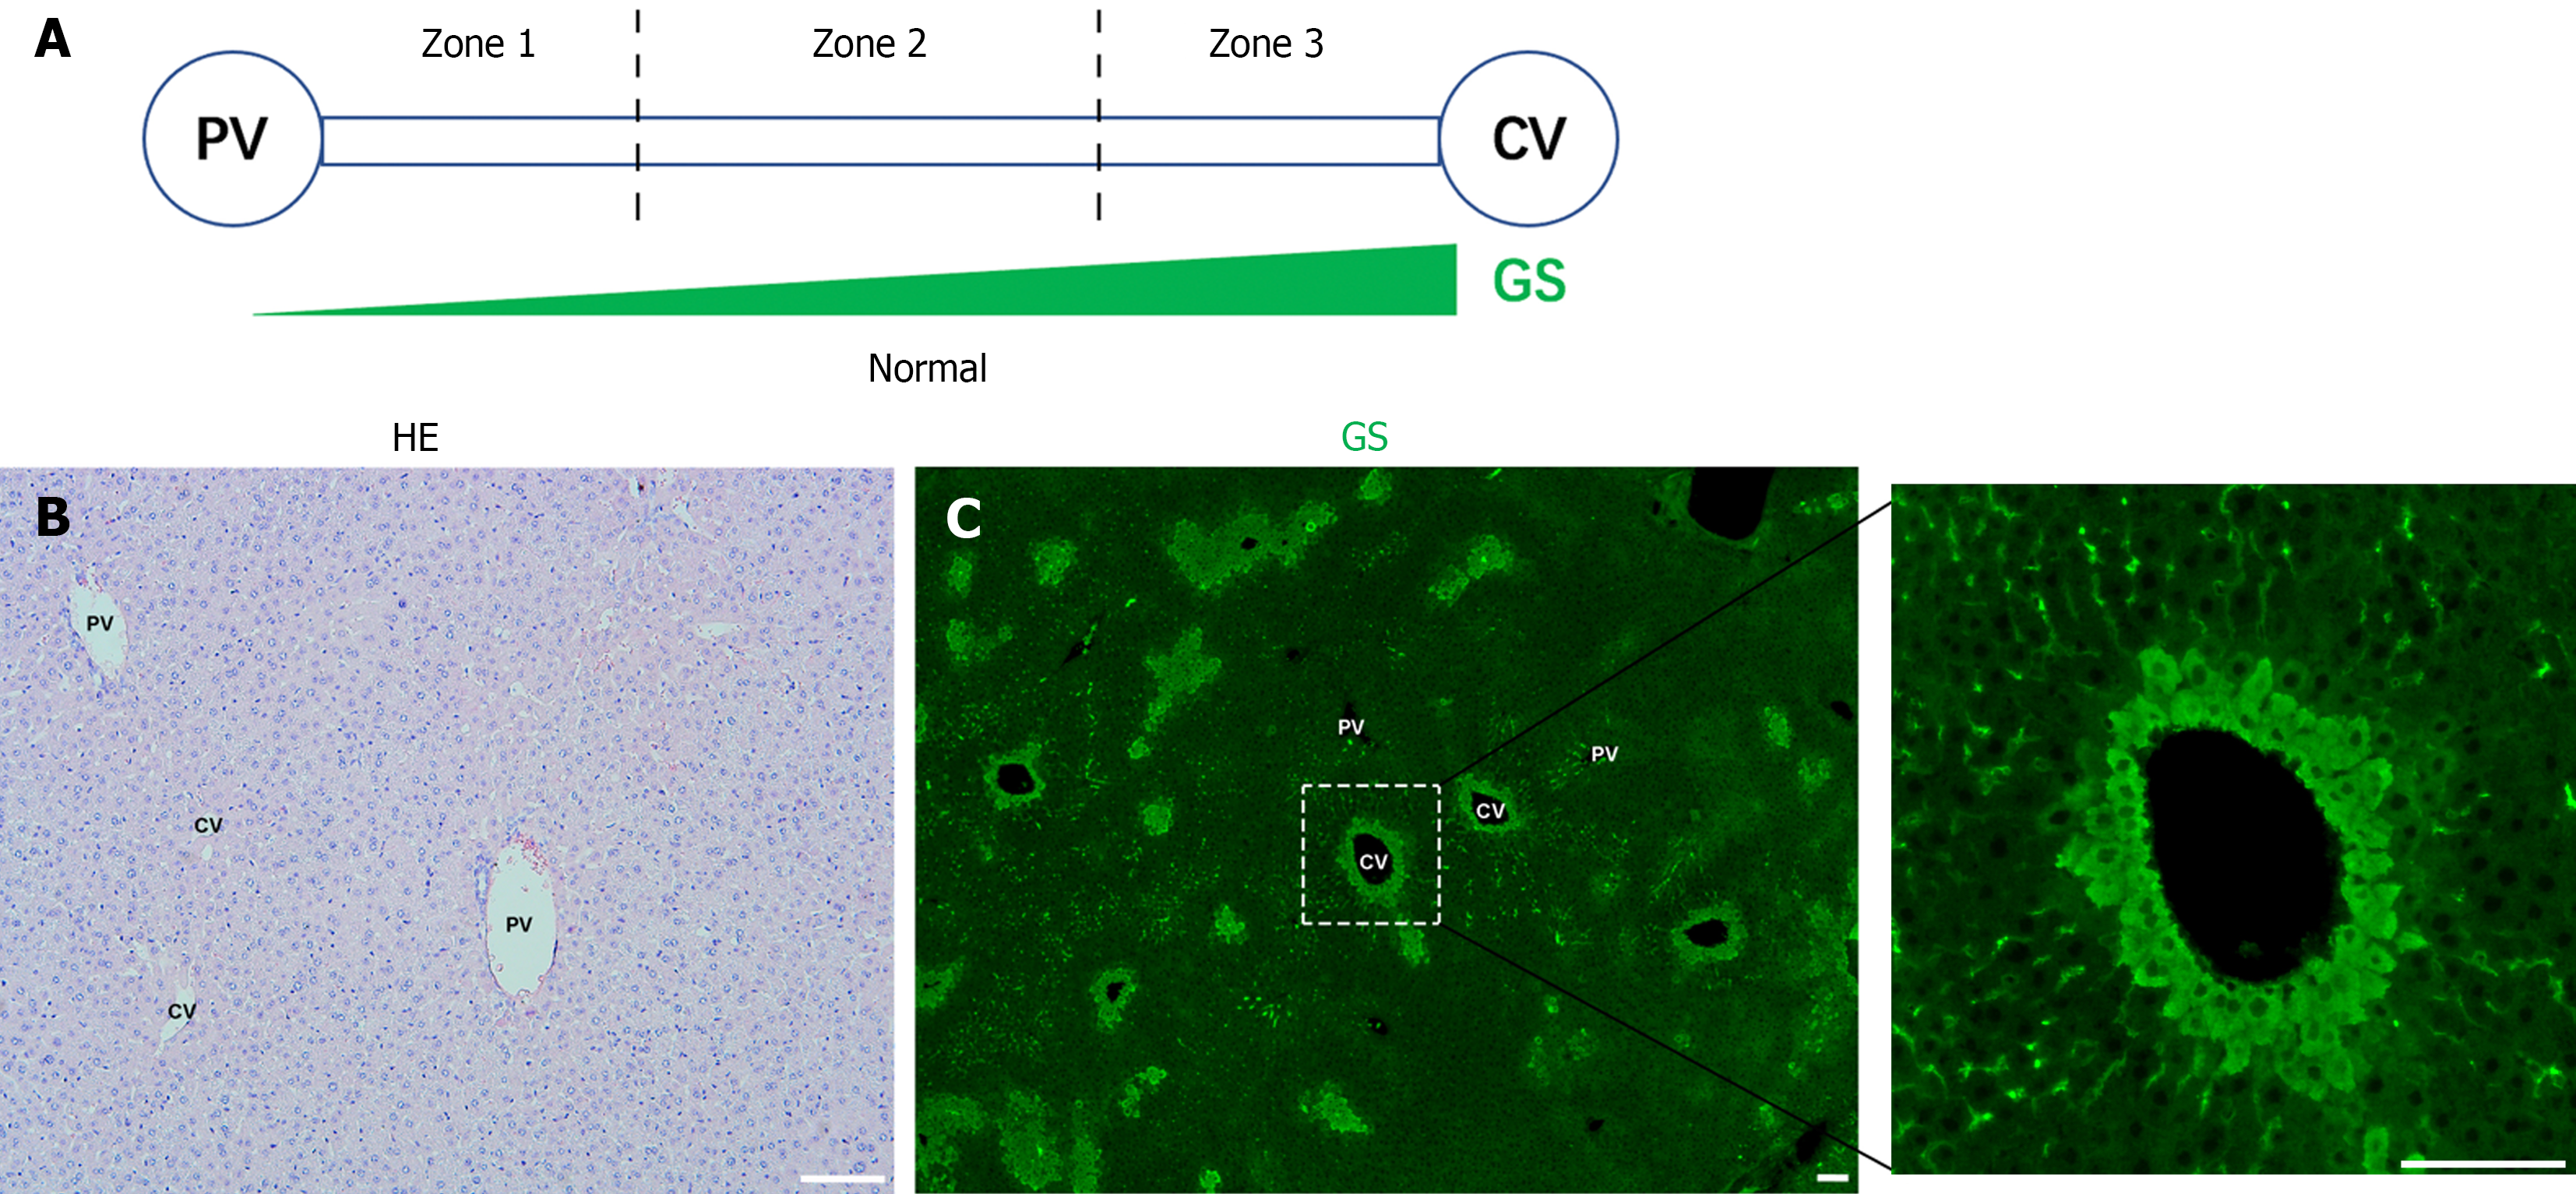
Figure 1 The distribution of glutamine synthetase in normal liver.
A: Schematic illustration of liver zonation; B: Liver tissues from C57BL/6J mice were processed for hematoxylin and eosin staining. Scale bar: 100 μm; C: Liver tissues from C57BL/6J mice were processed glutamine synthetase immunofluorescence staining (green). Scale bar: 100 μm. Representative images are displayed, with six mice in each group. The experiment was repeated at least three times to ensure reproducibility and reliability of the results. PV: Portal vessels; CV: Central vessels; GS: Glutamine synthetase; HE: Hematoxylin and eosin; IR: Ischemia-reperfusion.
Figure 2 Distribution of glutamine synthetase in the liver after 0.
5 hours of ischemia-reperfusion. A: Following 1 hour of ischemia, C57BL/6J mice resumed perfusion, and liver tissues were collected 0.5 hours later. Harvested liver tissues were processed for hematoxylin and eosin staining. Scale bar: 100 μm; B: Liver tissues were processed for immunofluorescence staining using glutamine synthetase (green). Scale bar: 100 μm. Representative images are displayed, with six mice in each group. The experiment was repeated at least three times to ensure reproducibility and reliability of the results. PV: Portal vessels; CV: Central vessels; HE: Hematoxylin and eosin; IR: Ischemia-reperfusion.
Figure 3 Distribution of glutamine synthetase in the liver after 6 hours of ischemia-reperfusion.
A: Following 1 hour of ischemia, C57BL/6J mice resumed perfusion, and liver tissues were collected 6 hours later. Harvested liver tissues were processed for hematoxylin and eosin staining. Scale bar: 100 μm; B: Liver tissues were processed for immunofluorescence staining using glutamine synthetase (green). Scale bar: 100 μm. Representative images are displayed, with six mice in each group. The experiment was repeated at least three times to ensure reproducibility and reliability of the results. PV: Portal vessels; CV: Central vessels; HE: Hematoxylin and eosin; IR: Ischemia-reperfusion.
Figure 4 Distribution of glutamine synthetase in the liver after 12 hours of ischemia-reperfusion.
A: Following 1 hour of ischemia, C57BL/6J mice resumed perfusion, and liver tissues were collected 12 hours later. Harvested liver tissues were processed for hematoxylin and eosin staining. Scale bar: 100 μm; B: Liver tissues were processed for immunofluorescence staining using glutamine synthetase (green). Scale bar: 100 μm. Representative images are displayed, with six mice in each group. The experiment was repeated at least three times to ensure reproducibility and reliability of the results. PV: Portal vessels; CV: Central vessels; HE: Hematoxylin and eosin; IR: Ischemia-reperfusion.
Figure 5 Distribution of glutamine synthetase in the liver after 24 hours of ischemia-reperfusion.
A: Following 1 hour of ischemia, C57BL/6J mice resumed perfusion, and liver tissues were collected 24 hours later. Harvested liver tissues were processed for hematoxylin and eosin staining. Scale bar: 100 μm; B: Liver tissues were processed for immunofluorescence staining using glutamine synthetase (green). Scale bar: 100 μm. Representative images are displayed, with six mice in each group. The experiment was repeated at least three times to ensure reproducibility and reliability of the results. Representative images are displayed, with six mice in each group. The experiment was repeated at least three times to ensure reproducibility and reliability of the results. PV: Portal vessels; CV: Central vessels; HE: Hematoxylin and eosin; IR: Ischemia-reperfusion.
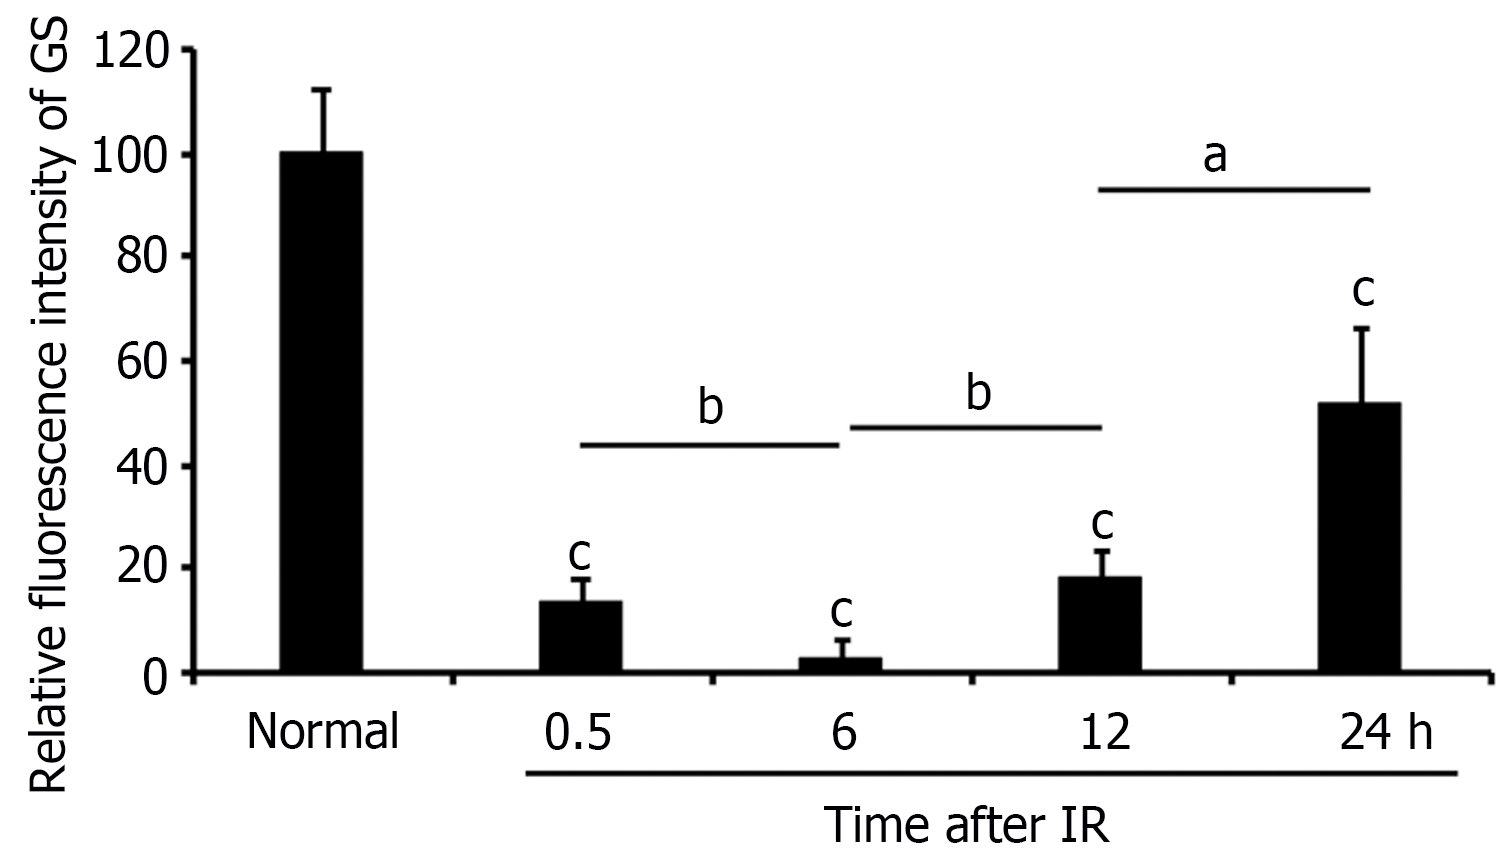
Figure 6 Changes in glutamine synthetase expression at different time points during liver ischemia-reperfusion.
The glutamine synthetase-positive area in the central vein region in the images of Figures 1-5 was analyzed using Image J. The values of the normal group were used as the baseline, and the values of the groups at different time points after ischemia-reperfusion were compared to those of the normal group. Mean ± SEM. IR: Ischemia-reperfusion; GS: Glutamine synthetase. aP < 0.05, bP < 0.01, cP < 0.001.
- Citation: Huang ZH, Dong MQ, Liu FY, Zhou WJ. Dynamics of glutamine synthetase expression in hepatic ischemia-reperfusion injury: Implications for therapeutic interventions. World J Hepatol 2024; 16(8): 1177-1184
- URL: https://www.wjgnet.com/1948-5182/full/v16/i8/1177.htm
- DOI: https://dx.doi.org/10.4254/wjh.v16.i8.1177


