Copyright
©The Author(s) 2024.
World J Hepatol. Jun 27, 2024; 16(6): 951-965
Published online Jun 27, 2024. doi: 10.4254/wjh.v16.i6.951
Published online Jun 27, 2024. doi: 10.4254/wjh.v16.i6.951
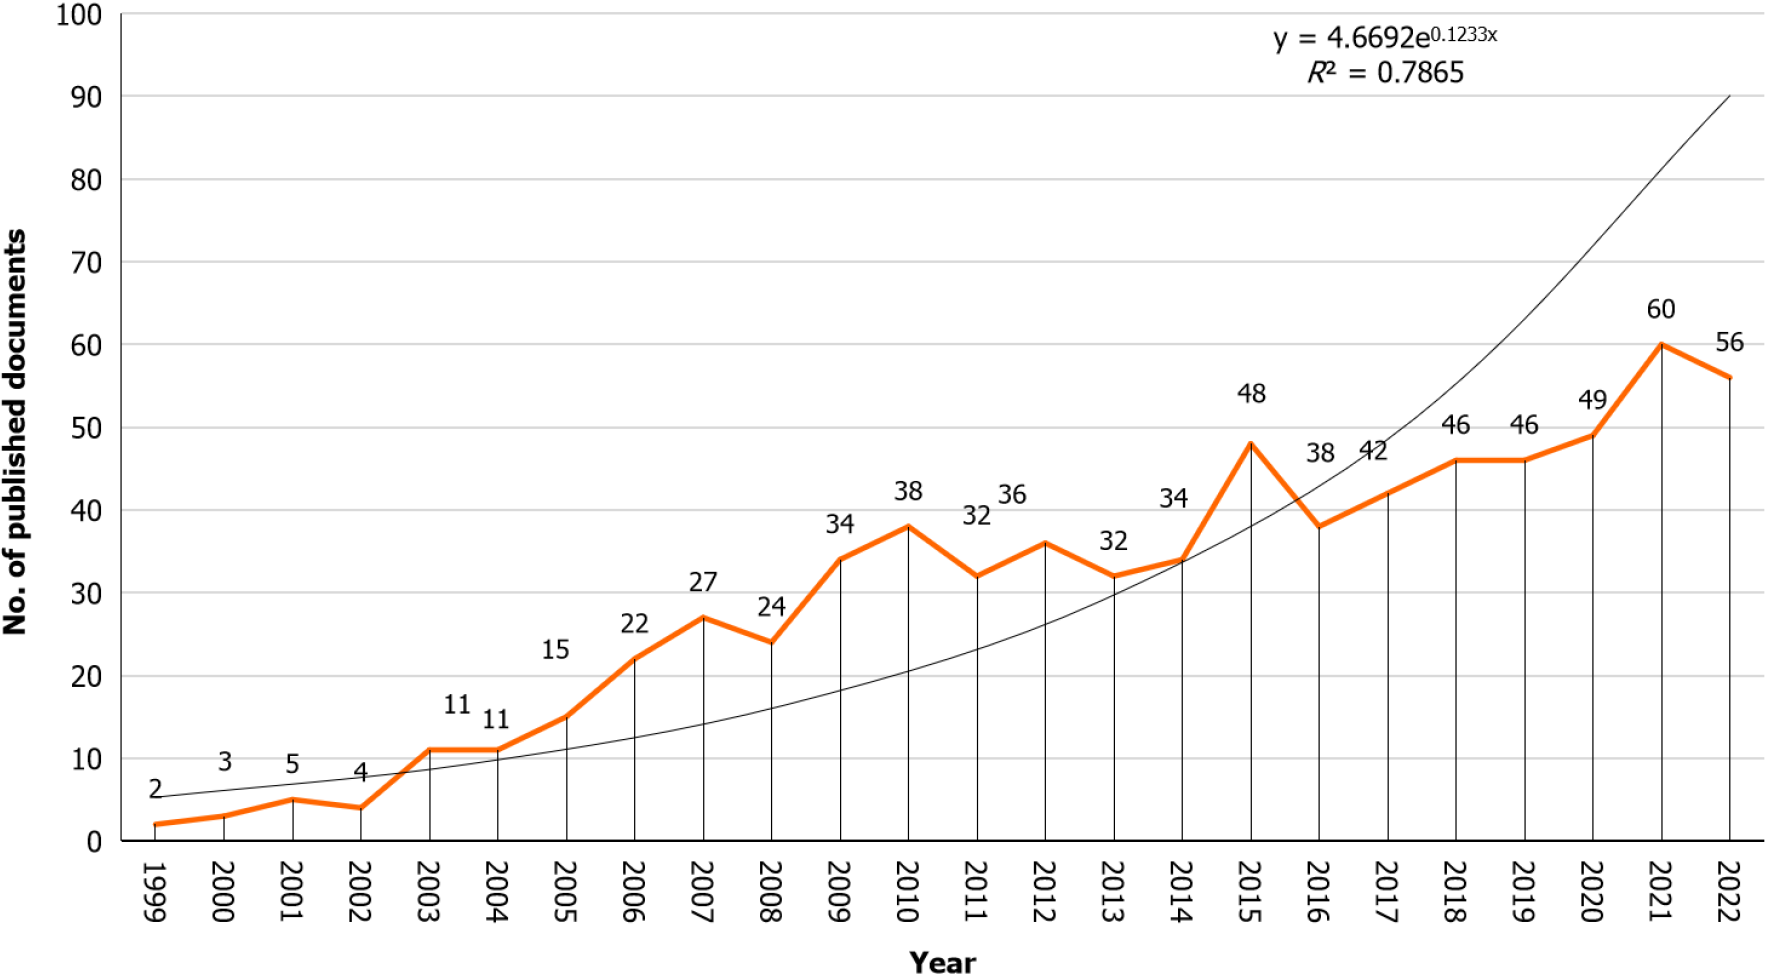
Figure 1 Growth trend of publications on insulin resistance and nonalcoholic fatty liver disease from 1999 to 2022.
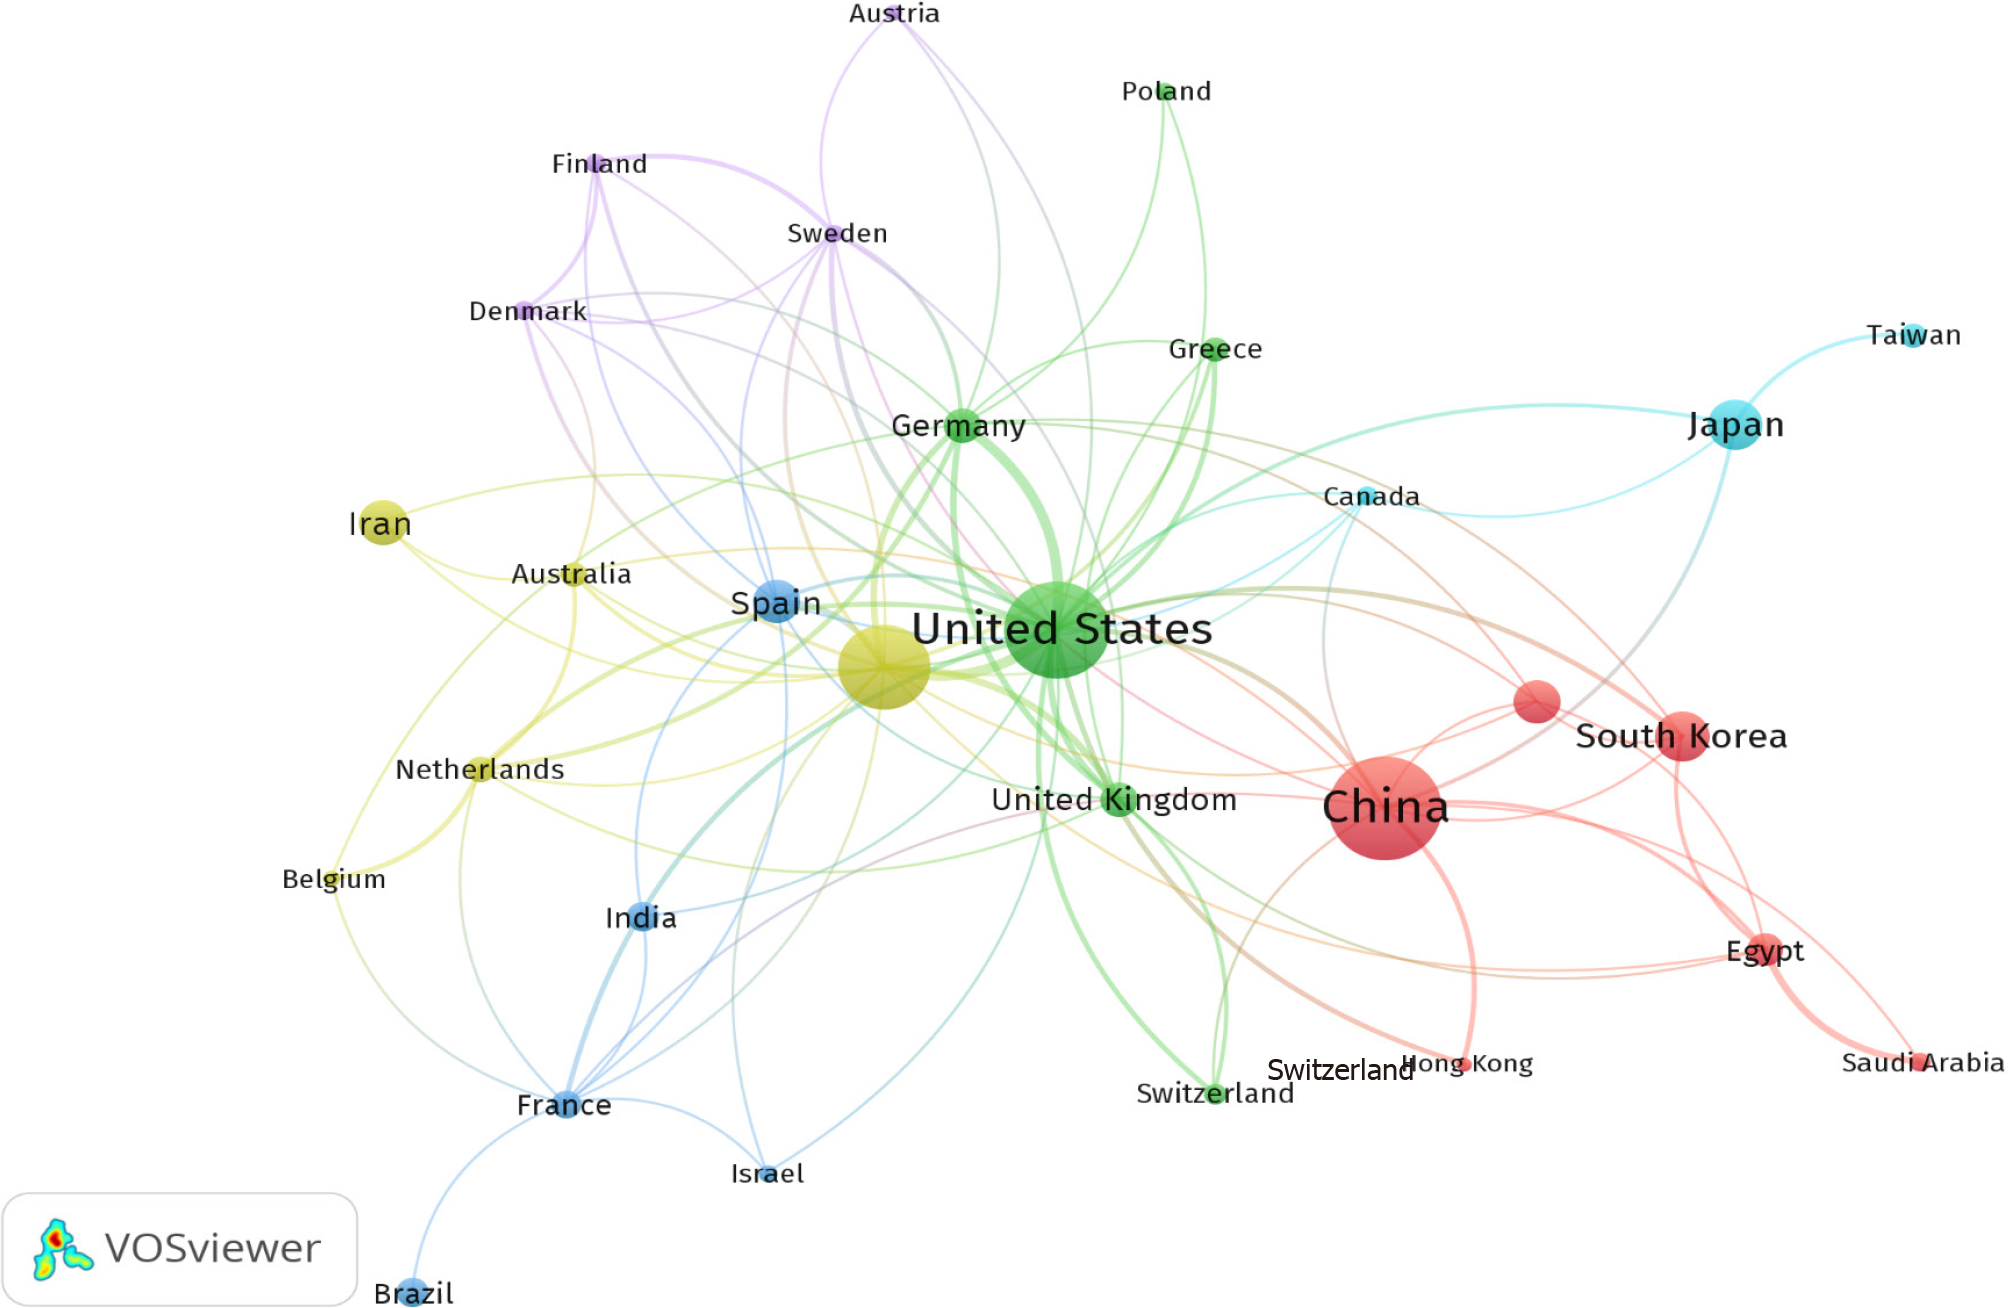
Figure 2 Visualization of global research collaborations in insulin resistance and nonalcoholic fatty liver disease: A network map spanning 1999 to 2022.
Nodes indicate countries with significant collaborations (minimum of five publications per country) among 60 active nations. Size indicates the publication count.
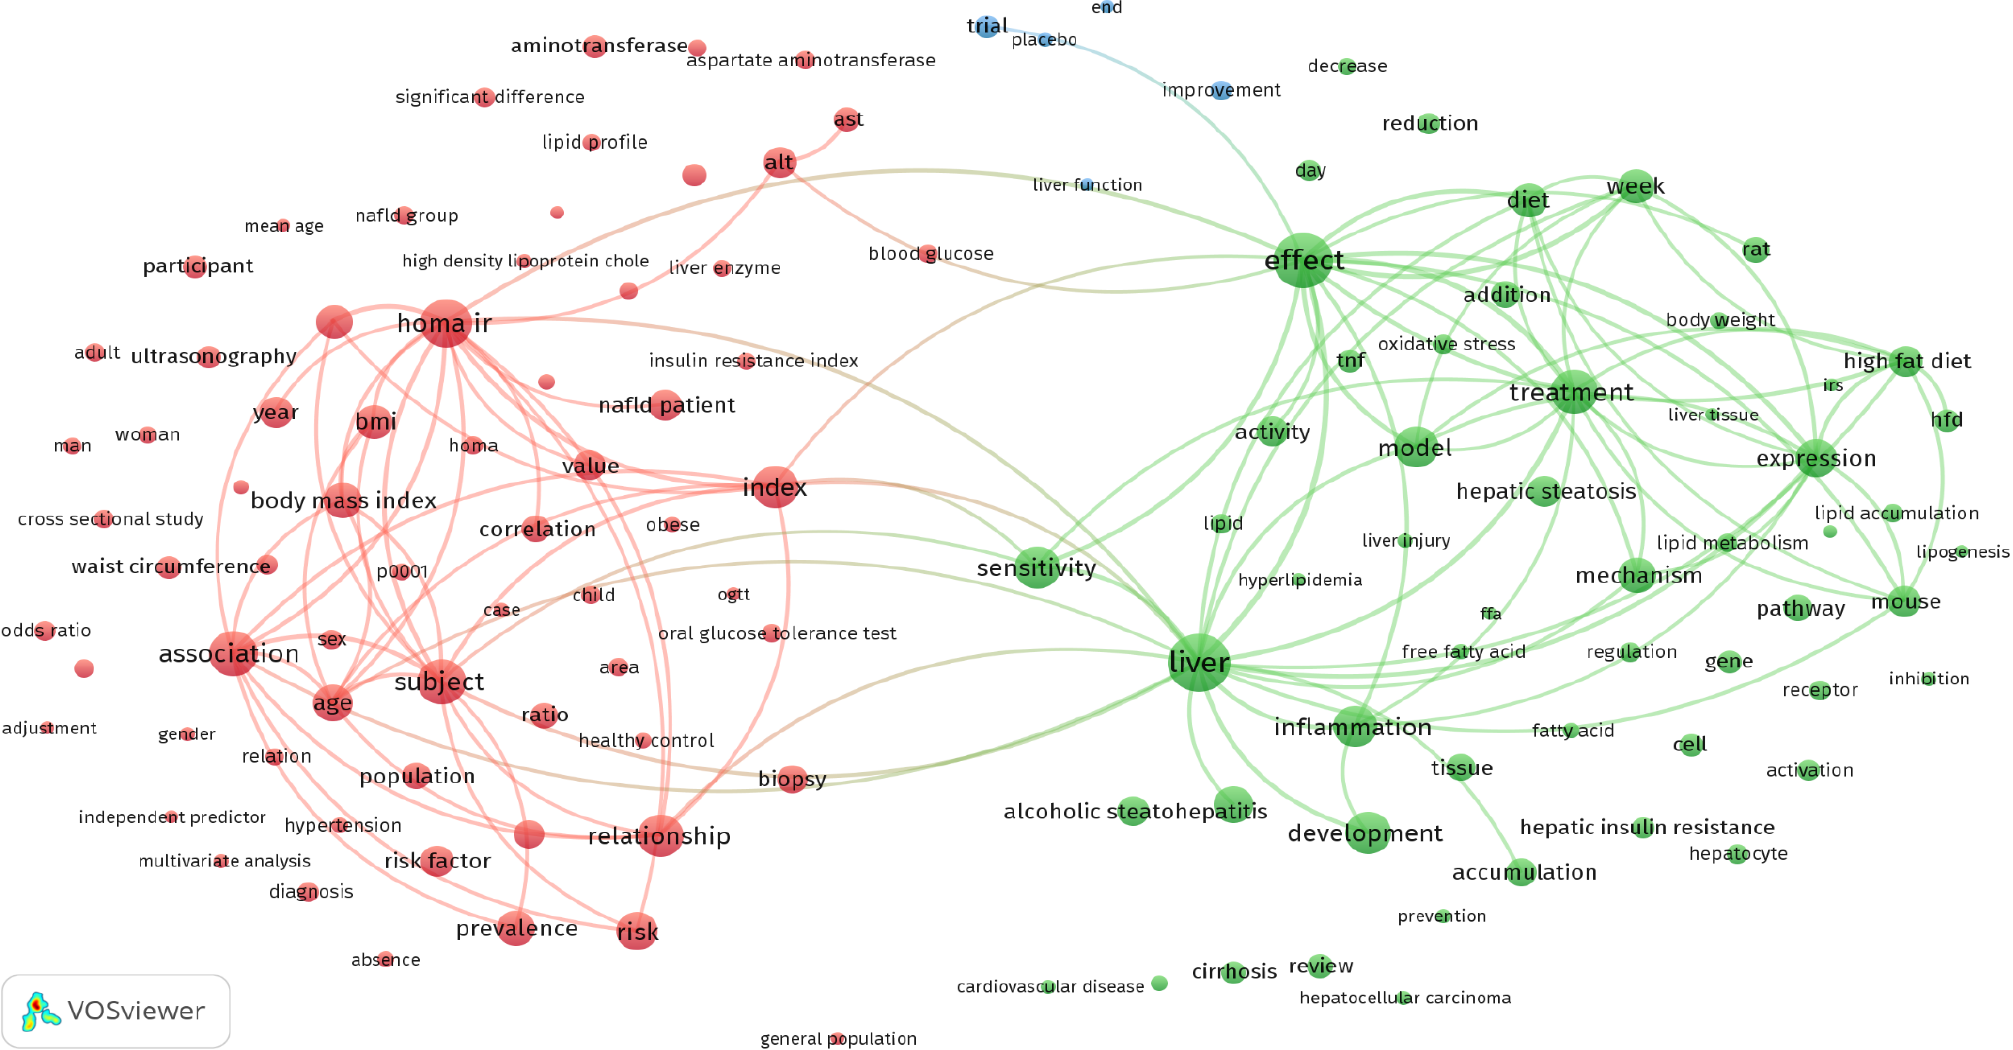
Figure 3 Visualization map of term networks in the titles and abstracts of publications on insulin resistance and nonalcoholic fatty liver disease between 1999 and 2022.
The map was generated with a minimum term occurrence set at 20 times, resulting in 211 terms meeting this criterion among 34784 in the field. The terms are organized into three clusters, each shown in a different color. The size of each node corresponds to the number of publications utilizing that particular term.
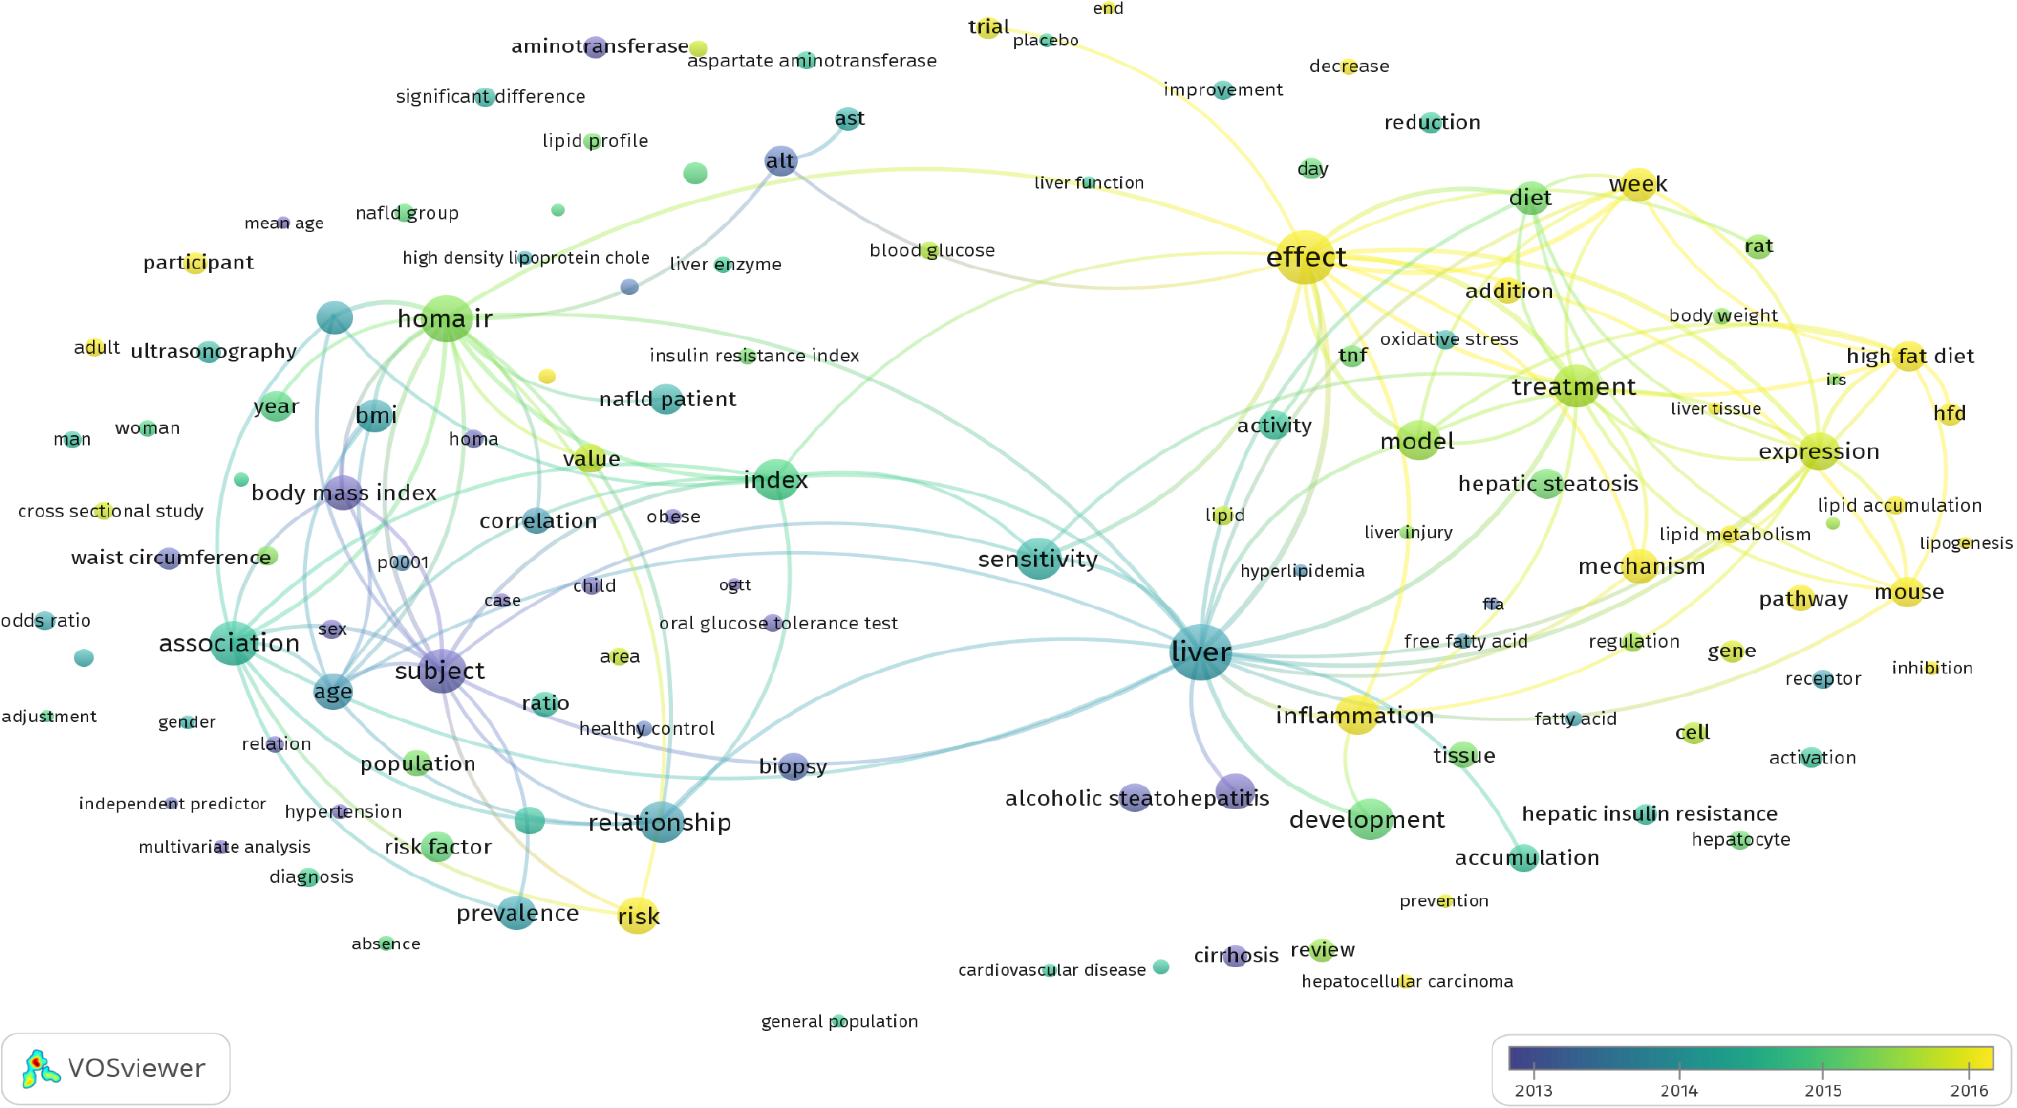
Figure 4 Visualization map of the network of terms in the title/abstracts of publications on insulin resistance and nonalcoholic fatty liver disease (1999-2022) with analysis of their distribution by mean frequency.
Chronological emergence: Blue terms first, followed by yellow and green terms.
- Citation: Zyoud SH, Hegazi OE, Alalalmeh SO, Shakhshir M, Abushamma F, Khilfeh S, Al-Jabi SW. Mapping the global research landscape on nonalcoholic fatty liver disease and insulin resistance: A visualization and bibliometric study. World J Hepatol 2024; 16(6): 951-965
- URL: https://www.wjgnet.com/1948-5182/full/v16/i6/951.htm
- DOI: https://dx.doi.org/10.4254/wjh.v16.i6.951


