Copyright
©The Author(s) 2024.
World J Hepatol. Apr 27, 2024; 16(4): 601-611
Published online Apr 27, 2024. doi: 10.4254/wjh.v16.i4.601
Published online Apr 27, 2024. doi: 10.4254/wjh.v16.i4.601
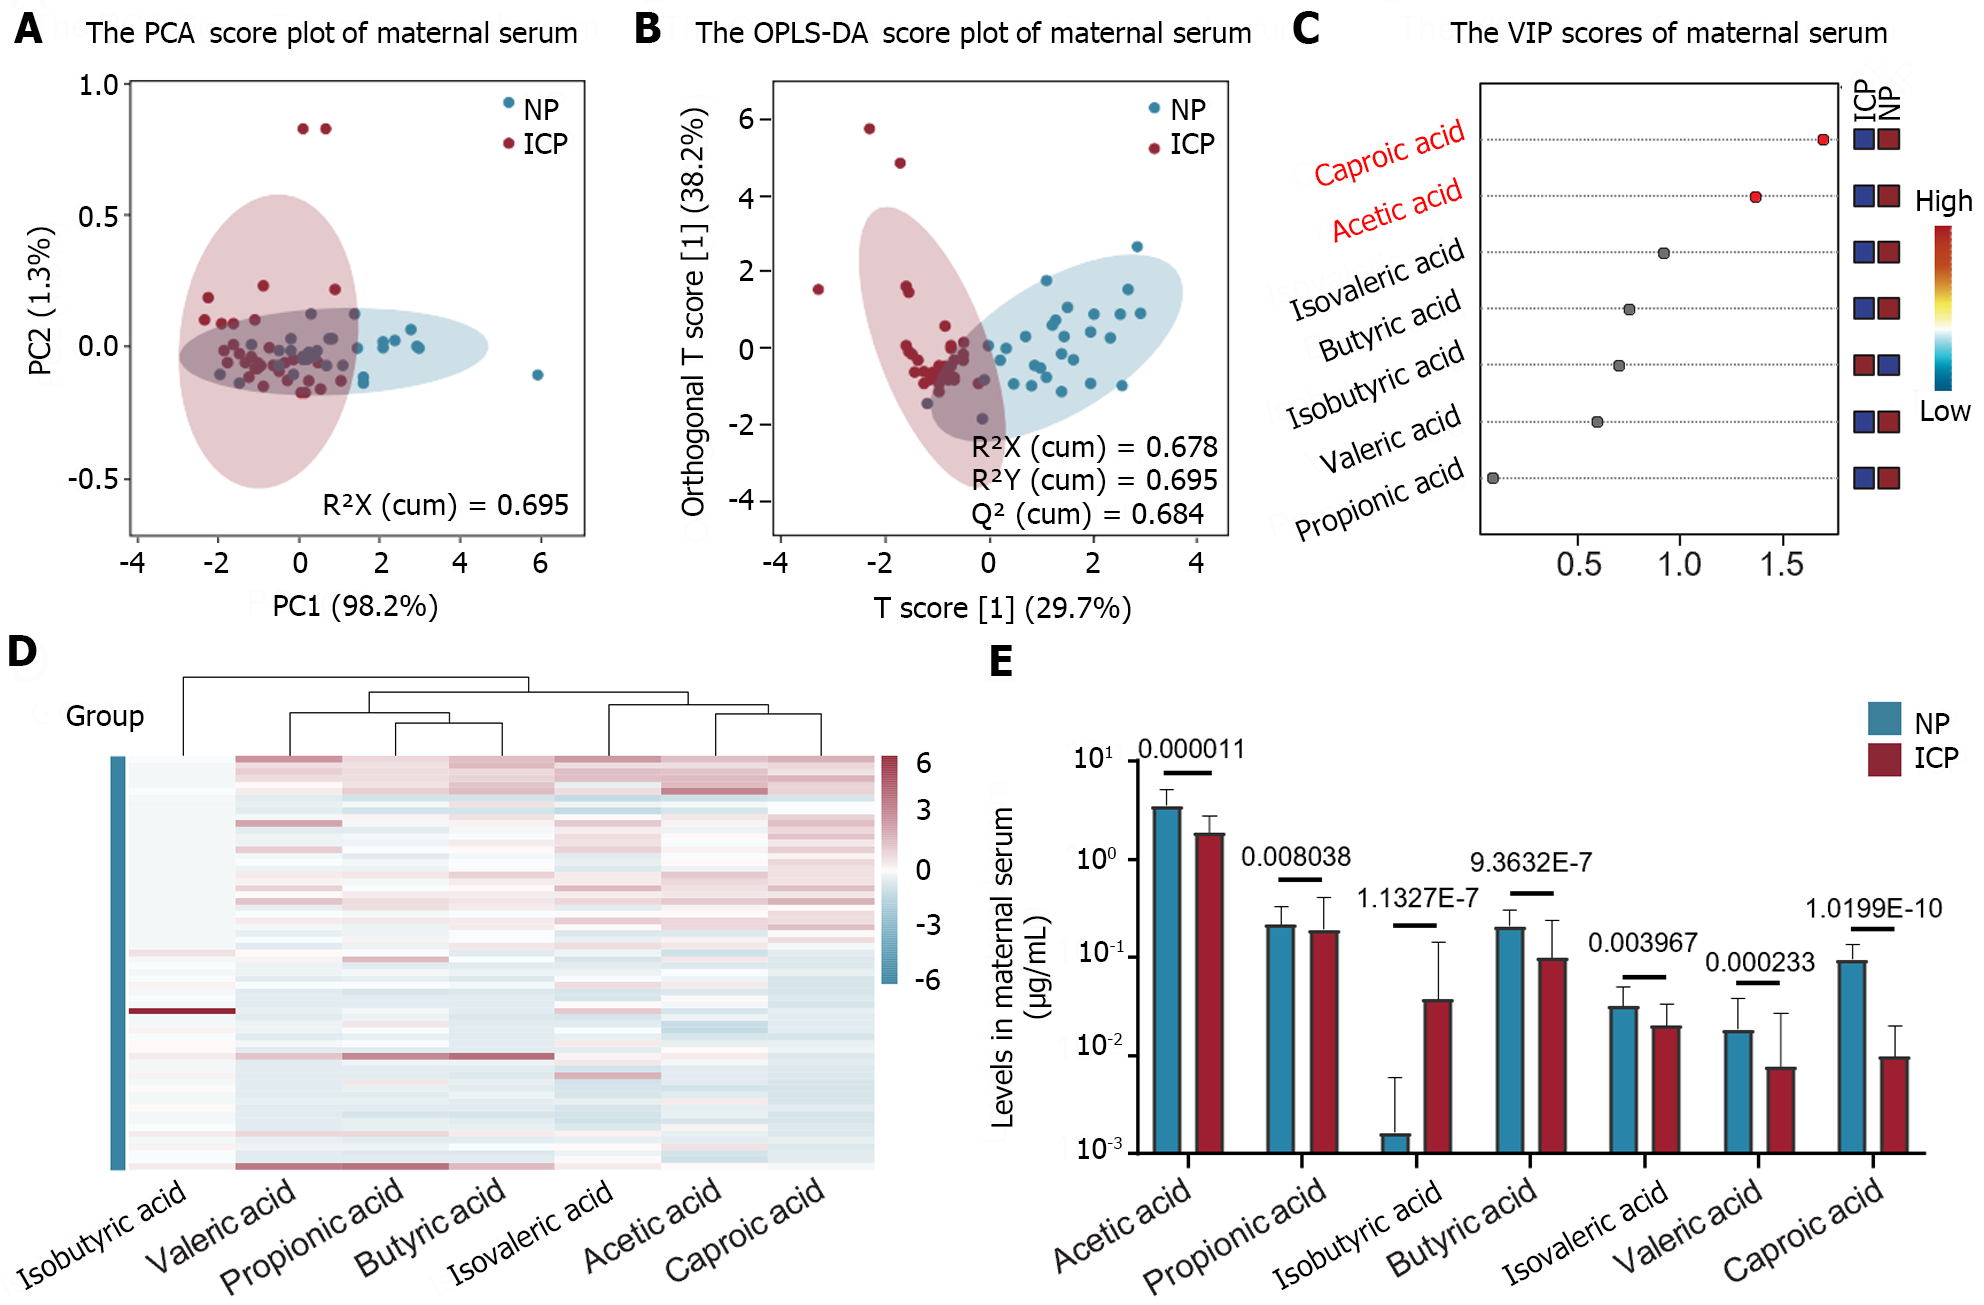
Figure 1 Characteristics of altered maternal serum short-chain fatty acids metabolic spectrum in intrahepatic cholestasis of pregnancy patients.
A: Principal Component Analysis score plot: intrahepatic cholestasis of pregnancy (ICP) patients displayed a clear distinction from the normal pregnant women; B: Orthogonal Projections to Latent Structures Discriminant Analysis score plot: ICP patients showed a clear distinction from the normal pregnant women; C: Variable importance for the projection diagram: The differences in the maternal serum short-chain fatty acids (SCFAs) between the two groups of subjects can be attributed to the significant impact of acetic acid and caproic acid as crucial metabolites; D: Heat map: All SCFAs in the serum of ICP patients, except for isobutyric acid, demonstrated a decreasing trend; E: Quantitative analysis bar chart: Acetic acid showed the highest concentration in maternal serum. The content of isobutyric acid displayed the most significant difference between the two groups, thereby exhibiting extremely low levels in the normal pregnant women. NP: n = 30; ICP: n = 34. PCA: Principal Component Analysis; SCFAs: Short-chain fatty acids; OPLS-DA: Orthogonal Projections to Latent Structures Discriminant Analysis; VIP: Variable Importance for the Projection.
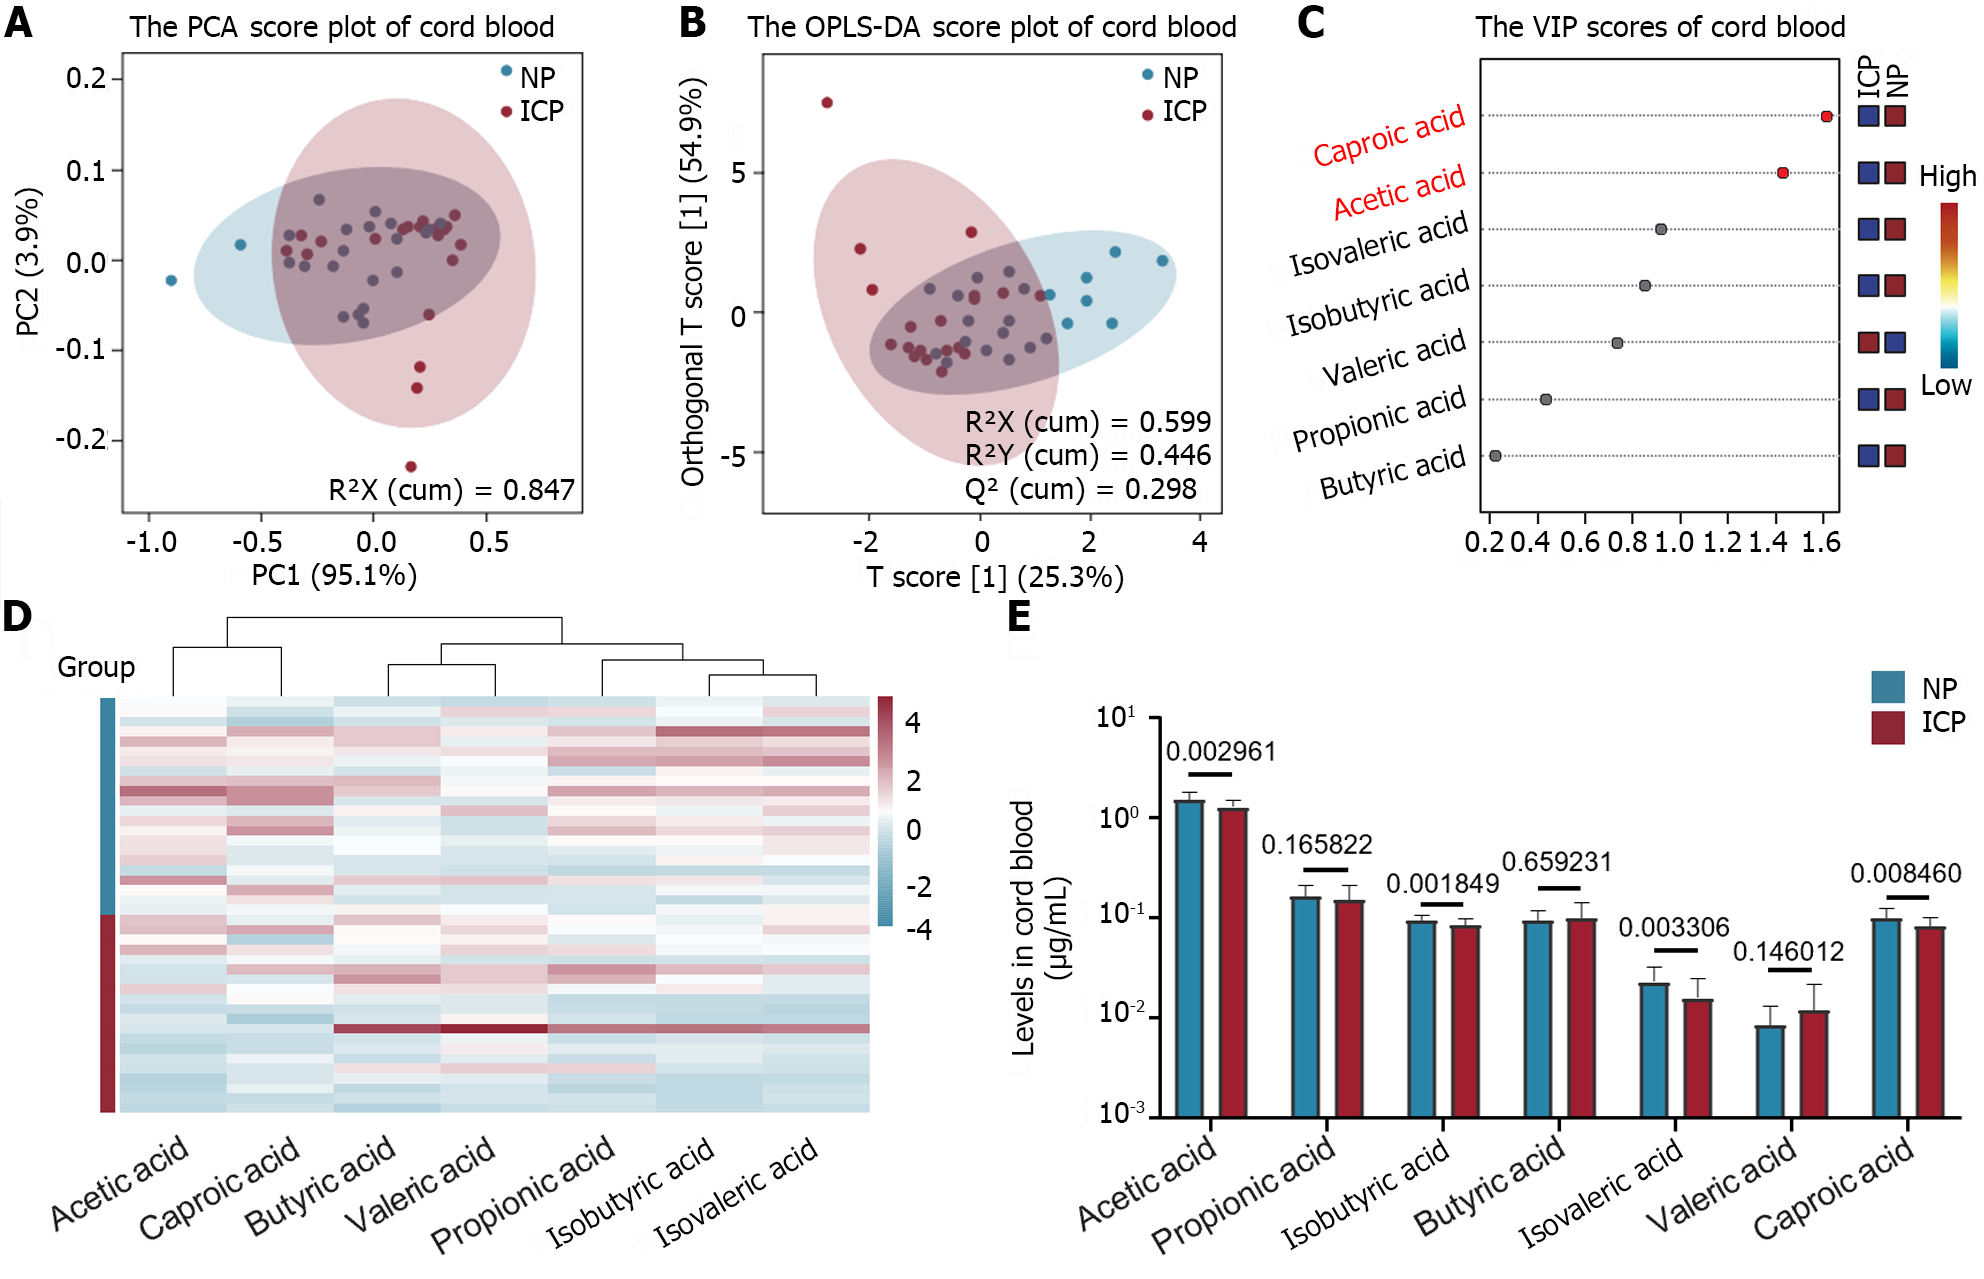
Figure 2 Characteristics of short-chain fatty acids metabolic spectrum changes in the cord blood of intrahepatic cholestasis of pregnancy patients.
A: Principal Component Analysis score chart: intrahepatic cholestasis of pregnancy (ICP) patients experience inadequate separation from the normal pregnant women; B: Orthogonal Projections to Latent Structures Discriminant Analysis score chart: A partial overlap was observed between patients with ICP and normal pregnant women; C: Variable importance for the projection diagram: Acetic acid and caproic acid were identified as important metabolites that induced differences in short-chain fatty acids (SCFAs) in the cord blood between the two groups; D: Heat map: Except for valeric acid, other SCFAs displayed a decreasing trend in the cord blood of ICP patients; E: Quantitative analysis bar chart: Acetic acid demonstrated the highest content in the cord blood. The isobutyric acid content was lower in ICP patients. NP: n = 22; ICP: n = 20. PCA: Principal Component Analysis; SCFAs: Short-chain fatty acids; OPLS-DA: Orthogonal Projections to Latent Structures Discriminant Analysis; VIP: Variable Importance for the Projection.
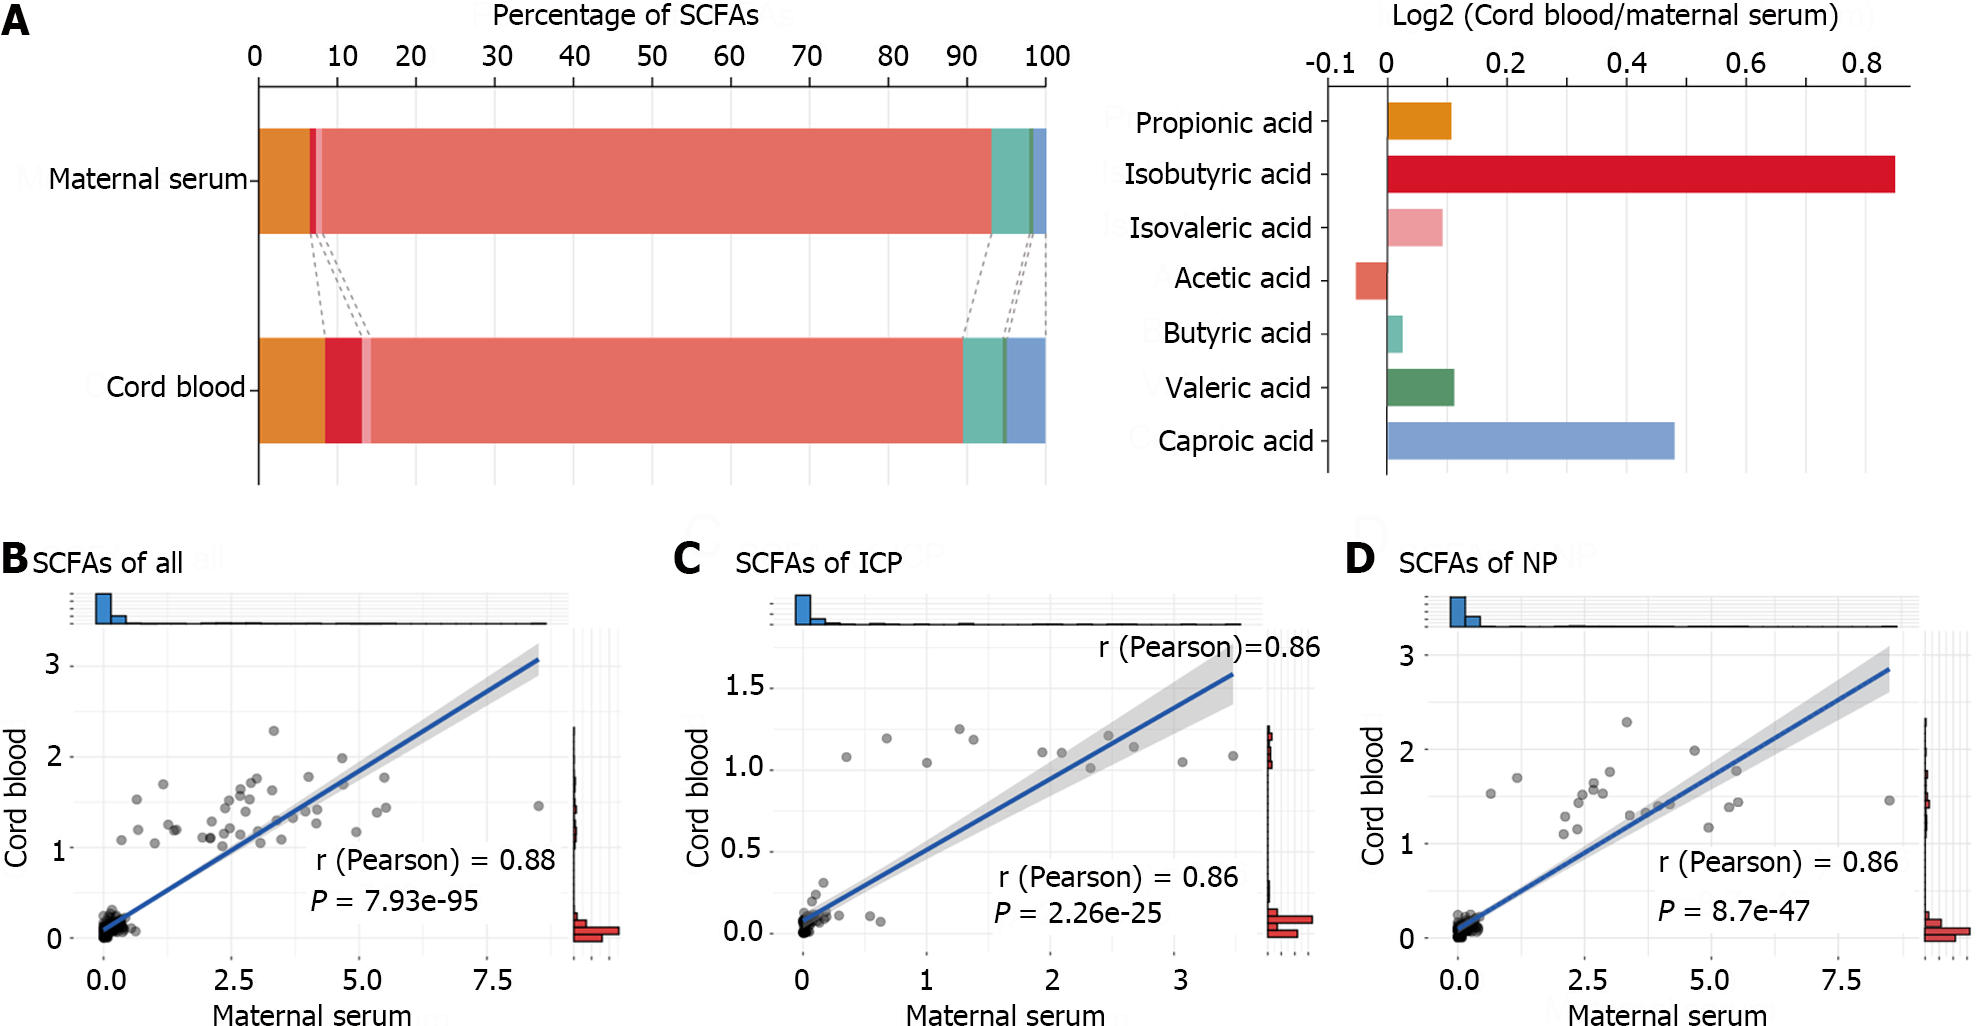
Figure 3 Cord blood short-chain fatty acids' correlation with short-chain fatty acids found in maternal serum.
A: Stacked bar chart of the percentage of short-chain fatty acids (SCFAs) in maternal serum and cord blood: The proportion of isobutyric acid and caproic acid in maternal serum’s total SCFAs was extremely low, while, in the cord blood SCFAs, it was significantly higher; B: Linear regression scatter plots of SCFAs in the two groups of subjects: A significant positive correlation existed between the total SCFAs in maternal serum and cord blood in both the subject groups; C: Linear regression scatter plot of SCFAs in intrahepatic cholestasis of pregnancy patients: There was a significant positive correlation between total SCFAs in the maternal serum and cord blood; D: Linear regression scatter plot of SCFAs in normal pregnant group: A strong positive correlation between the total SCFAs found in the maternal serum and cord blood. SCFAs: Short-chain fatty acids.
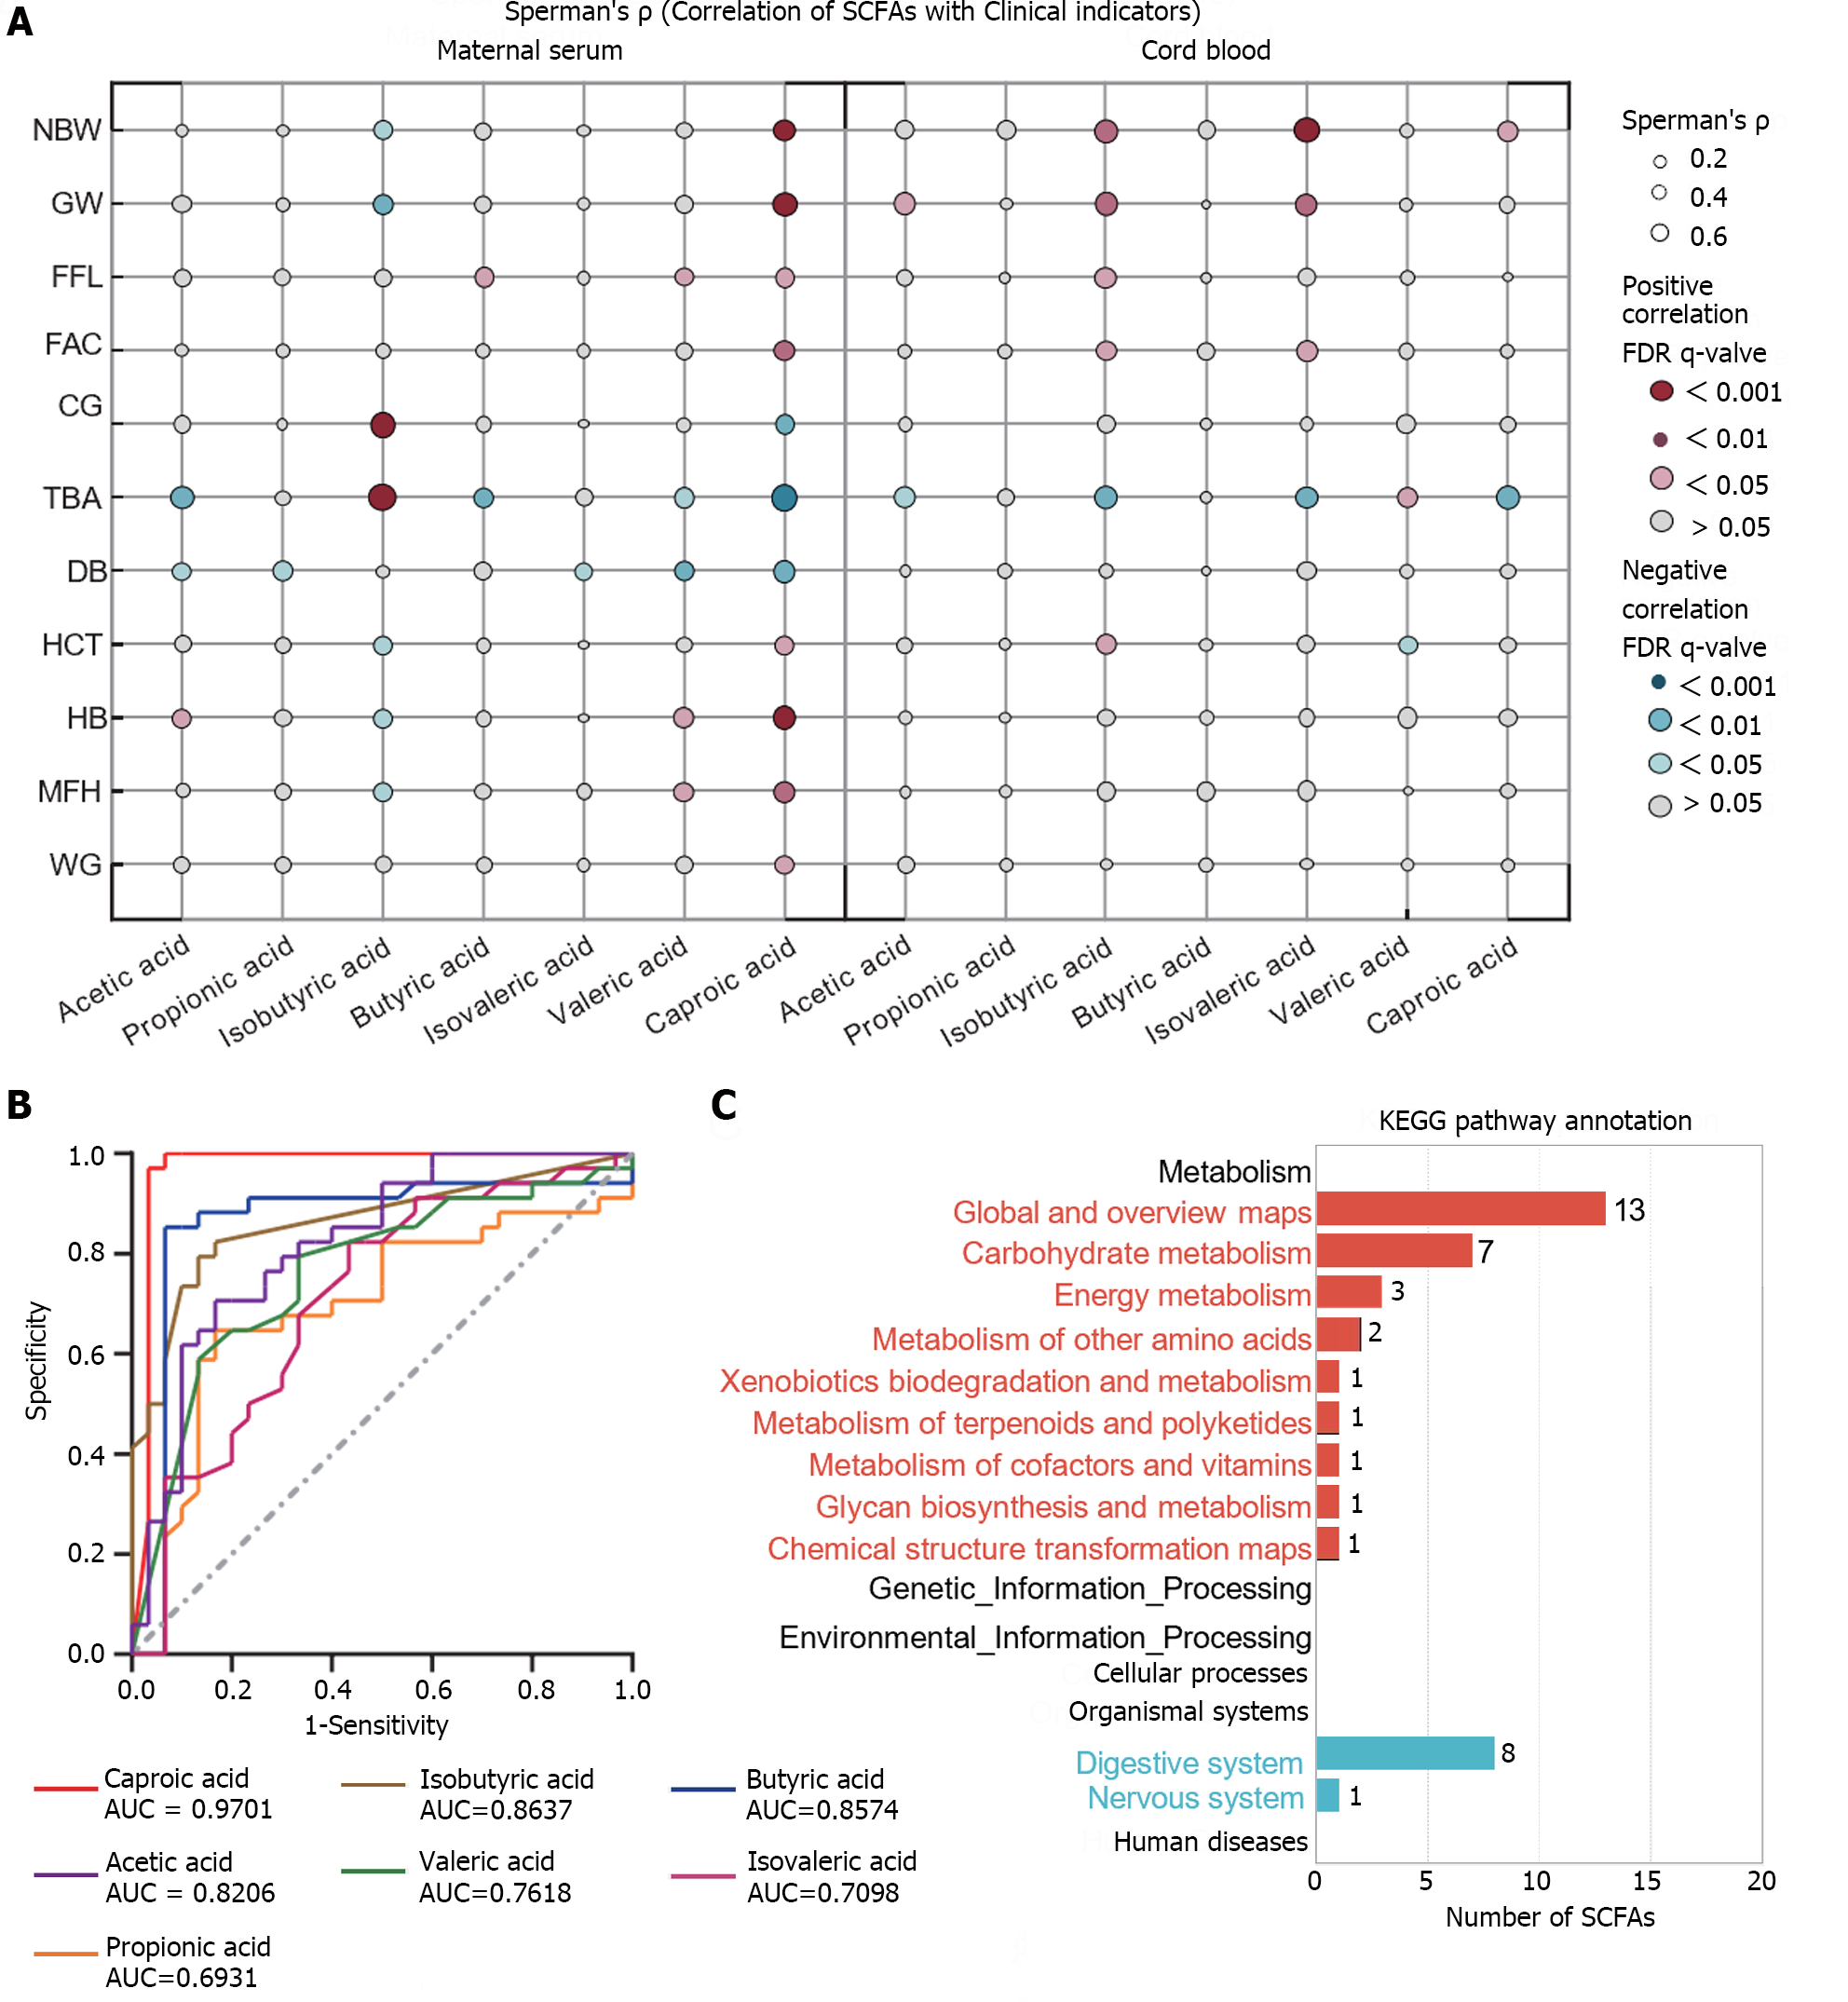
Figure 4 Clinical significance and functional analysis of differential short-chain fatty acids.
A: Bubble chart depicting the correlation between short-chain fatty acids (SCFAs) and clinical indicators: Whether in maternal serum or cord blood, the correlation between acetic acid and caproic acid as well as clinical indicators showed the same trend. The size of the bubble represents the correlation levels. The color of the bubble represents the FDR levels. Red: Positive correlation; Blue: Negative correlation; B: The receiver operating characteristic (ROC) curve of maternal serum SCFAs for individual diagnosis of intrahepatic cholestasis of pregnancy: the diagnostic accuracy of caproic acid was 97.01%; C: Summary of the secondary classification of Kyoto Encyclopedia of Genes and Genomes pathway enrichment results: mainly involving metabolic pathways and biological system pathways, including carbohydrate metabolism, capacity metabolism, digestive system, and nervous system. For maternal blood, NP: n = 30; ICP: n = 34. For cord blood, NP: n = 22; ICP n = 20. NBW: Neonatal birth weight; GW: Gestational week of delivery; FFL: Fetal femur length; FAC: Fetal abdominal circumference; CG: Cholyglycine; TBA: Total bile acid; DB: Direct bilirubin; HCT: Hematocrit; HB: Hemoglobin; MFH: Maternal fundal height; WG: Weight gain during pregnancy.
- Citation: Ren SJ, Feng JT, Xiang T, Liao CL, Zhou YP, Xuan RR. Expression and clinical significance of short-chain fatty acids in patients with intrahepatic cholestasis of pregnancy. World J Hepatol 2024; 16(4): 601-611
- URL: https://www.wjgnet.com/1948-5182/full/v16/i4/601.htm
- DOI: https://dx.doi.org/10.4254/wjh.v16.i4.601


