Copyright
©The Author(s) 2024.
World J Hepatol. Dec 27, 2024; 16(12): 1493-1504
Published online Dec 27, 2024. doi: 10.4254/wjh.v16.i12.1493
Published online Dec 27, 2024. doi: 10.4254/wjh.v16.i12.1493
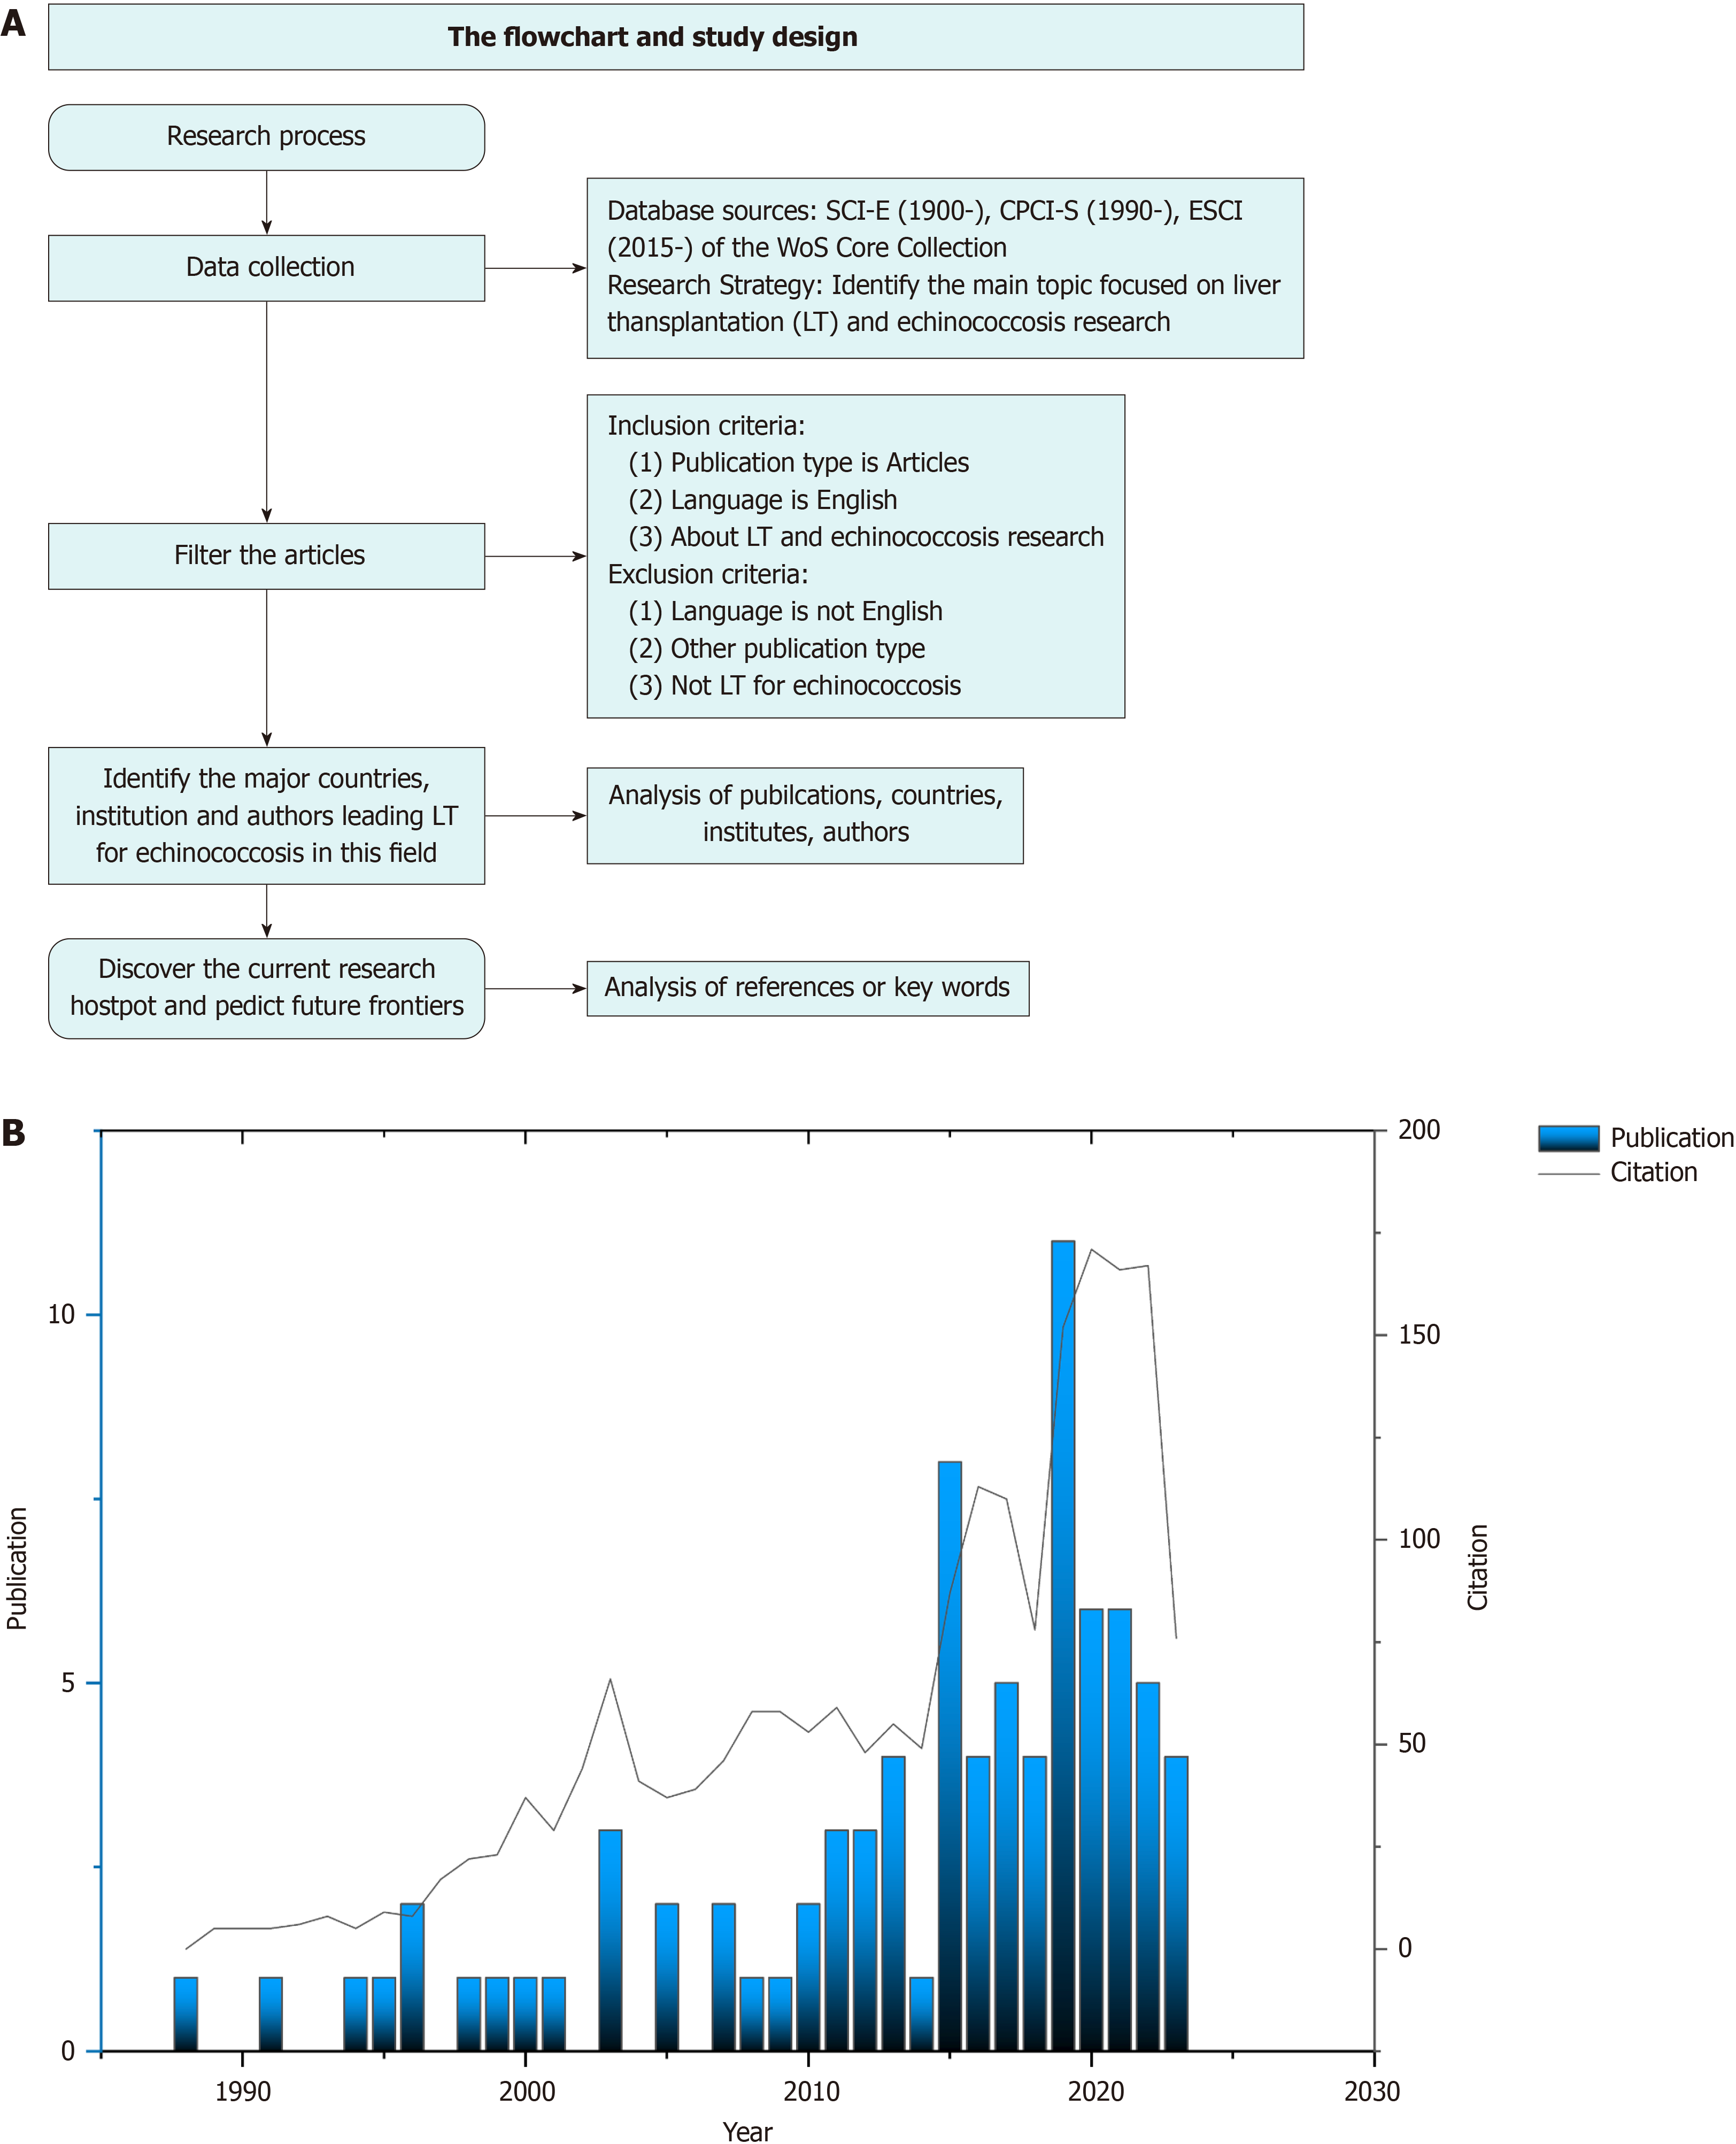
Figure 1 Flowchart of data collection and analysis, publications and annual trends of citations.
A: Flowchart of bibliometric analysis; B: Number of articles about liver transplantation for echinococcosis per year from 1986 to 2023. LT: Liver transplantation; WoS: Web of Science.
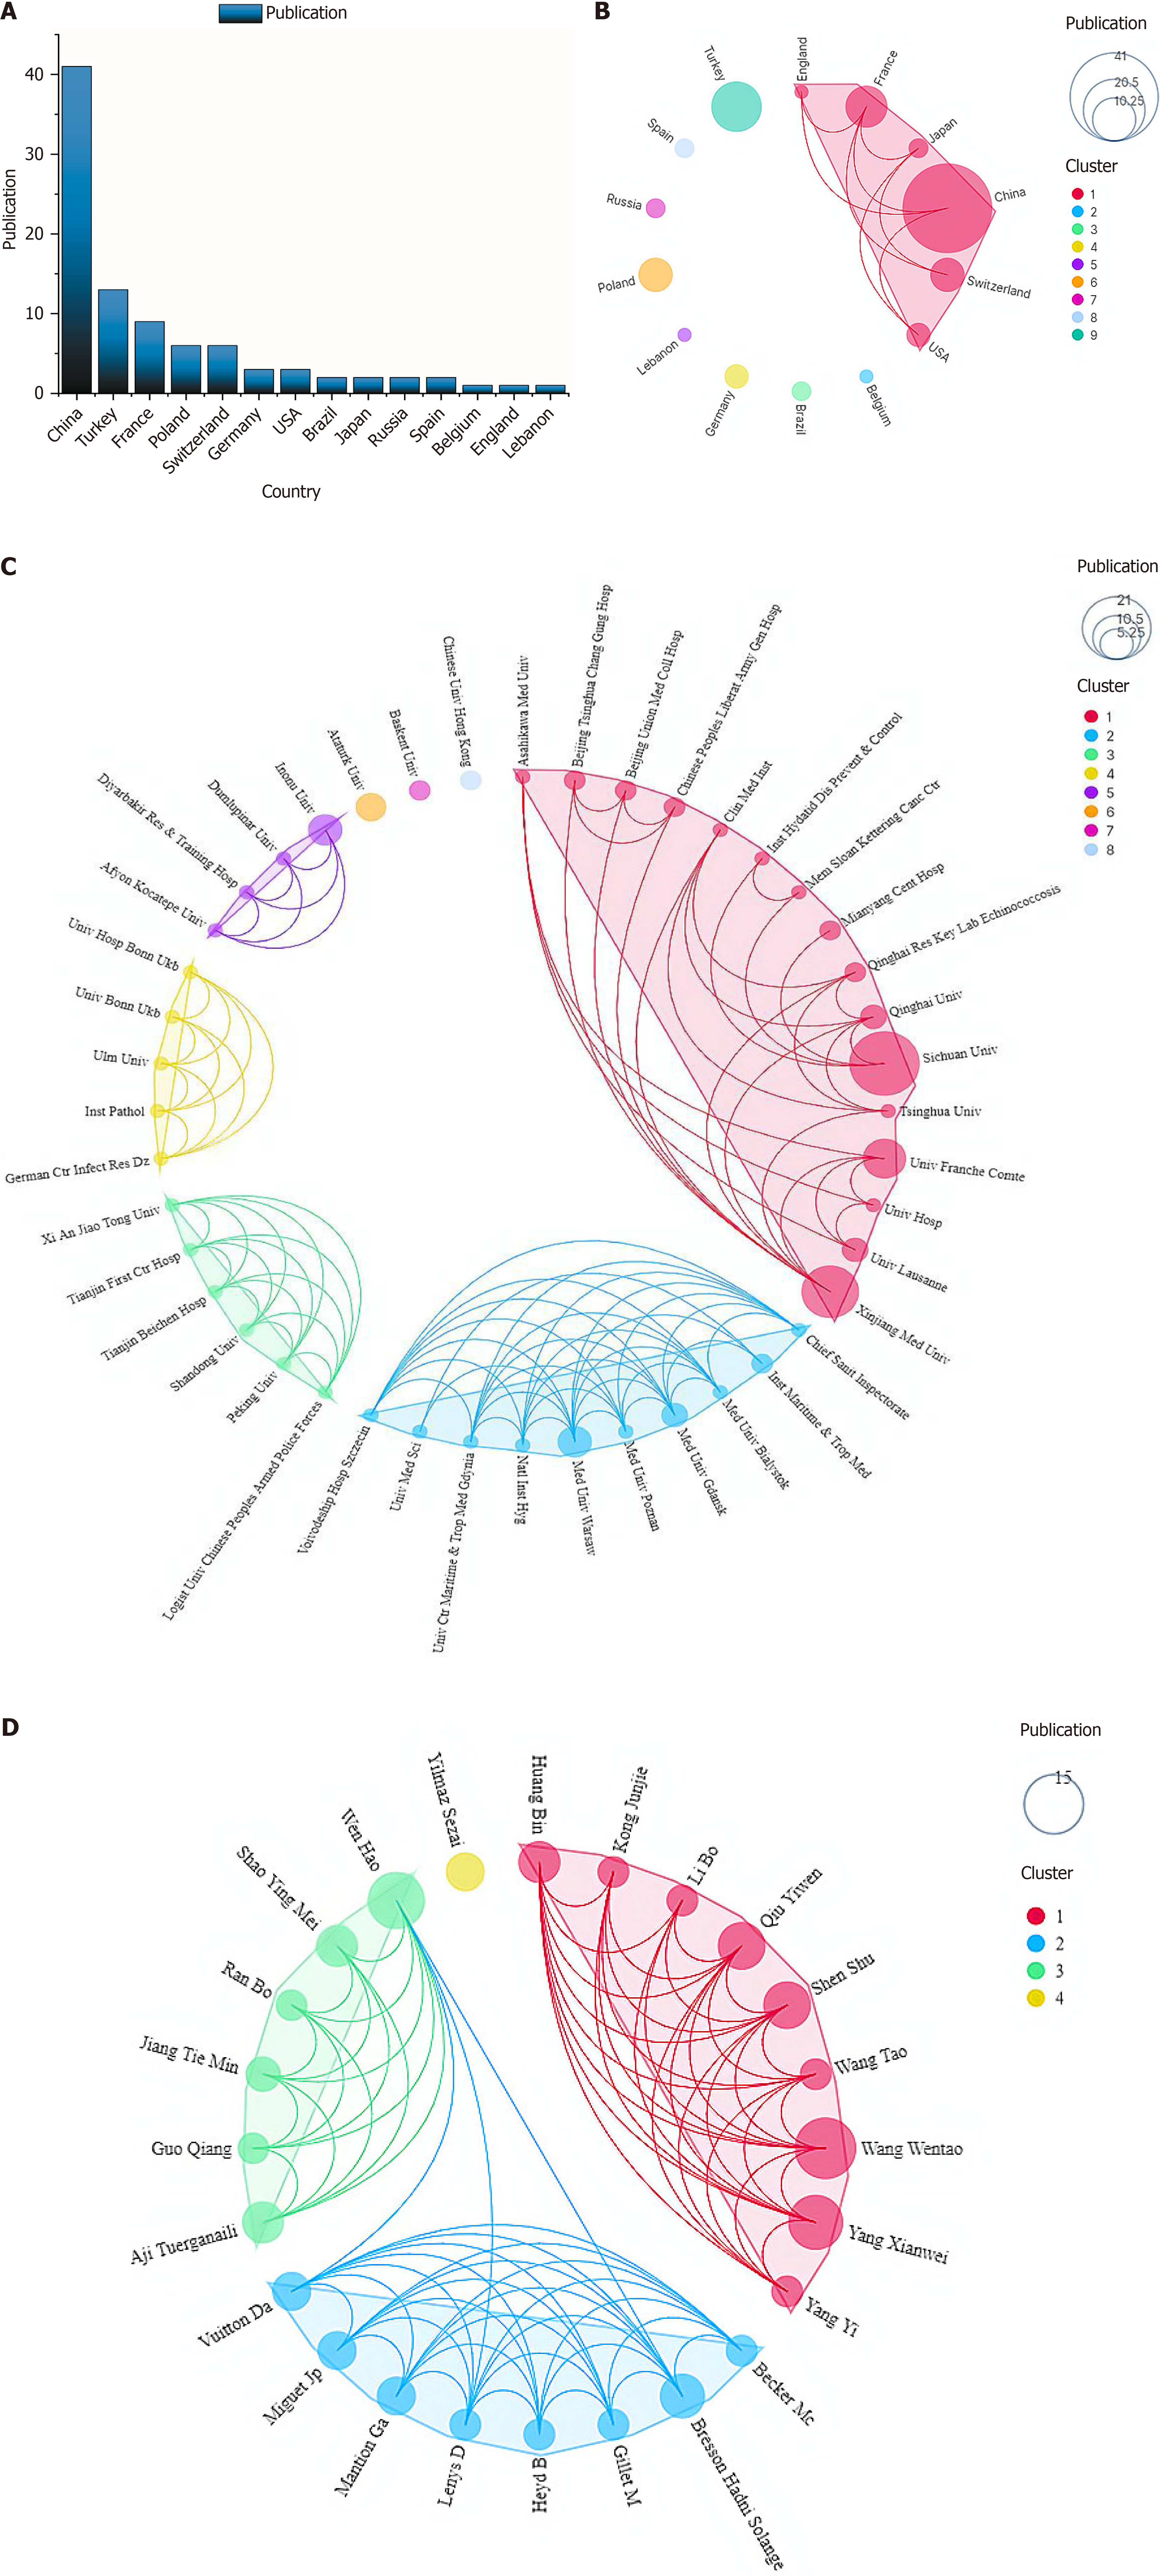
Figure 2 Analysis of cooperation status.
A: Major productive countries/regions; B: The network maps showing countries/regions; C: Institutions; D: Authors involved in the research on liver transplantation for echinococcosis.
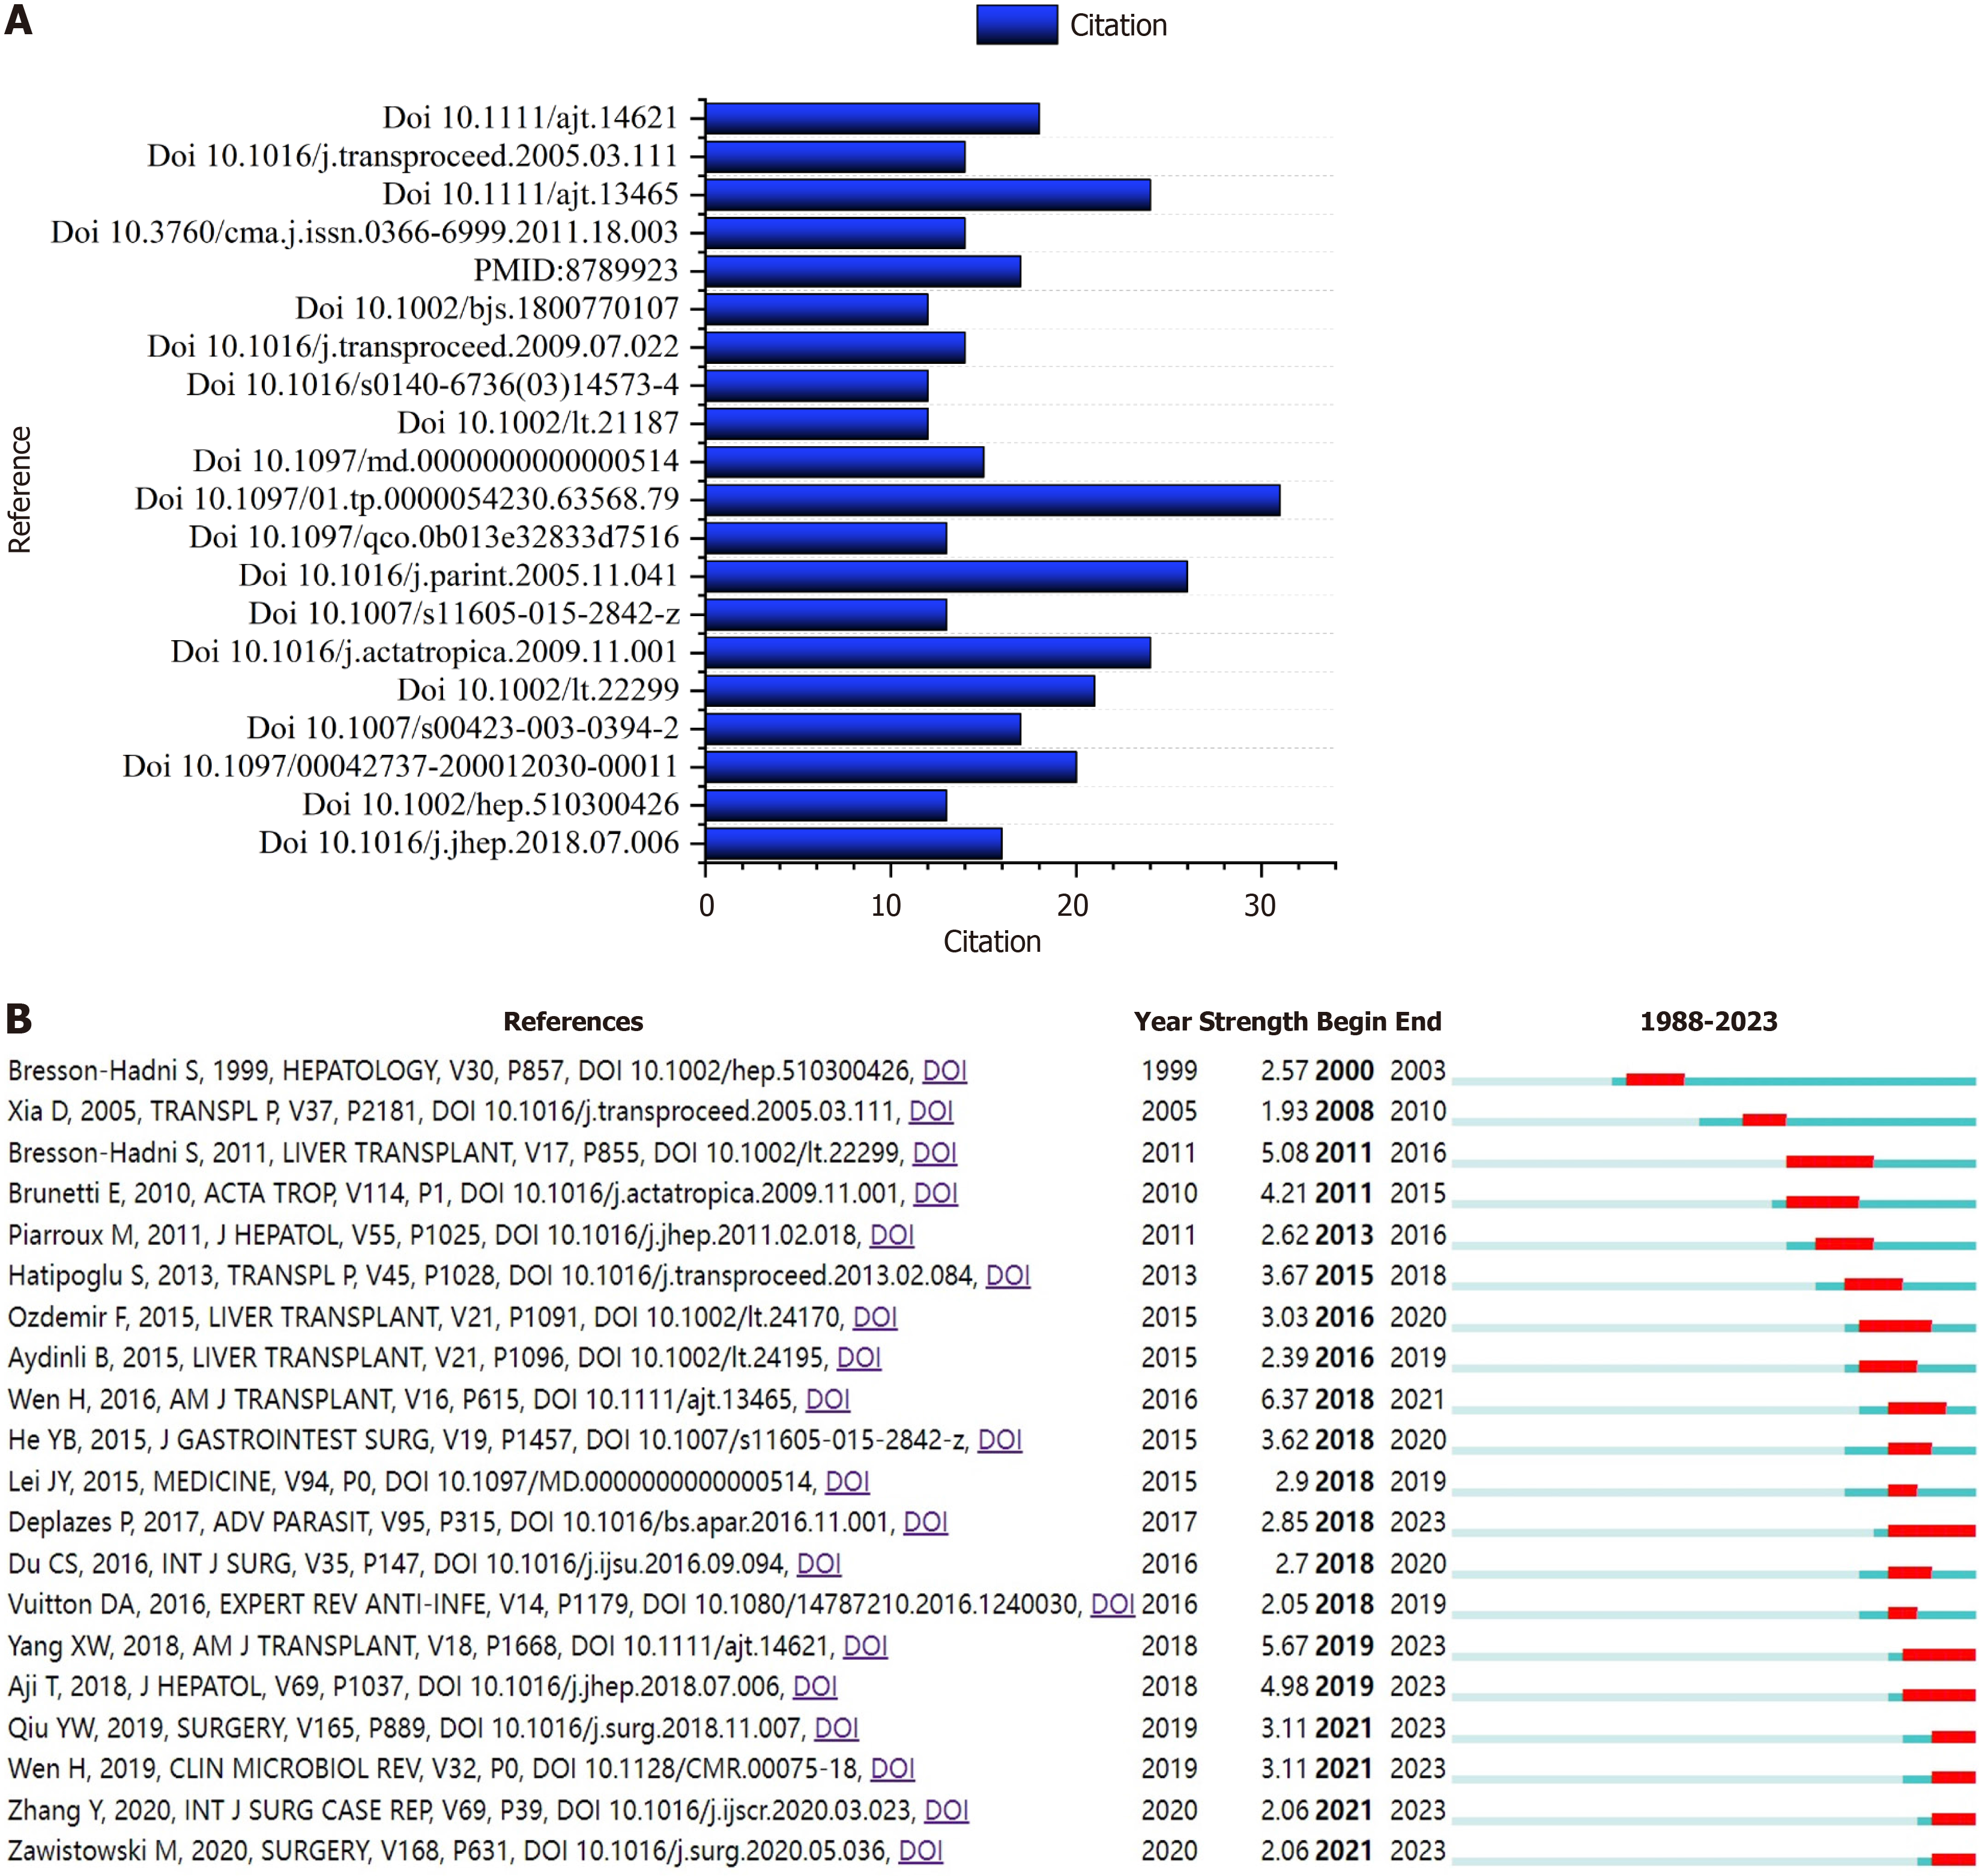
Figure 3 Analysis of co-cited references.
A: Bar diagram of co-cited reference; B: Visual analysis of references bursts.
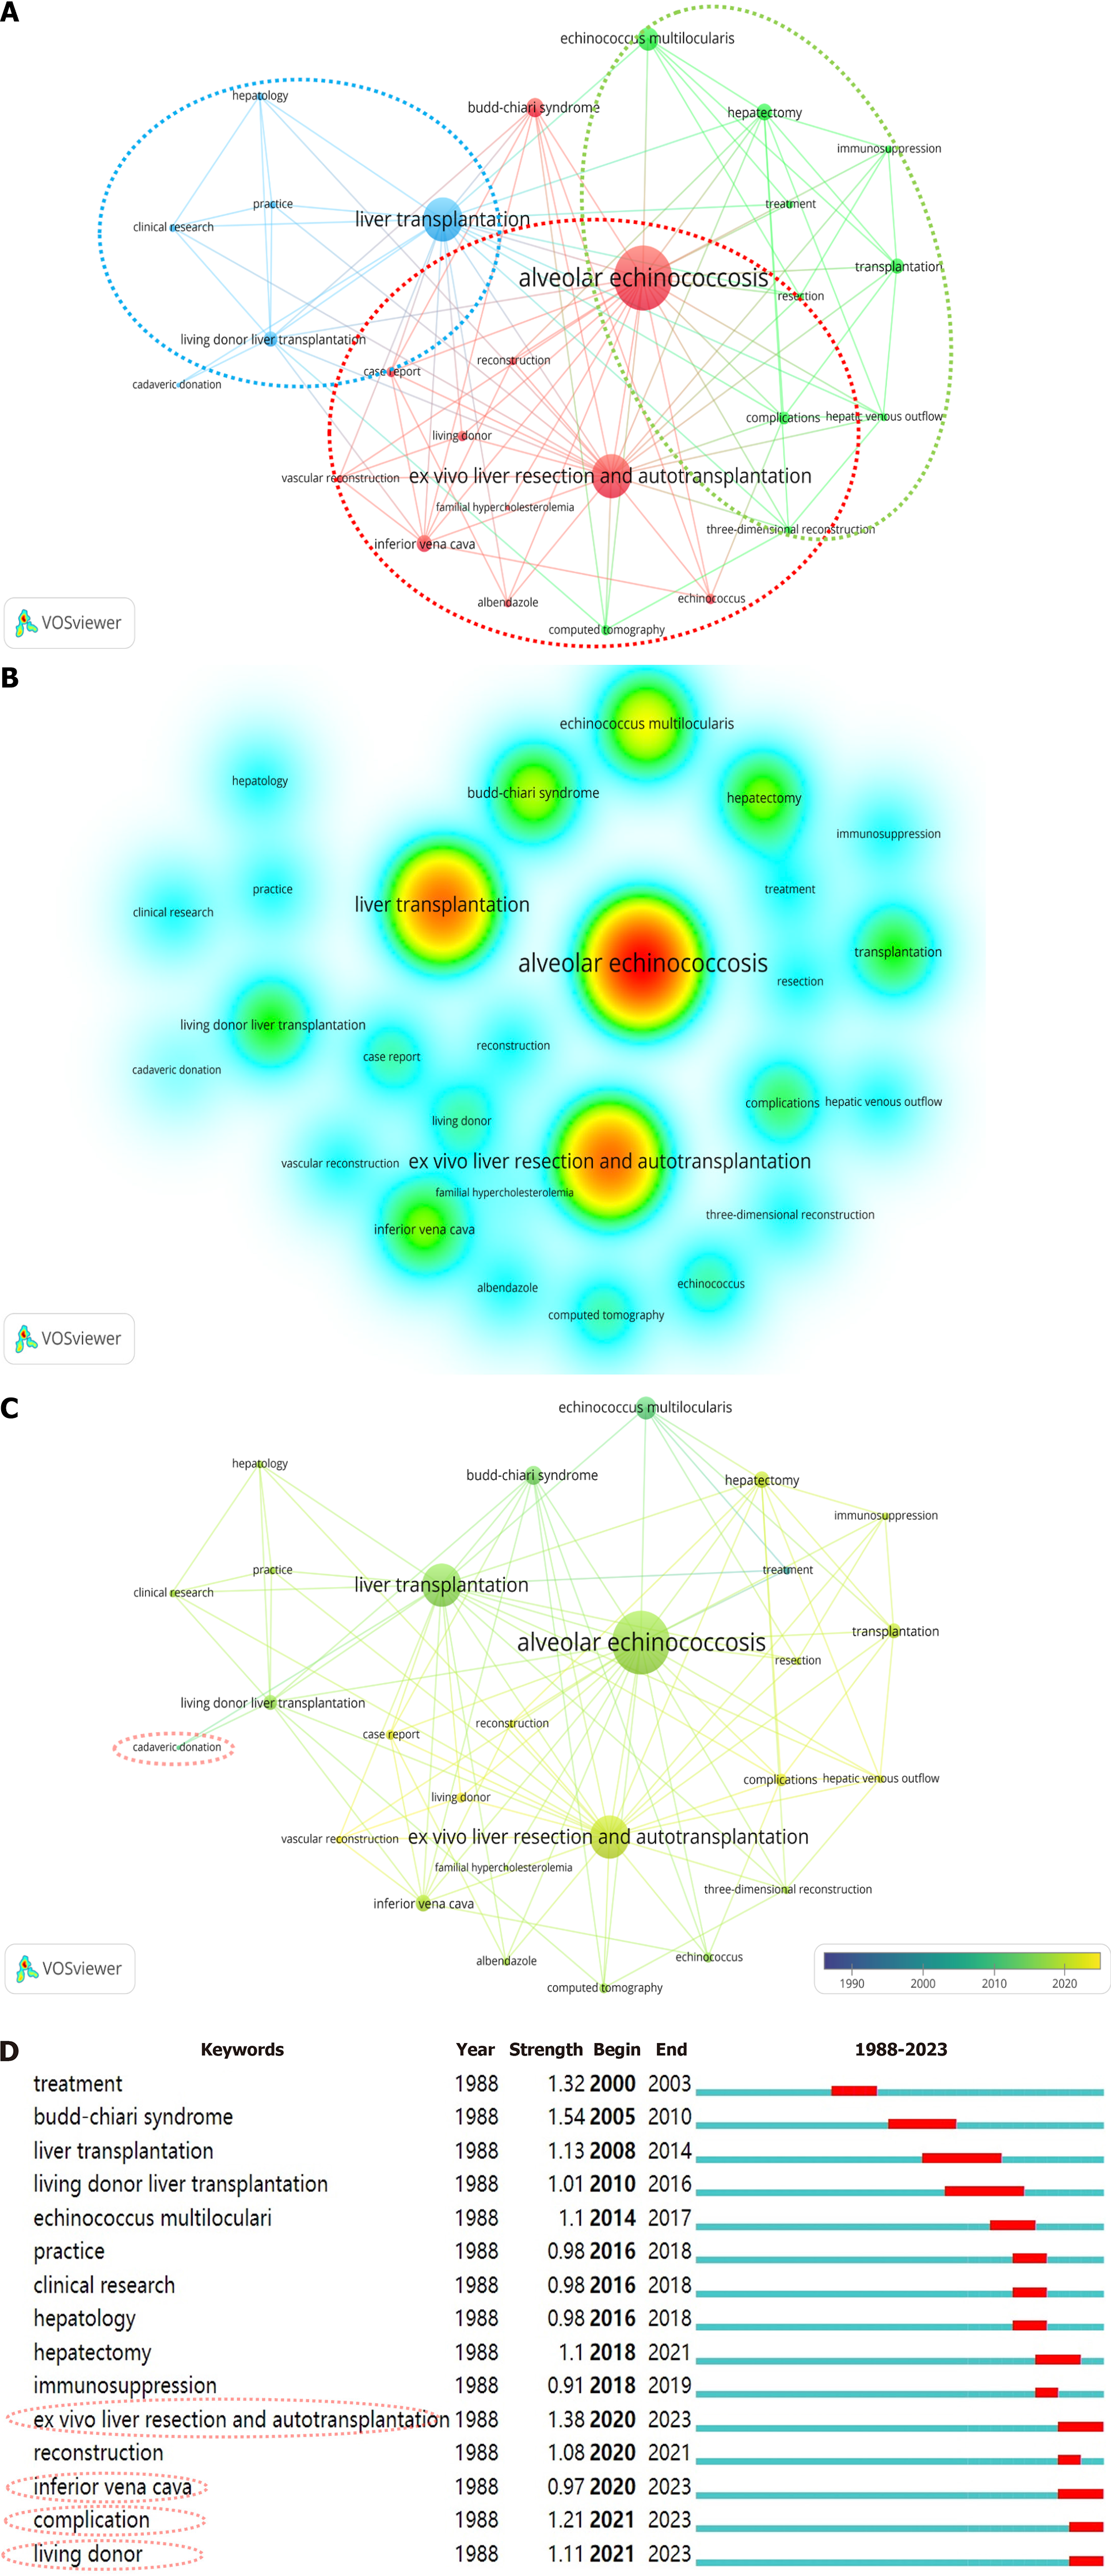
Figure 4 Analysis of keywords.
A: Main keywords network visualization; B: Density visualization map of keyword distribution; C: Time visualization map of keyword distribution; D: Visual analysis of keyword bursts.
- Citation: Mamuti A, Tulading A, Zhang YF, Azhati Y, Tuersunmaimaiti A, Maimaiti M, Lv CH, Wu J, Yao G, Aierken A, Tuxun T. Insight into the history and trends of liver transplantation for echinococcosis: A bibliometric analysis. World J Hepatol 2024; 16(12): 1493-1504
- URL: https://www.wjgnet.com/1948-5182/full/v16/i12/1493.htm
- DOI: https://dx.doi.org/10.4254/wjh.v16.i12.1493


