Copyright
©The Author(s) 2024.
World J Hepatol. Dec 27, 2024; 16(12): 1468-1479
Published online Dec 27, 2024. doi: 10.4254/wjh.v16.i12.1468
Published online Dec 27, 2024. doi: 10.4254/wjh.v16.i12.1468
Figure 1 Study design.
Animals received a standard or high-fat and choline-deficient diet, together with water (ad libitum) during the 16 weeks of the experiment. All animals were euthanized at the end. HFCD: High-fat and choline-deficient.
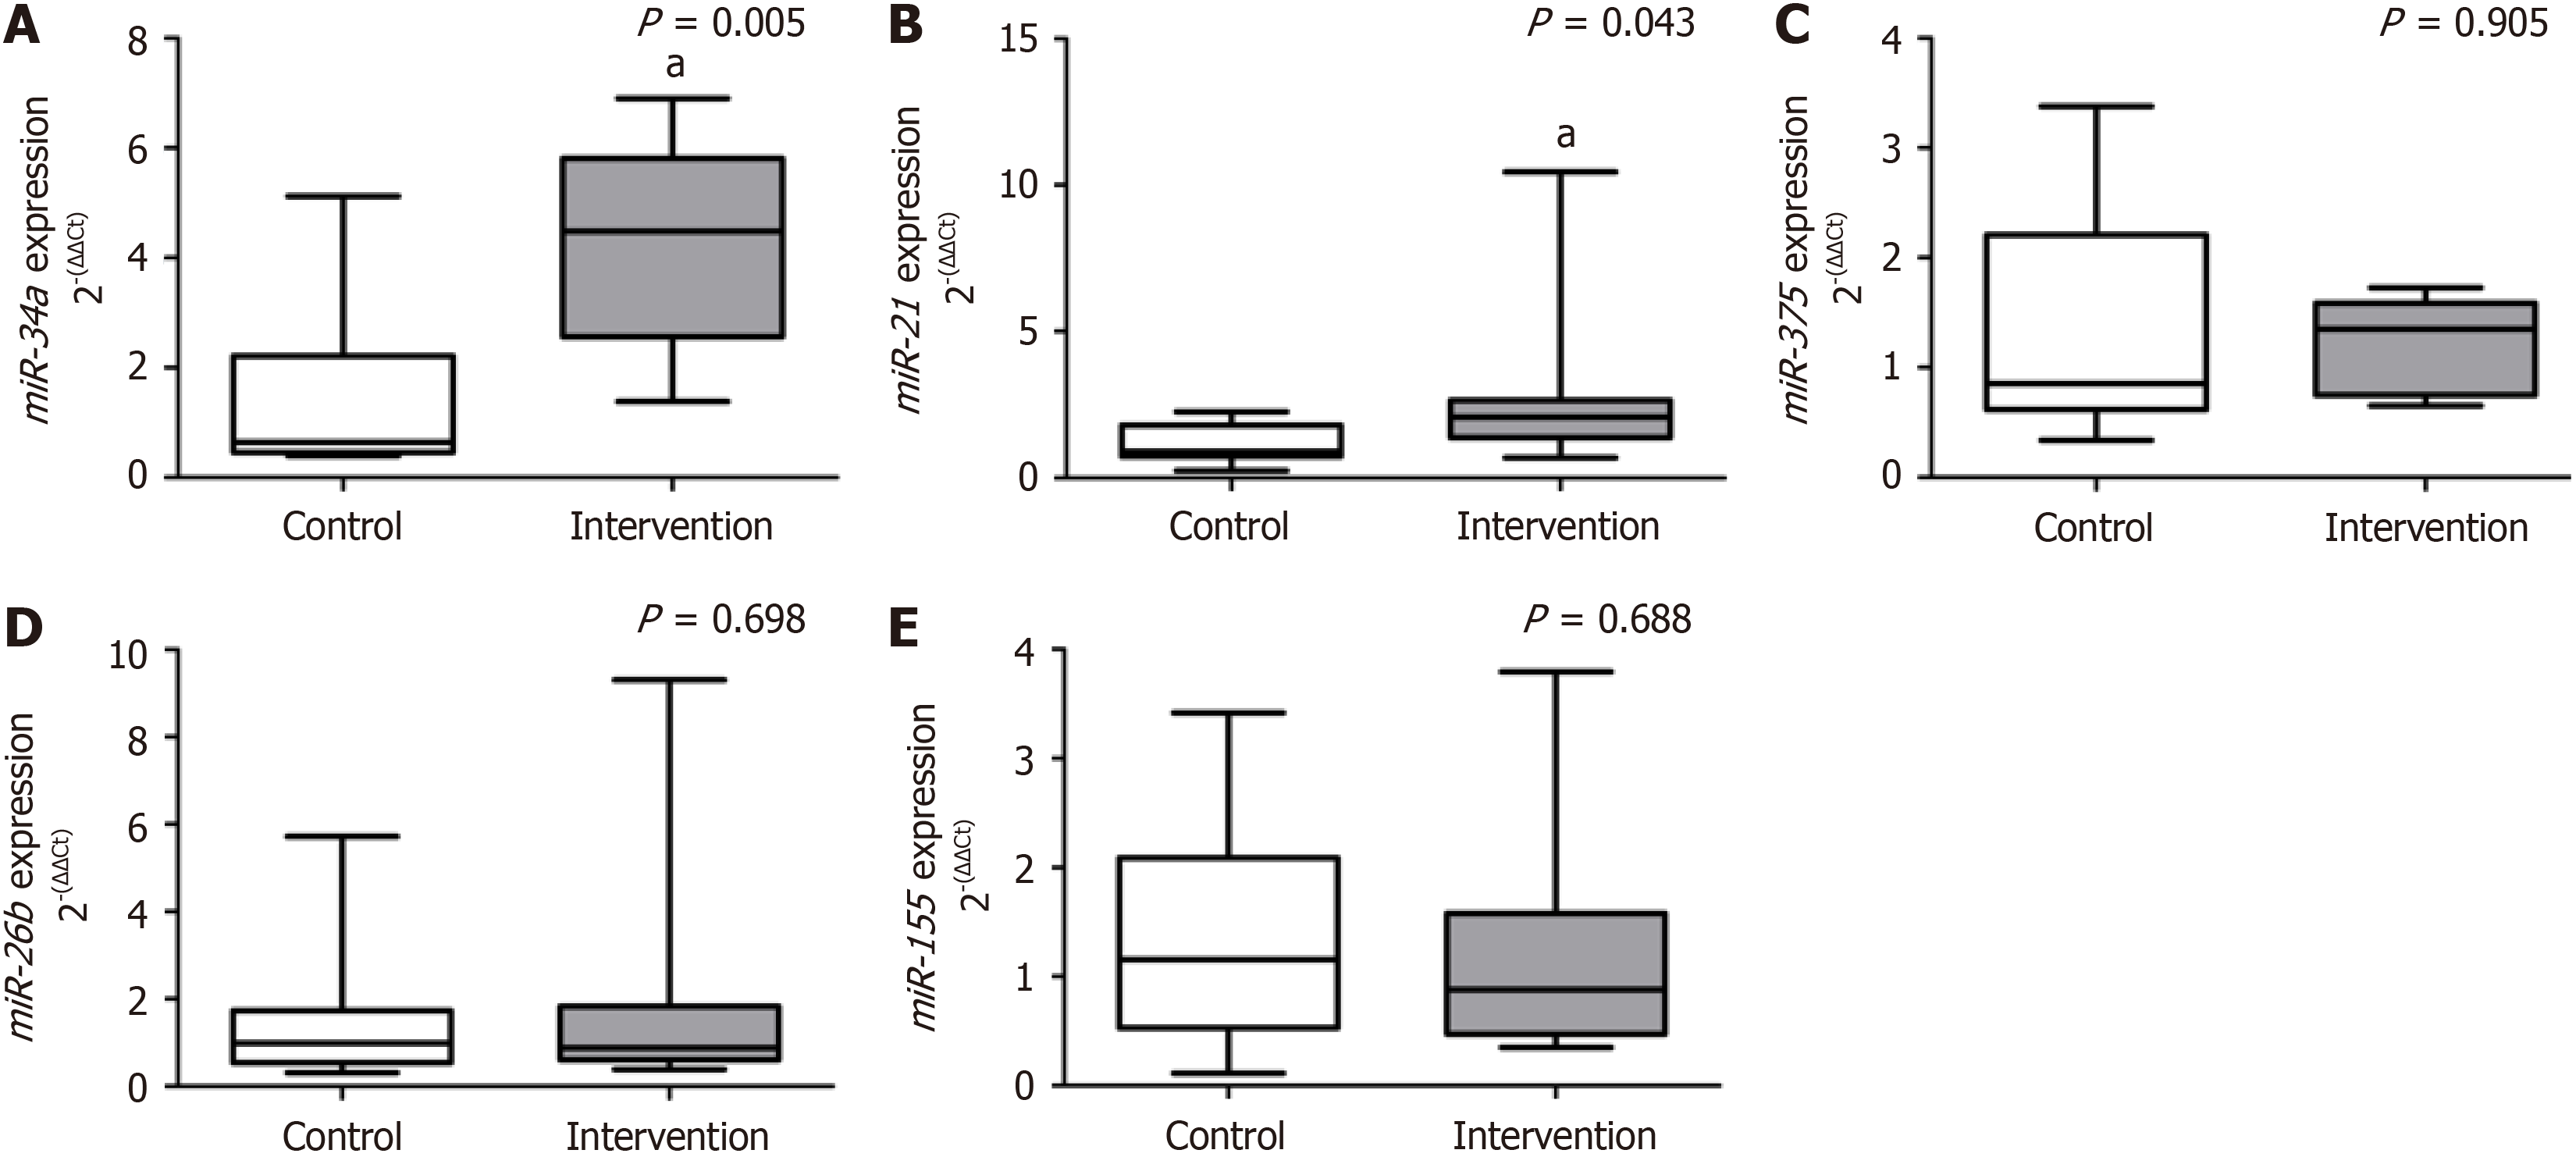
Figure 2 Gene expression of circulating microRNAs.
A: Micro (mi)R-34a; B: MiR-21; C: MiR-375; D: MiR-26b; E: MiR-155 (P = 0.688). Mann-Whitney U test, aP < 0.05 considered significant. Variables are described as median (25th-75th percentiles).
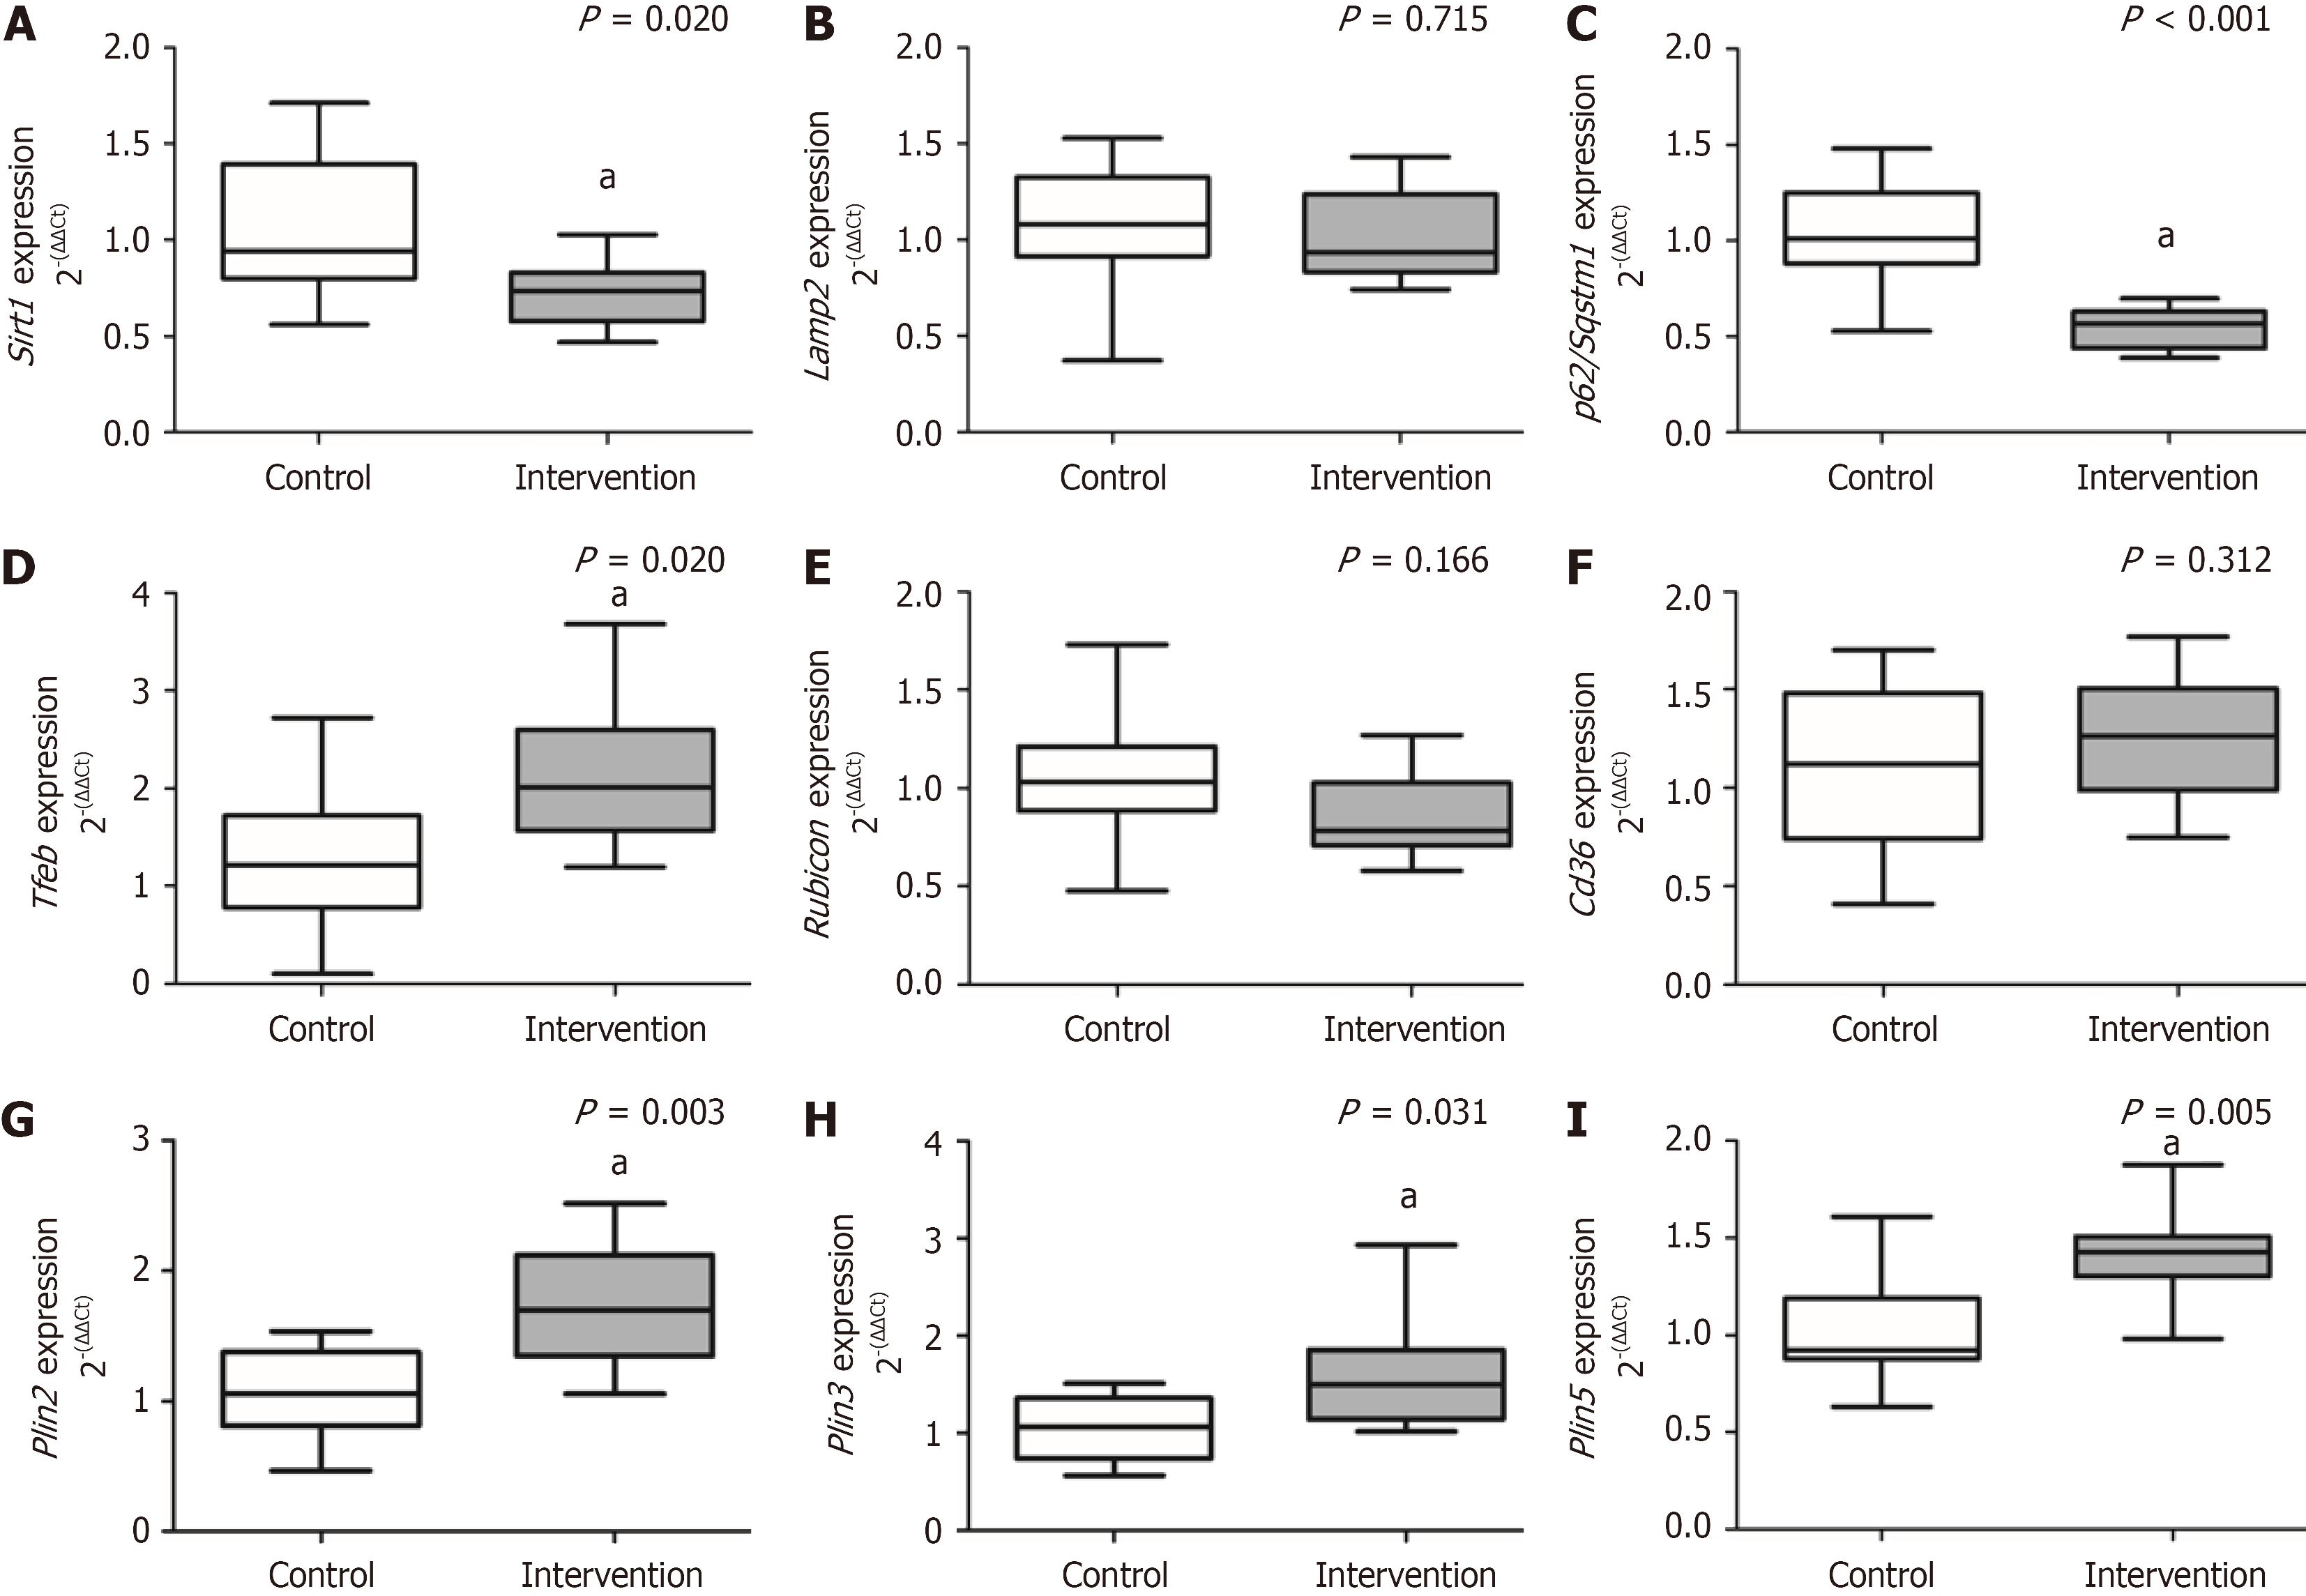
Figure 3 Hepatic gene expression of lipophagy markers.
A: Sirtuin-1; B: Lysosome-associated membrane protein-2; C: P62/sequestosome-1; D: Transcription factor EB; E: Rubicon; F: Cd36; G: Perilipin 2 (Plin2); H: Plin3; I: Plin5. aP < 0.05 considered significant, Mann-Whitney U test. Variables are described as median (25th-75th percentiles). Lamp2: Lysosome-associated membrane protein-2; Plin: Perilipin; p62/Sqstm1: P62/sequestosome-1; Sirt1: Sirtuin-1; Tfeb: Transcription factor EB.
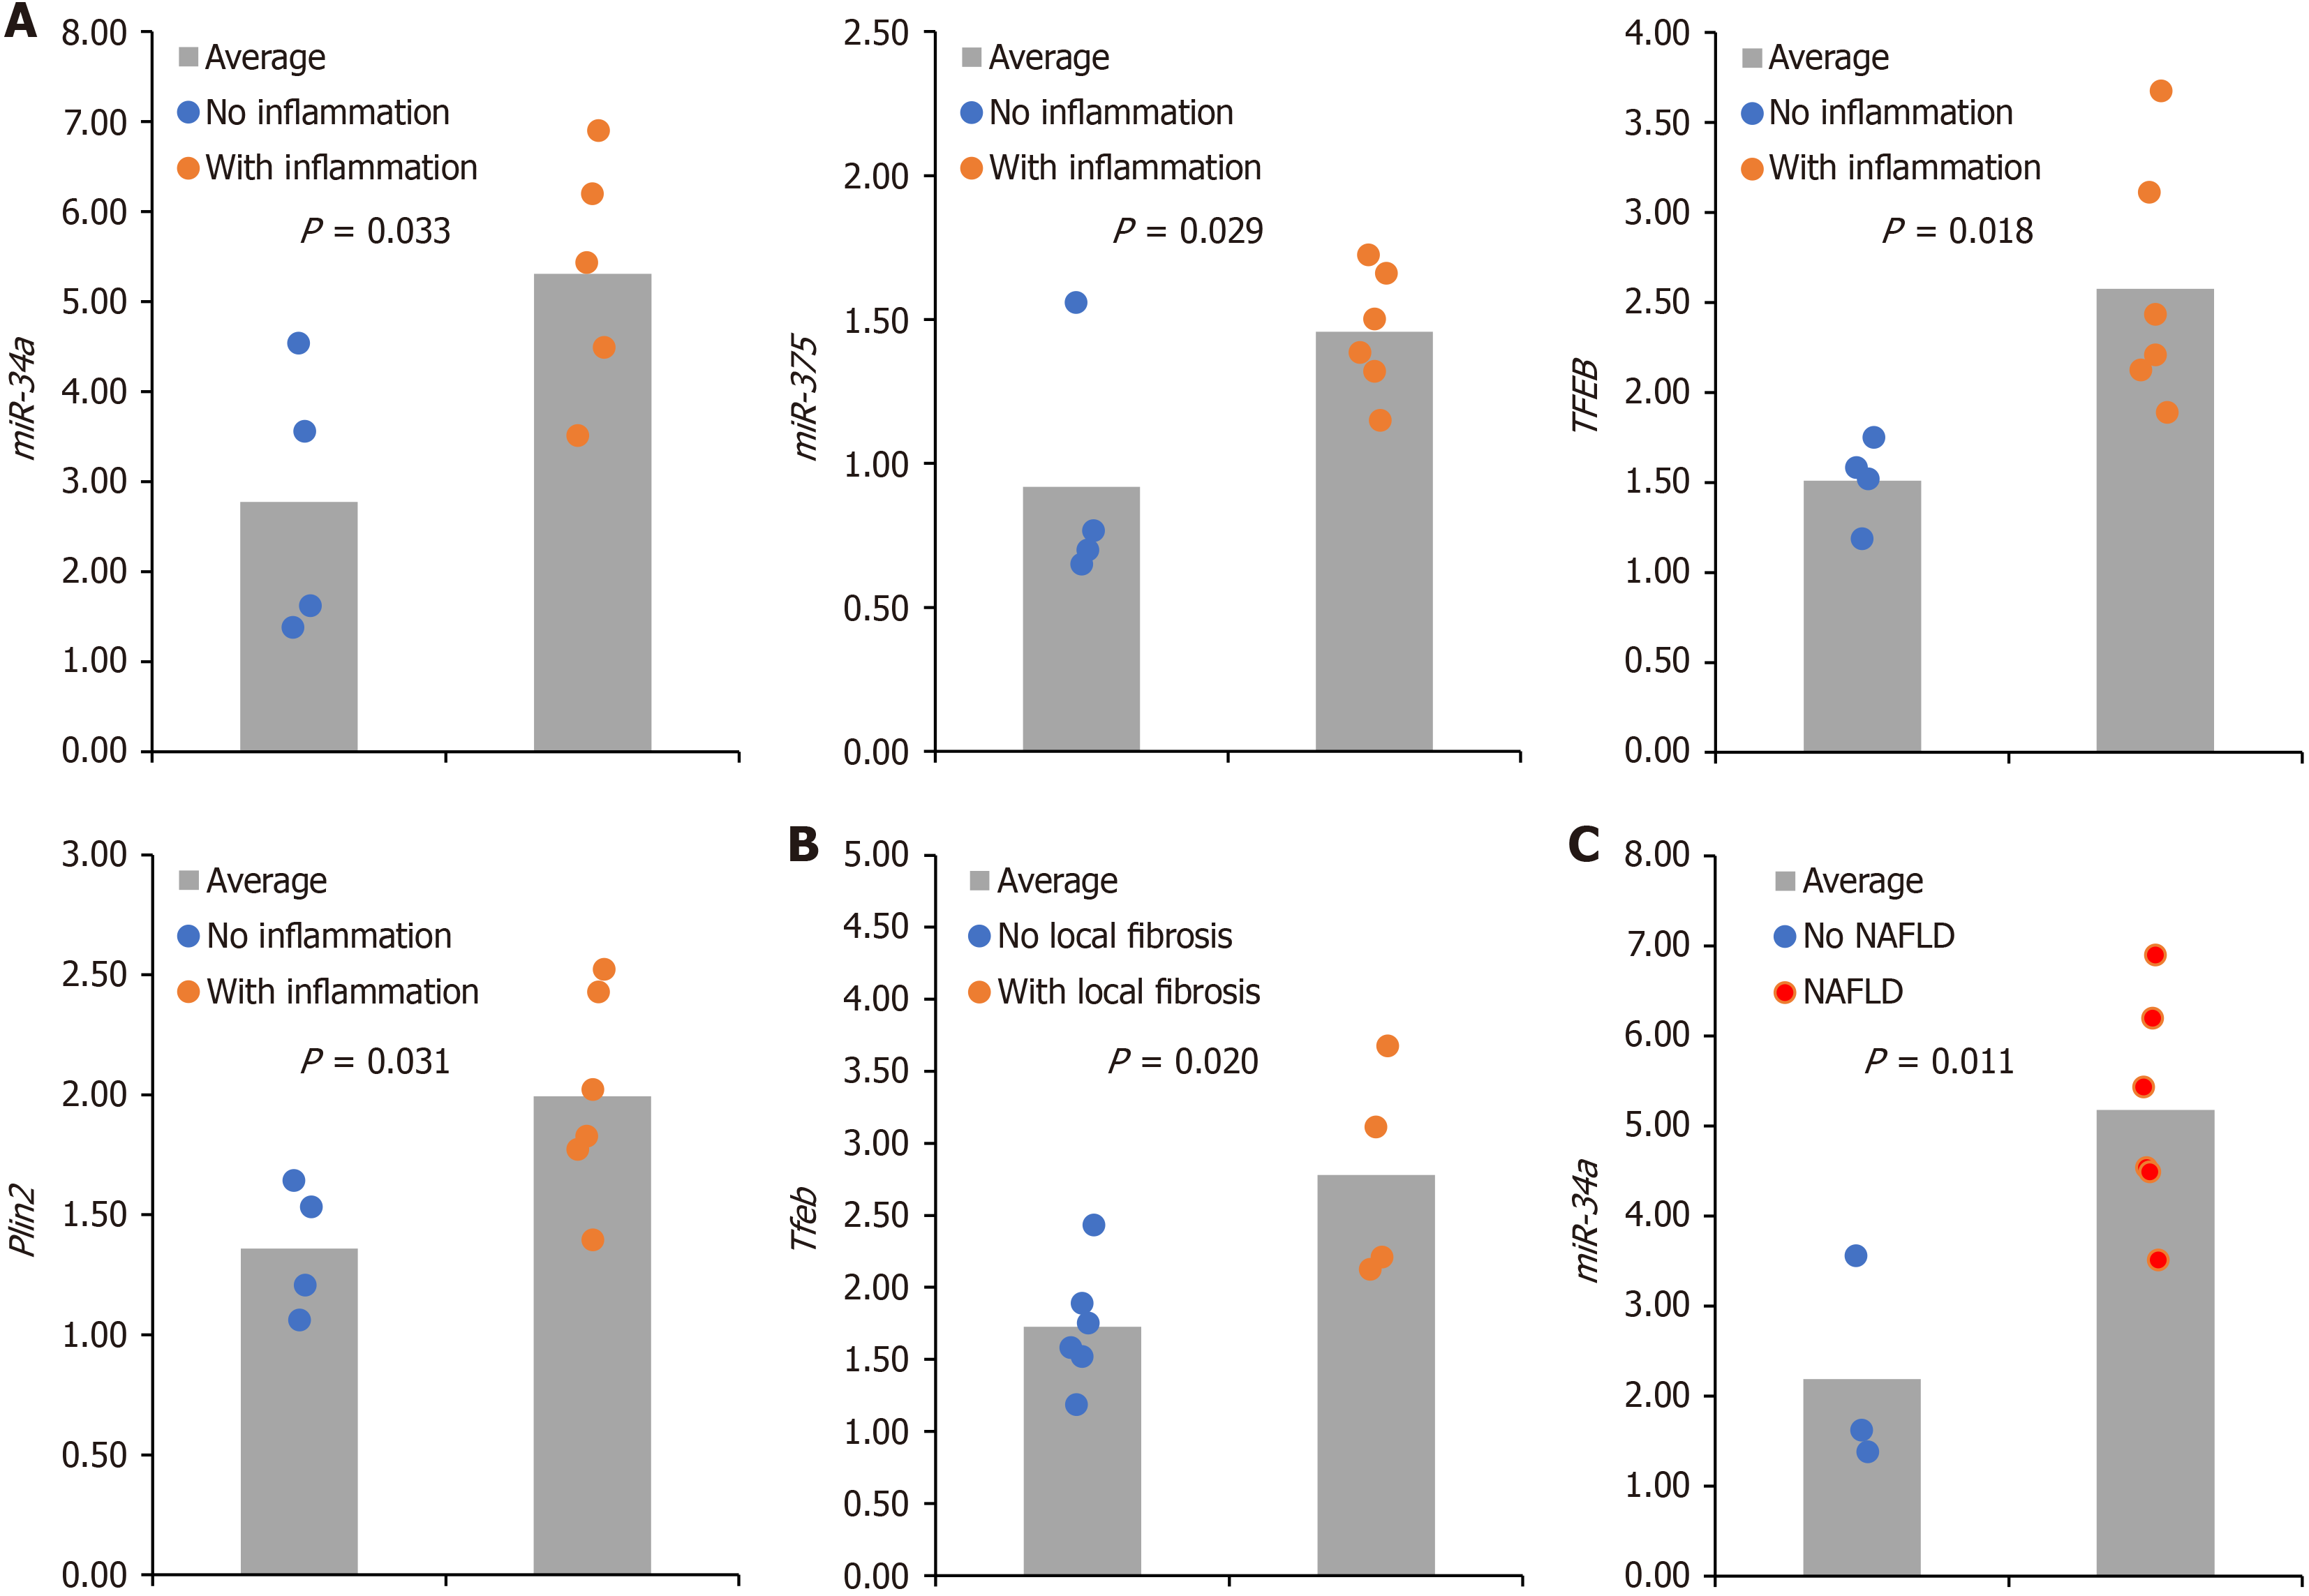
Figure 4 Inflammation, fibrosis, and metabolic dysfunction-associated fatty liver disease status.
A: Results after dividing the intervention group in two halves according to their inflammation status; B: Results after dividing the intervention group in two halves according to their fibrosis status; C: Results after dividing the intervention group in two halves according to their metabolic dysfunction-associated fatty liver disease status. Plin: Perilipin; Tfeb: Transcription factor EB; NAFLD: Non-alcoholic fatty liver disease.
Figure 5 Correlations between circulating microRNAs and gene expression.
A: Correlation between Sirtuin-1 (Sirt1) and p62/sequestosome-1; B: Correlation between Sirt1 and rubicon; C: Correlation between micro (mi)R26b and miR-21. P62/Sqstm1: Sequestosome-1; Sirt1: Sirtuin-1.
- Citation: Schütz F, Longo L, Keingeski MB, Filippi-Chiela E, Uribe-Cruz C, Álvares-da-Silva MR. Lipophagy and epigenetic alterations are related to metabolic dysfunction-associated steatotic liver disease progression in an experimental model. World J Hepatol 2024; 16(12): 1468-1479
- URL: https://www.wjgnet.com/1948-5182/full/v16/i12/1468.htm
- DOI: https://dx.doi.org/10.4254/wjh.v16.i12.1468


