Copyright
©The Author(s) 2023.
World J Hepatol. Sep 27, 2023; 15(9): 1043-1059
Published online Sep 27, 2023. doi: 10.4254/wjh.v15.i9.1043
Published online Sep 27, 2023. doi: 10.4254/wjh.v15.i9.1043
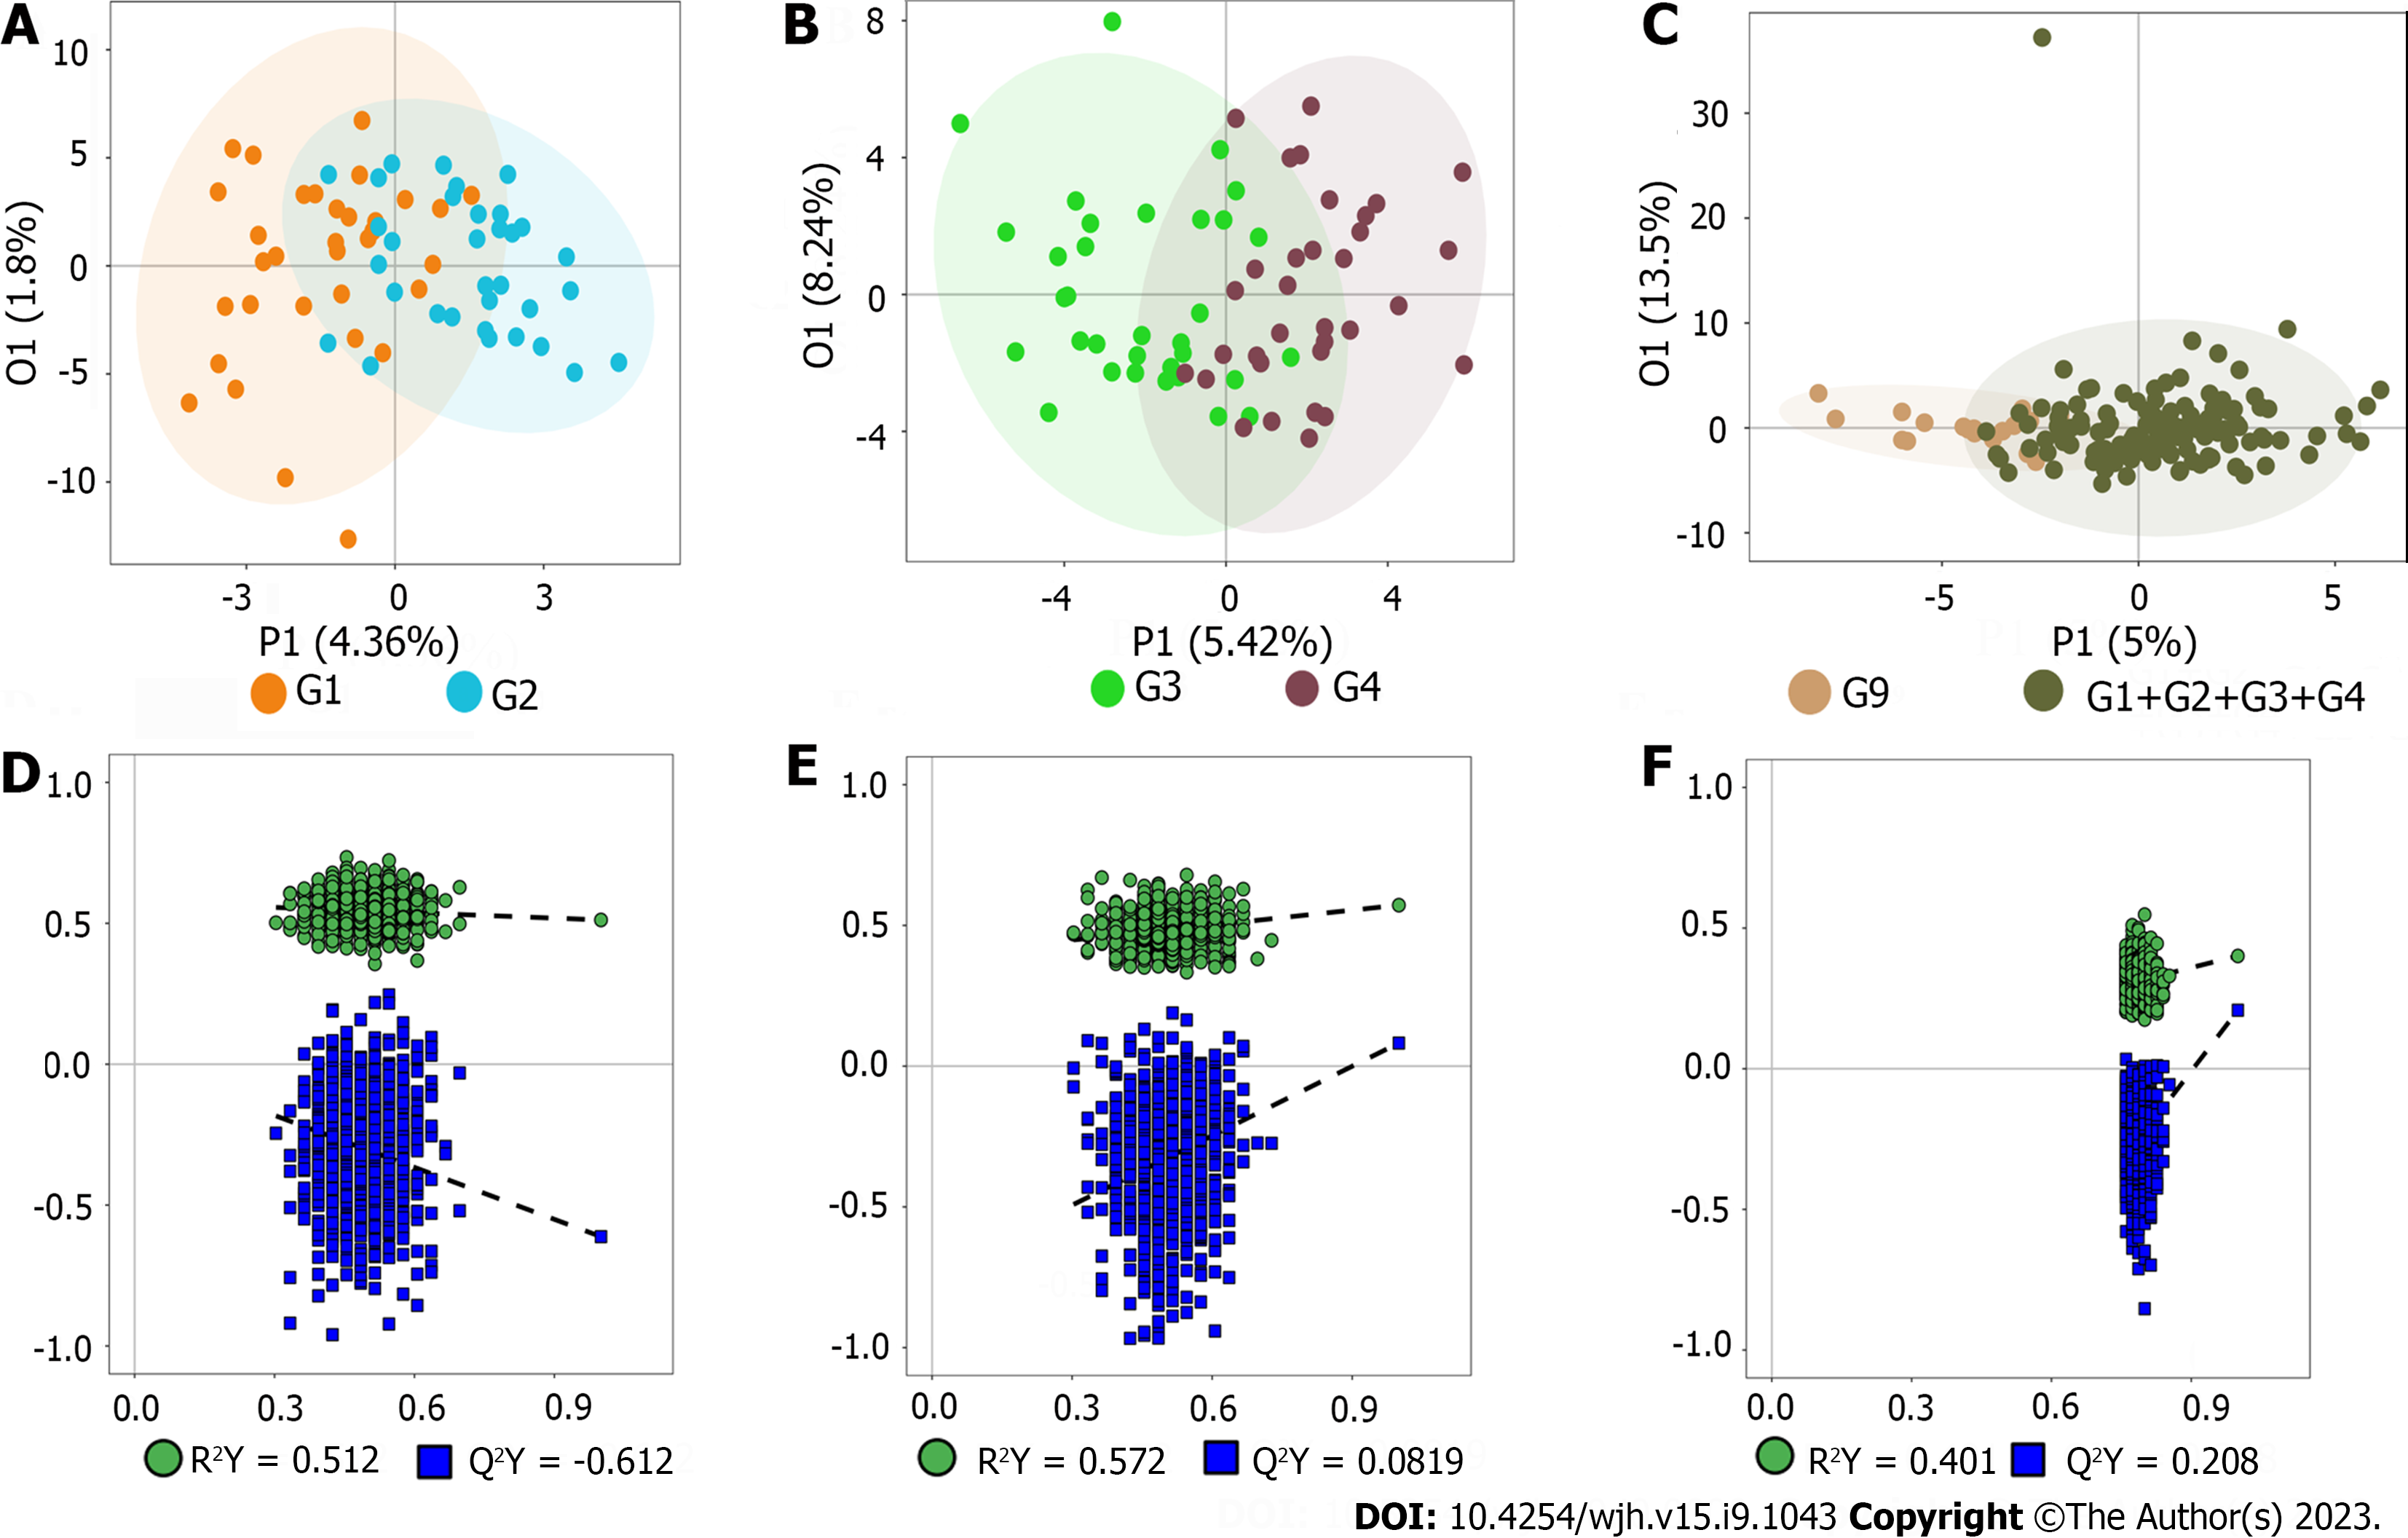
Figure 1 Orthogonal partial least squares discriminant analysis of all the metabolites.
A: Score of entecavir responders (E-R) vs entecavir no-responders (E-N); B: Score of FuzhengHuayu tablet (FZHY) + entecavir responders (F-R) vs FZHY + entecavir no-responders (F-N); C: Score of patients vs volunteers; D: R2X and R2Y of E-R vs E-N; E: R2X and R2Y of F-R vs F-N; F: R2X and R2Y of patients vs volunteers.
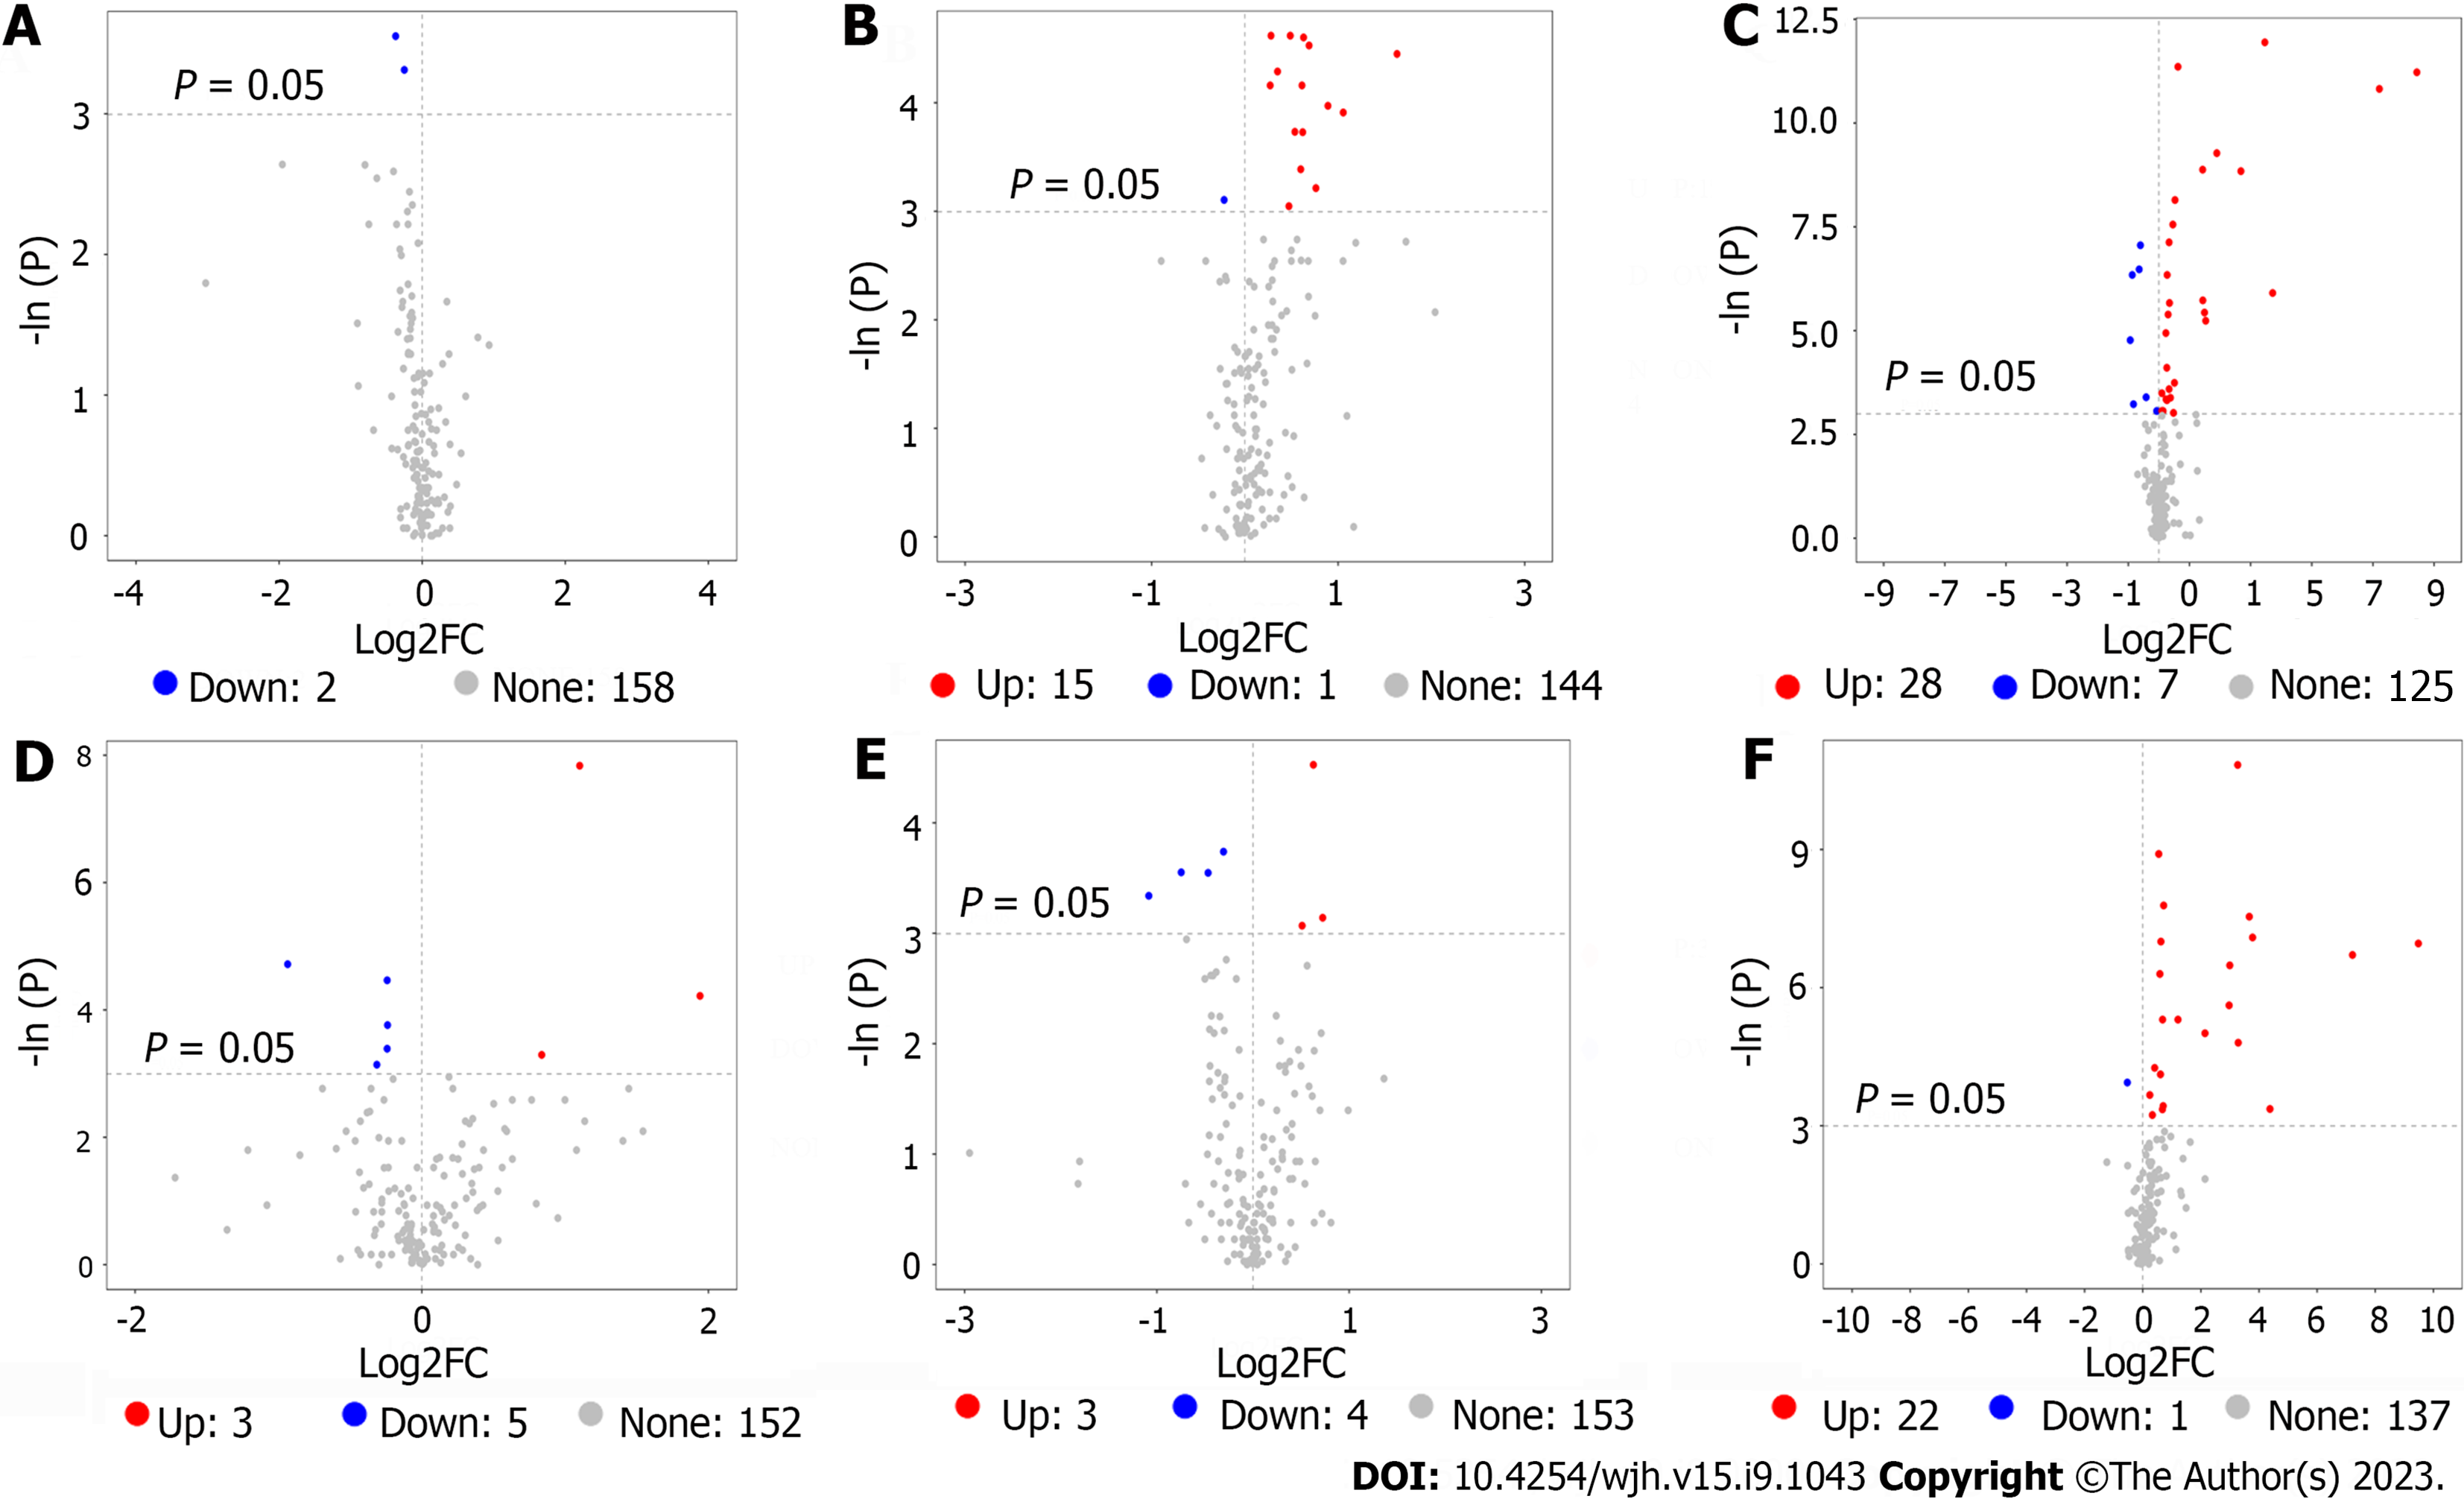
Figure 2 Volcano plot of serum metabolites.
A: Volcano plot of entecavir responders (E-R) vs entecavir no-responders (E-N) (training set); B: Volcano plot of FuzhengHuayu tablet (FZHY) + entecavir responders (F-R) vs FZHY + entecavir no-responders (F-N) (training set); C: Volcano plot of patients vs volunteers (training set); D: Volcano plot of E-R vs E-N (validation set); E: Volcano plot of F-R vs F-N (validation set); F: Volcano plot of patients vs volunteers (validation set).
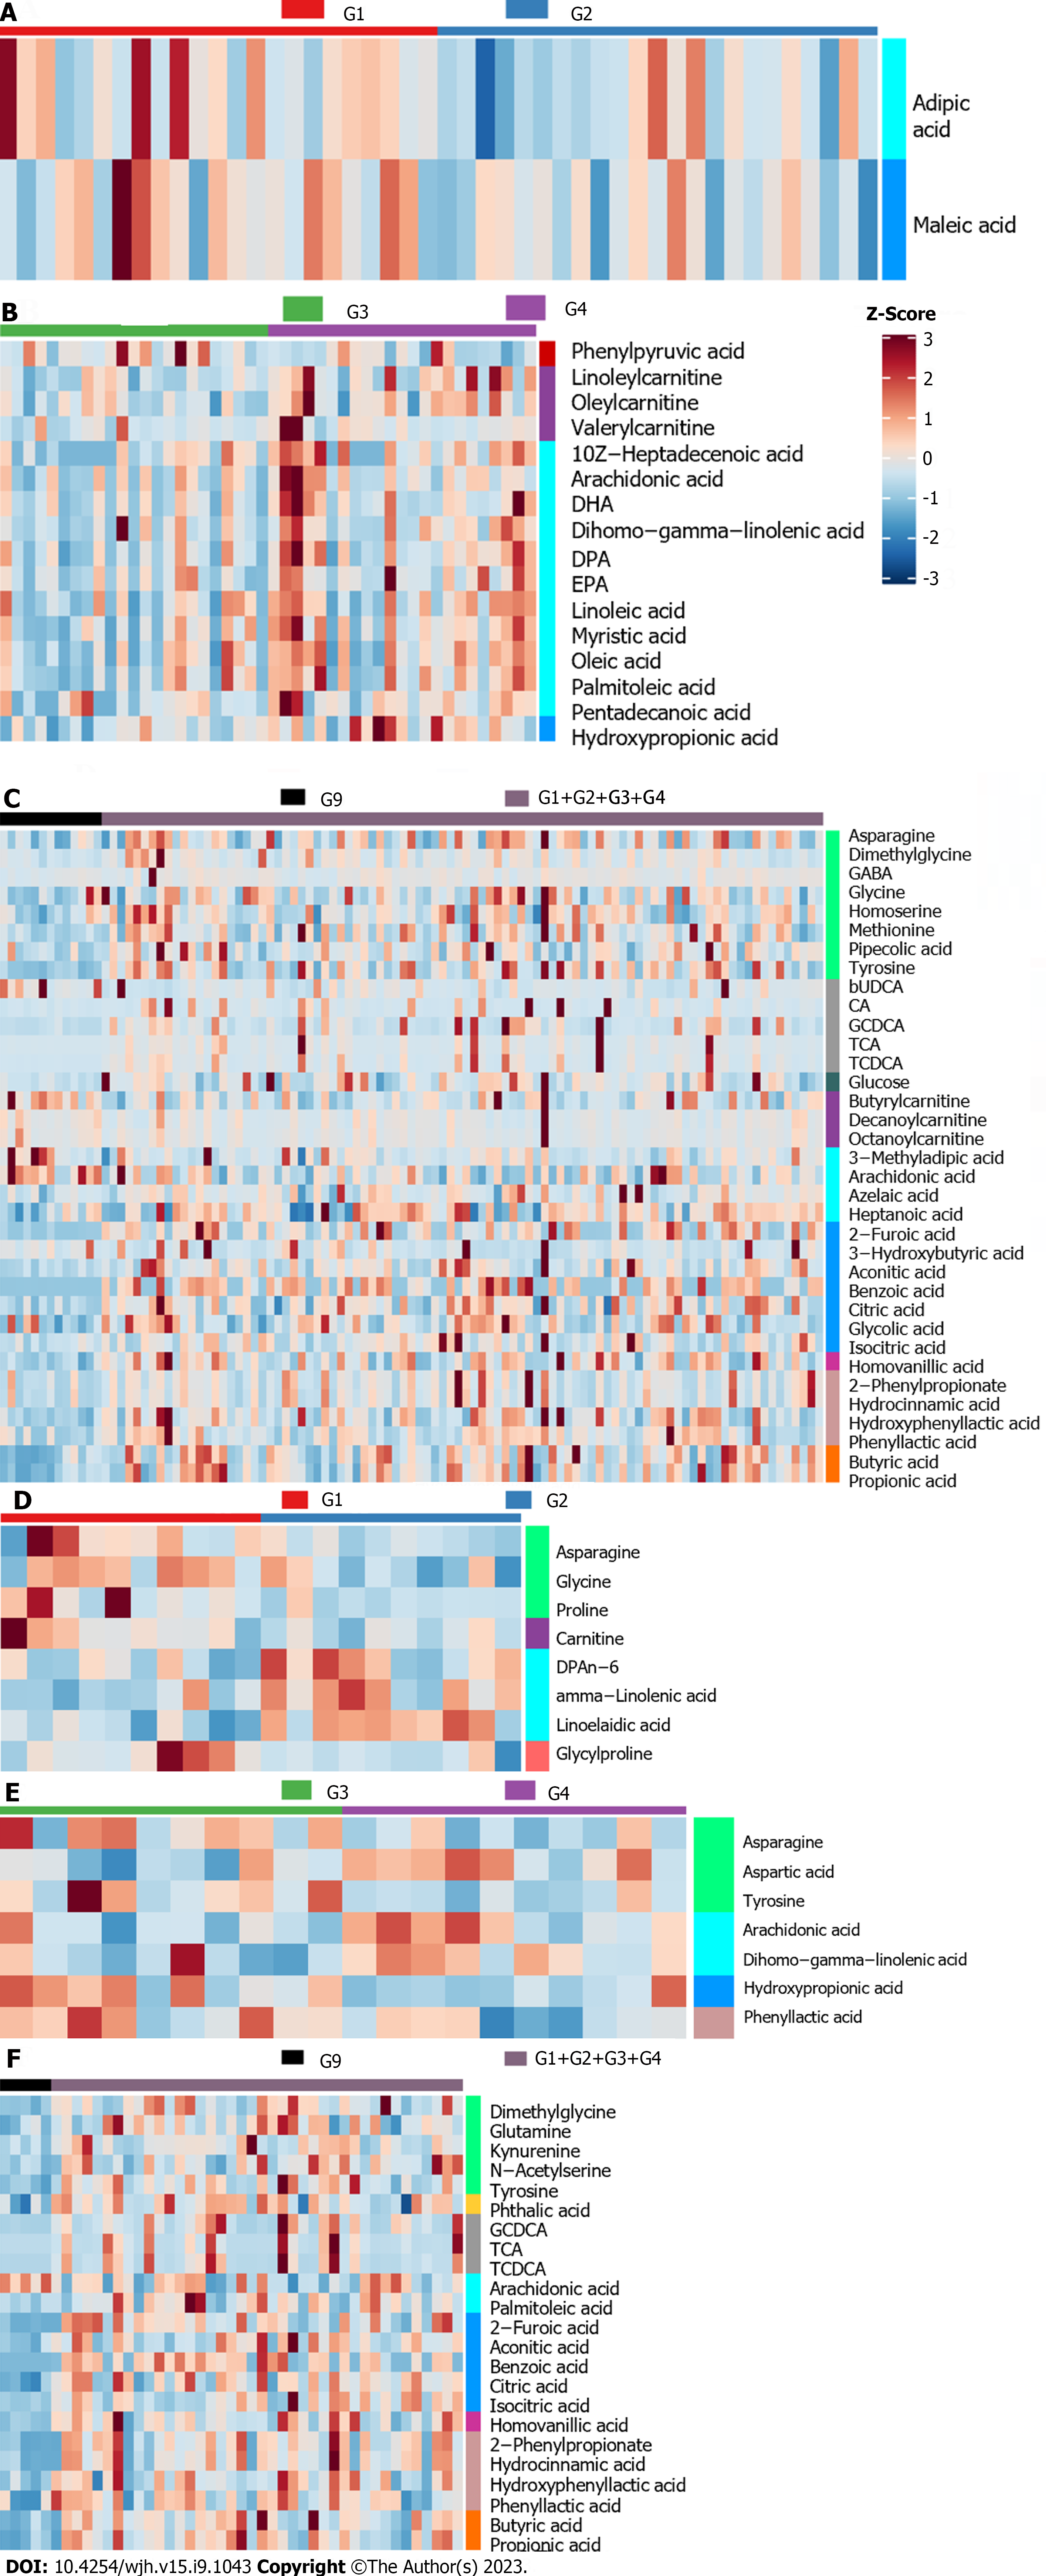
Figure 3 Heatmap of all the selected potential metabolites.
A: Heatmap of entecavir responders (E-R) vs entecavir no-responders (E-N) (training set); B: Heatmap of FuzhengHuayu tablet (FZHY) + entecavir responders (F-R) vs FZHY + entecavir no-responders (F-N) (training set); C: Heatmap of patients vs volunteers (training set); D: Heatmap of E-R vs E-N (validation set); E: Heatmap of F-R vs F-N (validation set); F: Heatmap of patients vs volunteers (validation set). CA: Citric acid; GCDCA: Glycochenodeoxycholic acid; TCA: Tricarboxylic acid; TCDCA: Aurochenodeoxycholic acid; DHA: Docosahexaenoic acid; DPA: Docosapentaenoic acid; EPA: Eicosapentaenoic acid.
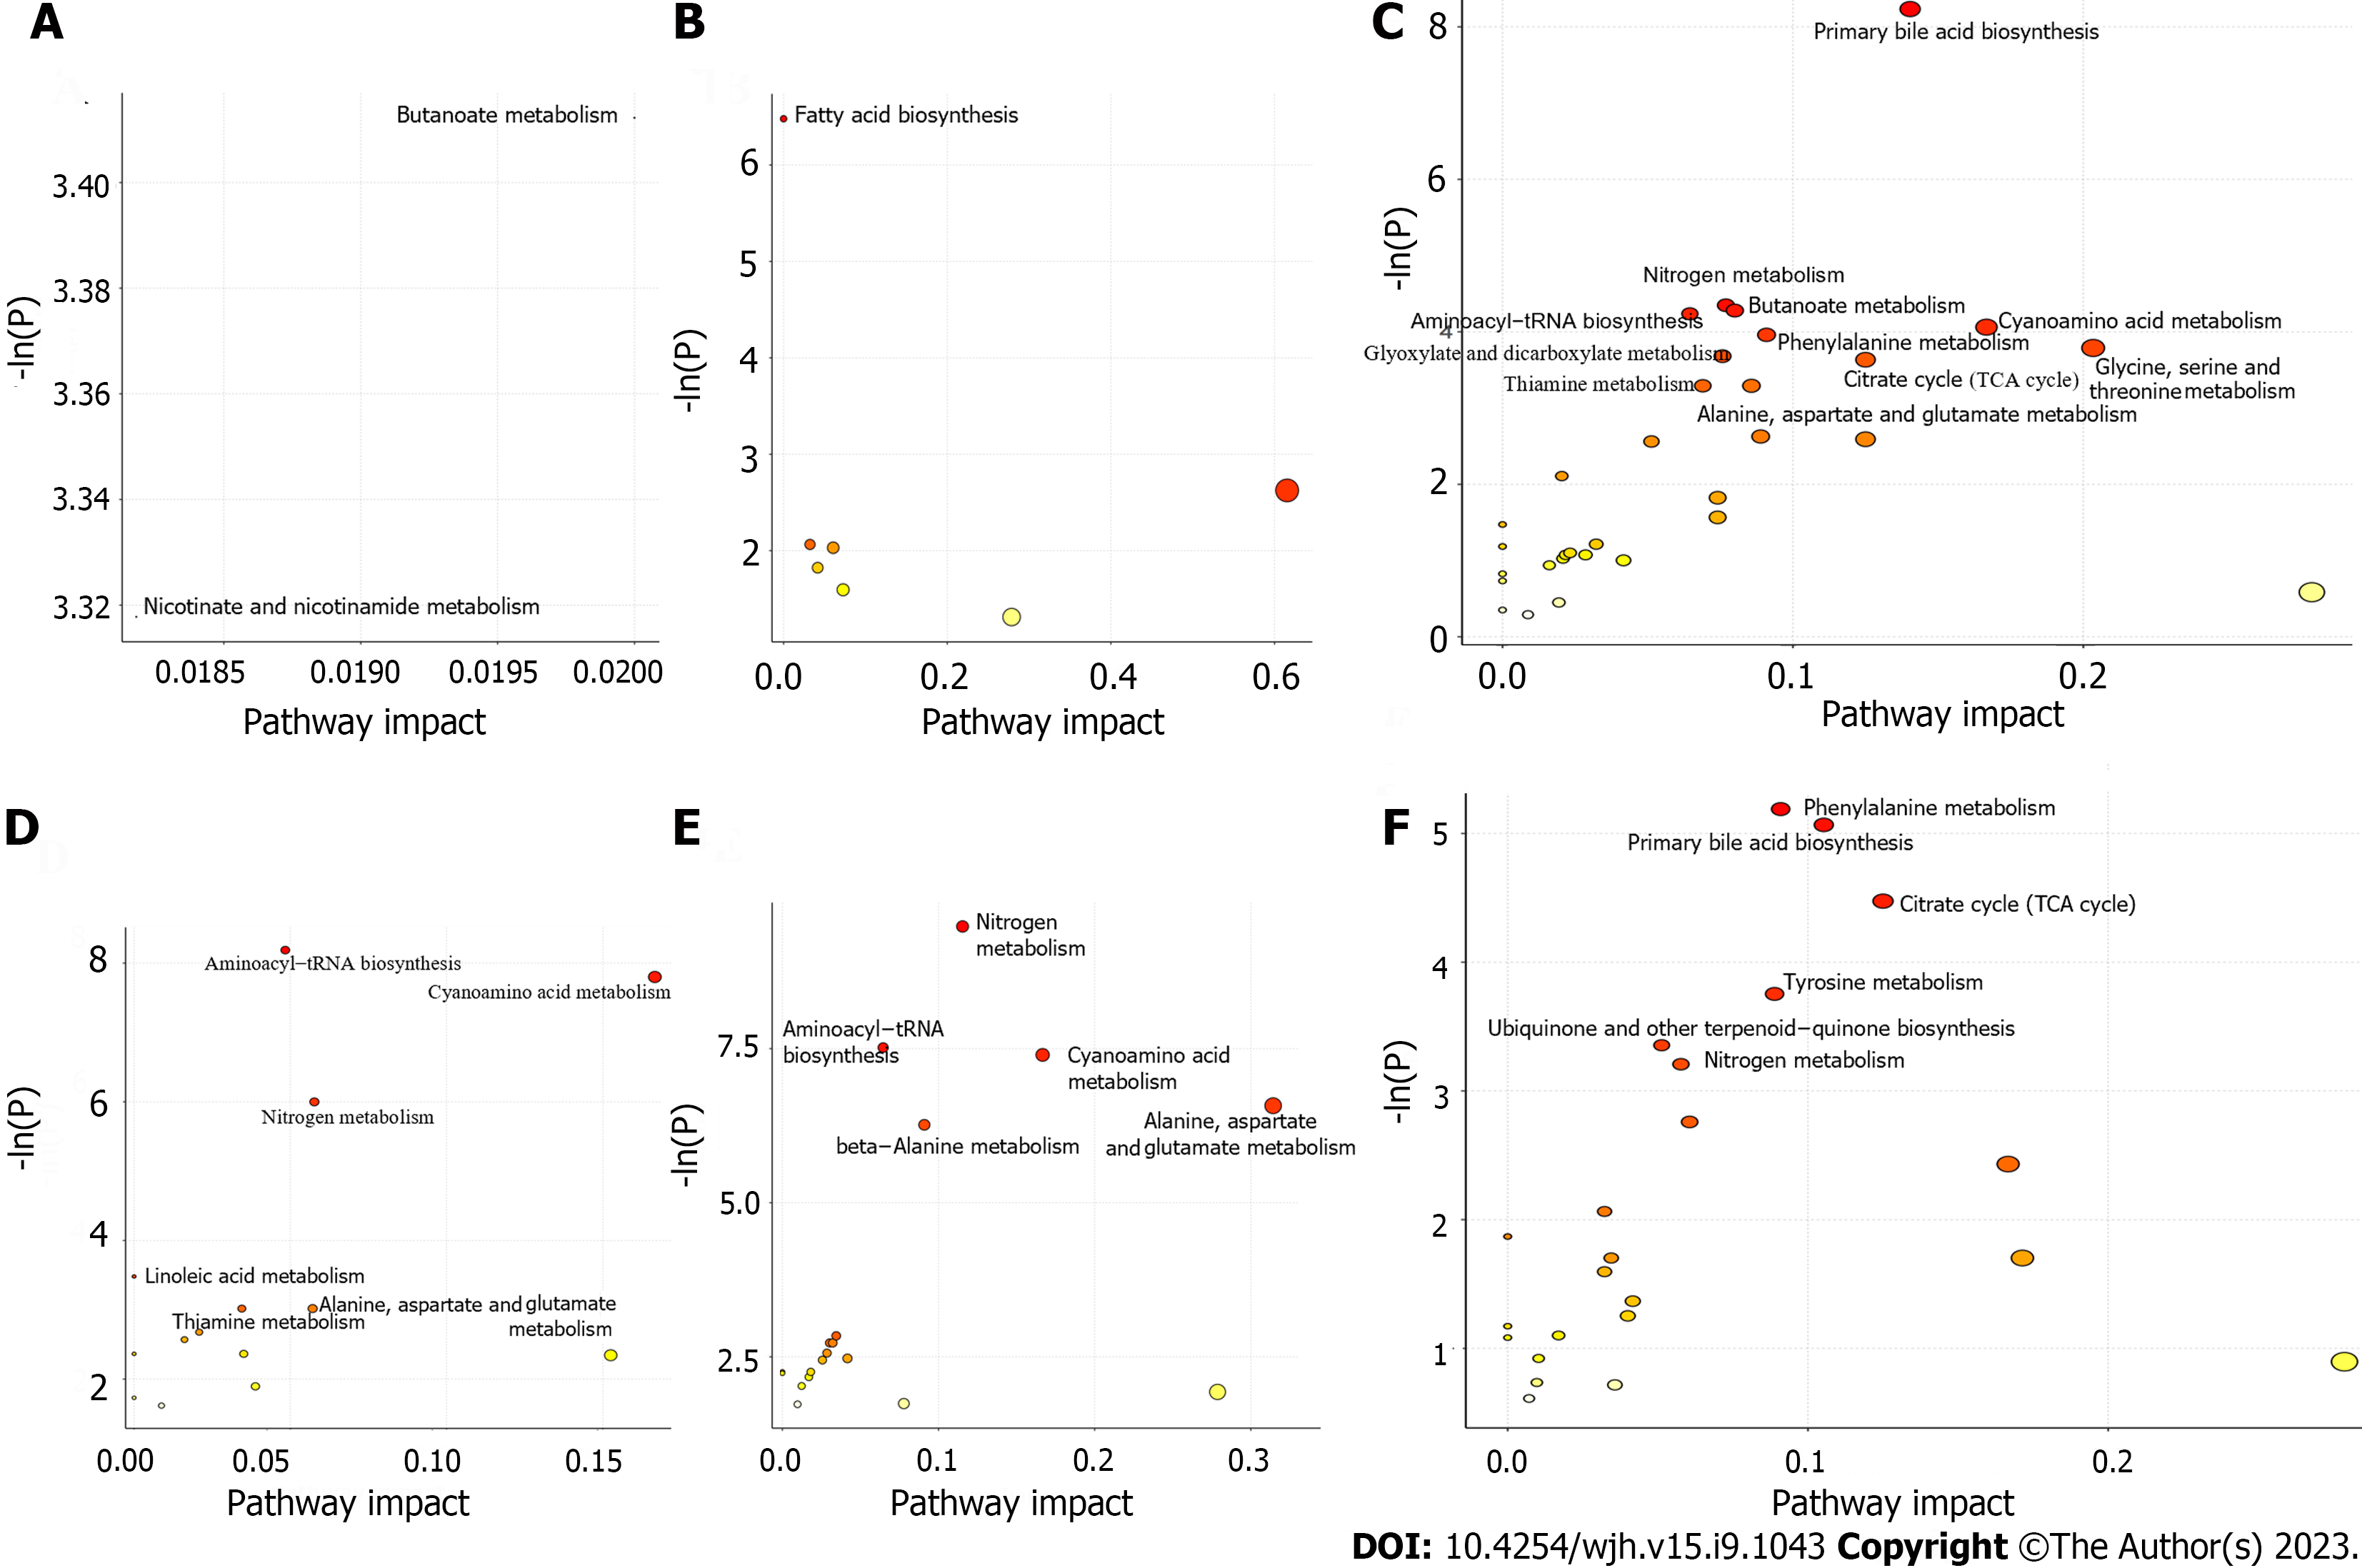
Figure 4 Bubbleplot of the selected metabolites pathways.
A: Bubbleplot of entecavir responders (E-R) vs entecavir no-responders (E-N) (training set); B: Bubbleplot of FuzhengHuayu tablet (FZHY) + entecavir responders (F-R) vs FZHY + entecavir no-responders (F-N) (training set); C: Bubbleplot of patients vs volunteers (training set); D: Bubbleplot of E-R vs E-N (validation set); E: Bubbleplot of F-R vs F-N (validation set); F: Bubbleplot of patients vs volunteers (validation set). TCA: Tricarboxylic acid.
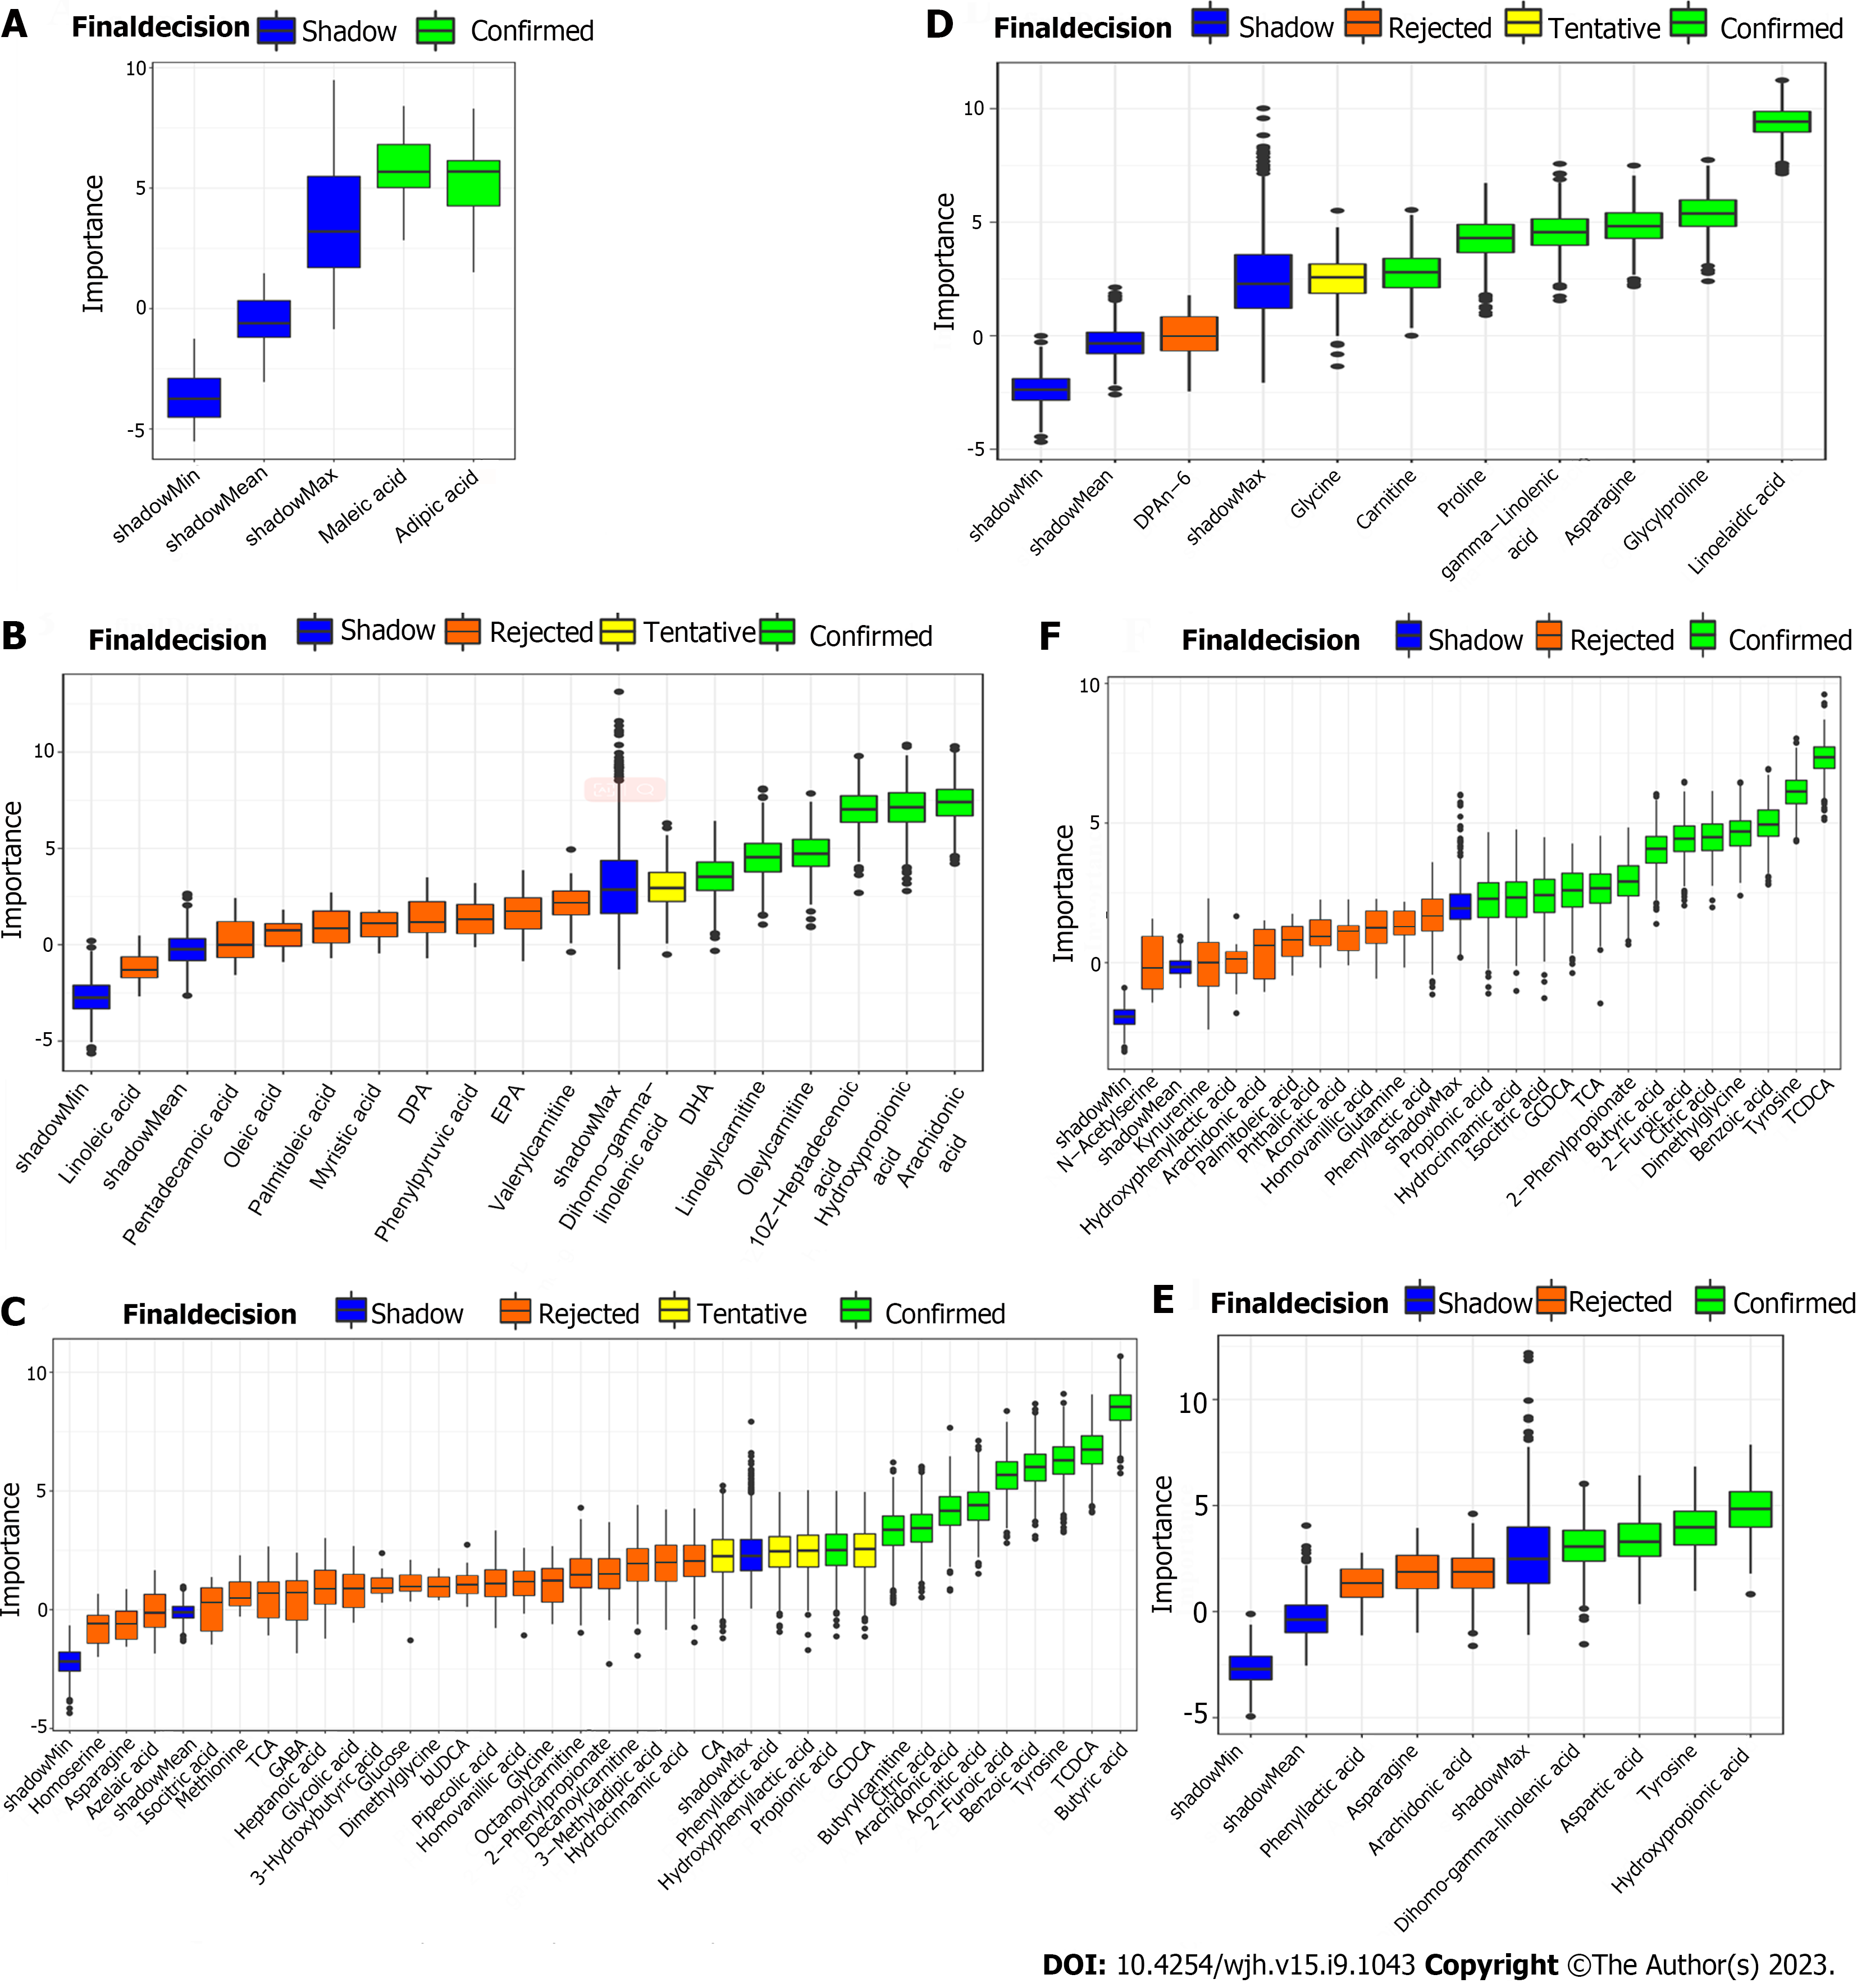
Figure 5 Boxplot of all the differential metabolites.
A: Boxplot of entecavir responders (E-R) vs entecavir no-responders (E-N) (training set); B: Boxplot of FuzhengHuayu tablet (FZHY) + entecavir responders (F-R) vs FZHY + entecavir no-responders (F-N) (training set); C: Boxplot of patients vs volunteers (training set); D: Boxplot of E-R vs E-N (validation set); E: Boxplot of F-R vs F-N (validation set); F: Boxplot of patients vs volunteers (validation set).
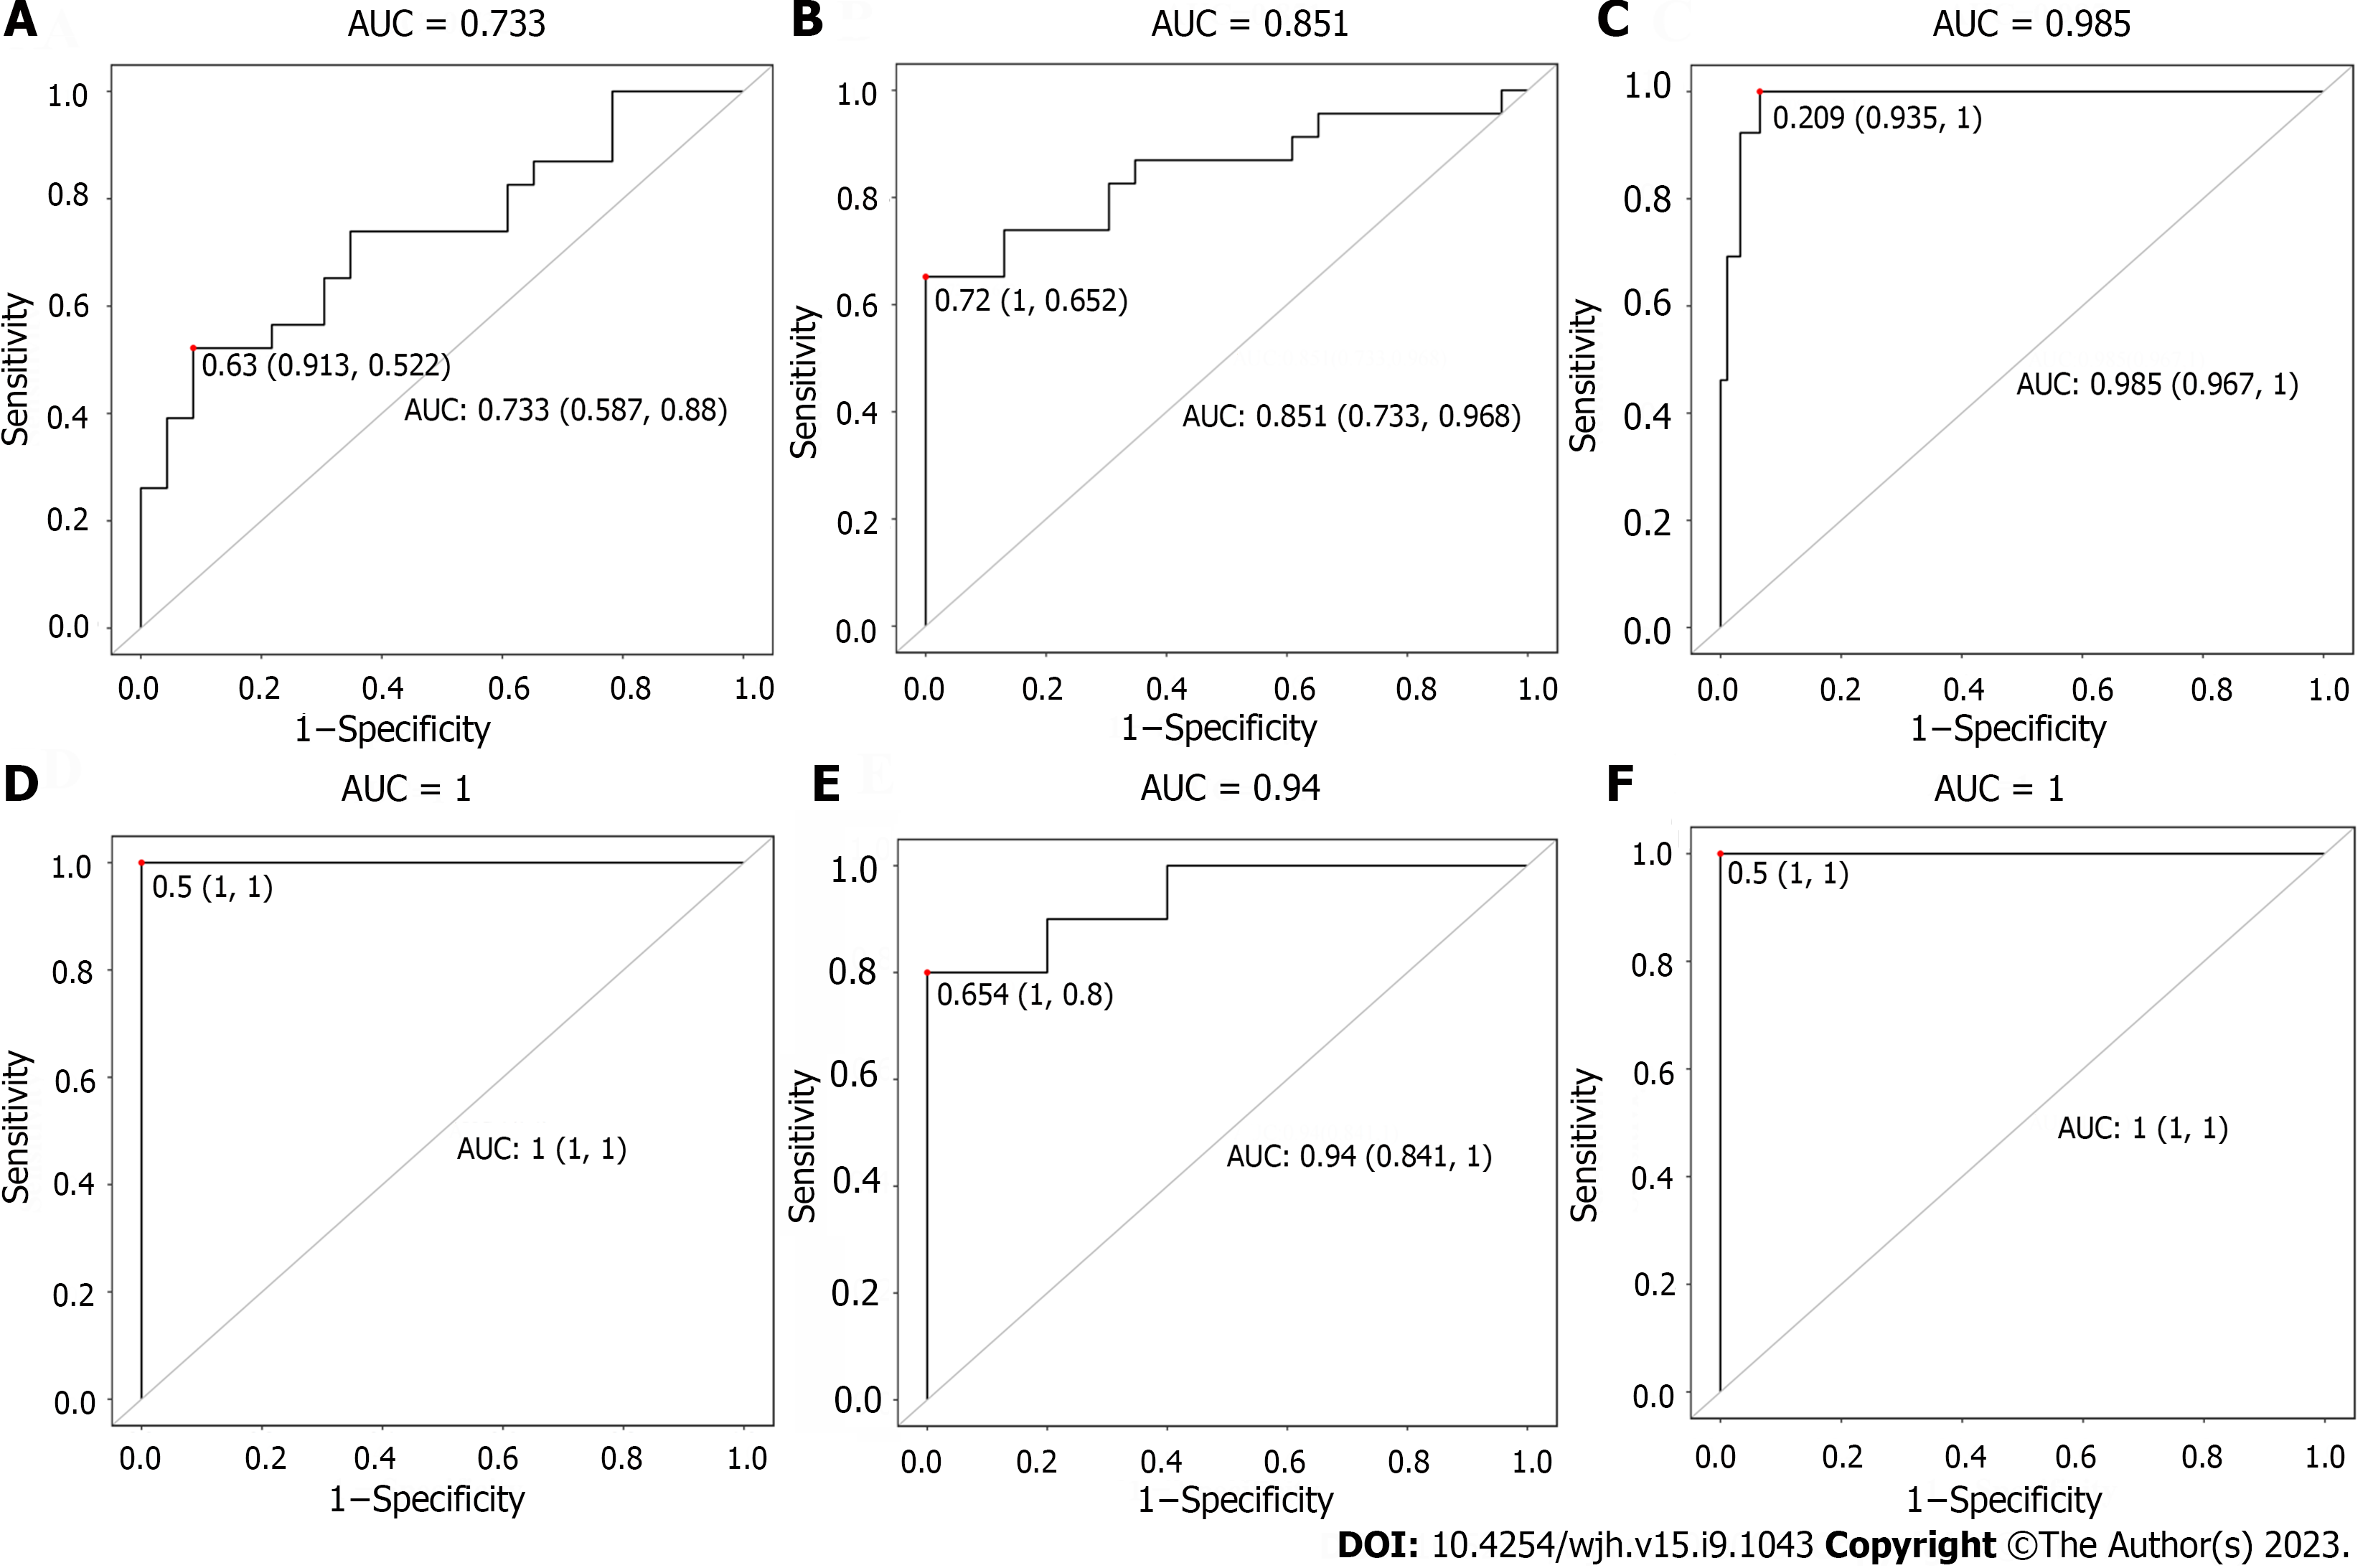
Figure 6 Receiver operating characteristic curve of all the differential metabolites.
A: Receiver operating characteristic (ROC) curve of entecavir responders (E-R) vs entecavir no-responders (E-N) (training set); B: ROC curve of FuzhengHuayu tablet (FZHY) + entecavir responders (F-R) vs FZHY + entecavir no-responders (F-N) (training set); C: ROC curve of patients vs volunteers (training set); D: ROC curve of E-R vs E-N (validation set); E: ROC curve of F-R vs F-N (validation set); F: ROC curve of patients vs volunteers (validation set). AUC: Area under the curve.
- Citation: Dai YK, Fan HN, Huang K, Sun X, Zhao ZM, Liu CH. Baseline metabolites could predict responders with hepatitis B virus-related liver fibrosis for entecavir or combined with FuzhengHuayu tablet. World J Hepatol 2023; 15(9): 1043-1059
- URL: https://www.wjgnet.com/1948-5182/full/v15/i9/1043.htm
- DOI: https://dx.doi.org/10.4254/wjh.v15.i9.1043


