Copyright
©The Author(s) 2022.
World J Hepatol. Aug 27, 2022; 14(8): 1621-1632
Published online Aug 27, 2022. doi: 10.4254/wjh.v14.i8.1621
Published online Aug 27, 2022. doi: 10.4254/wjh.v14.i8.1621
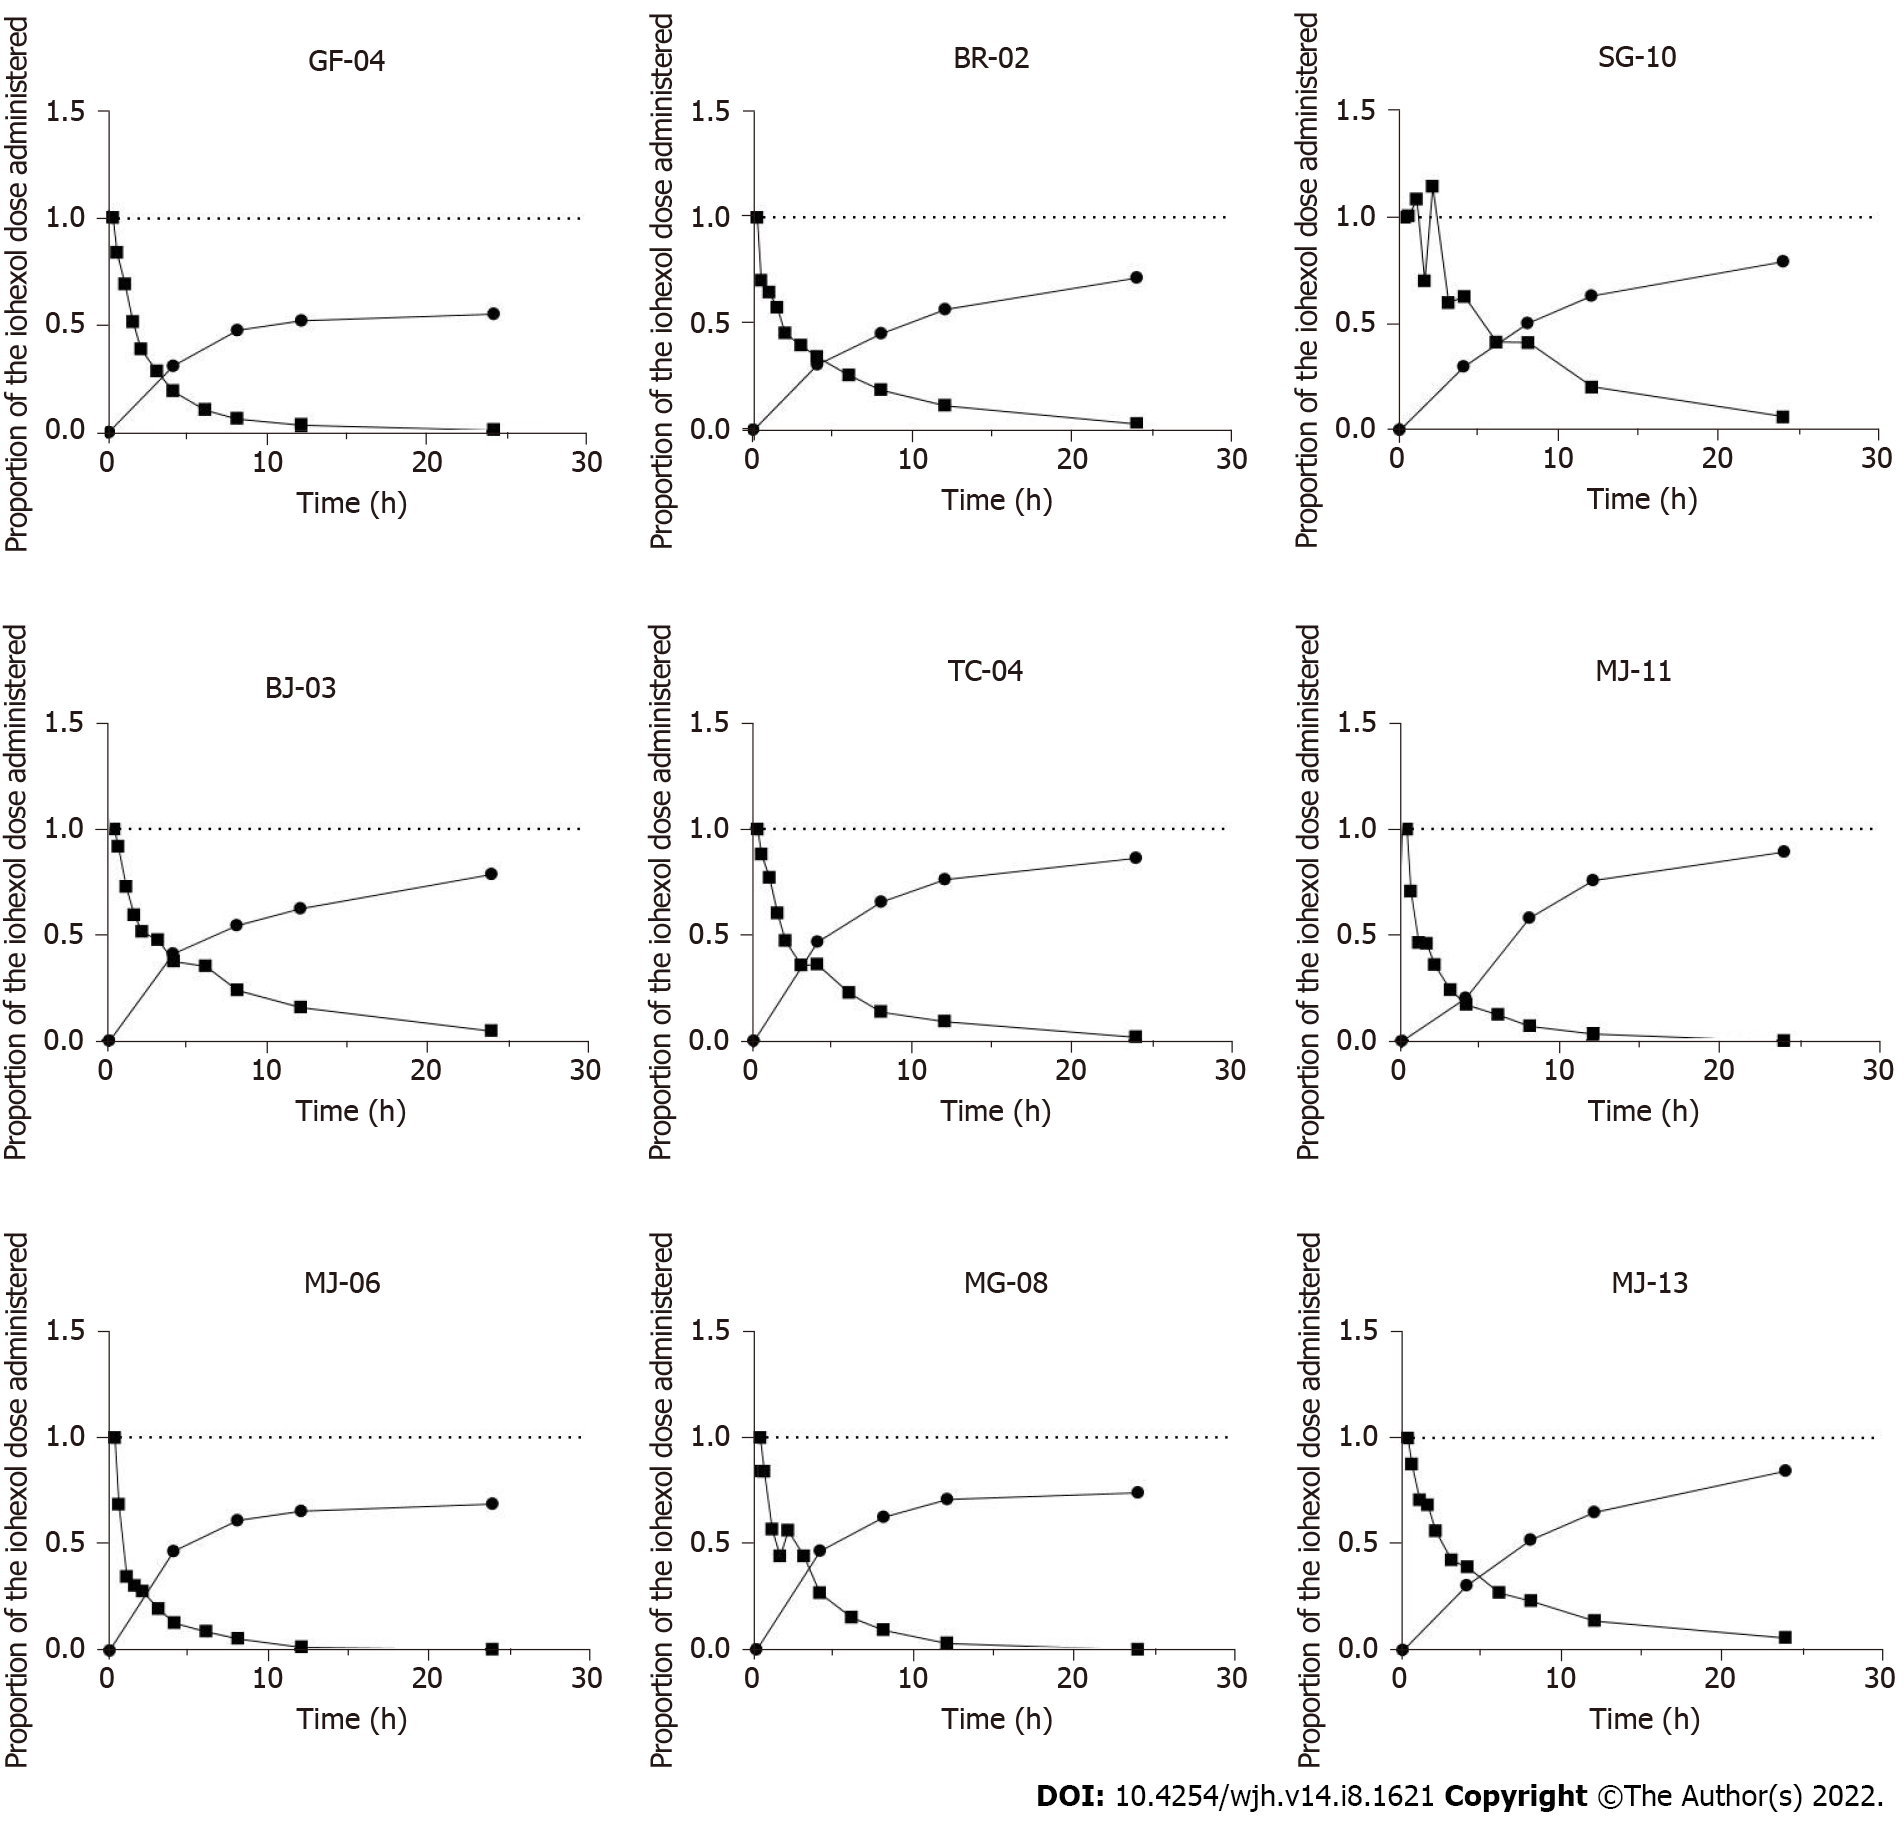
Figure 1 For each patient studied, proportion of the iohexol administered dose detectable as a function of time in plasma and urine.
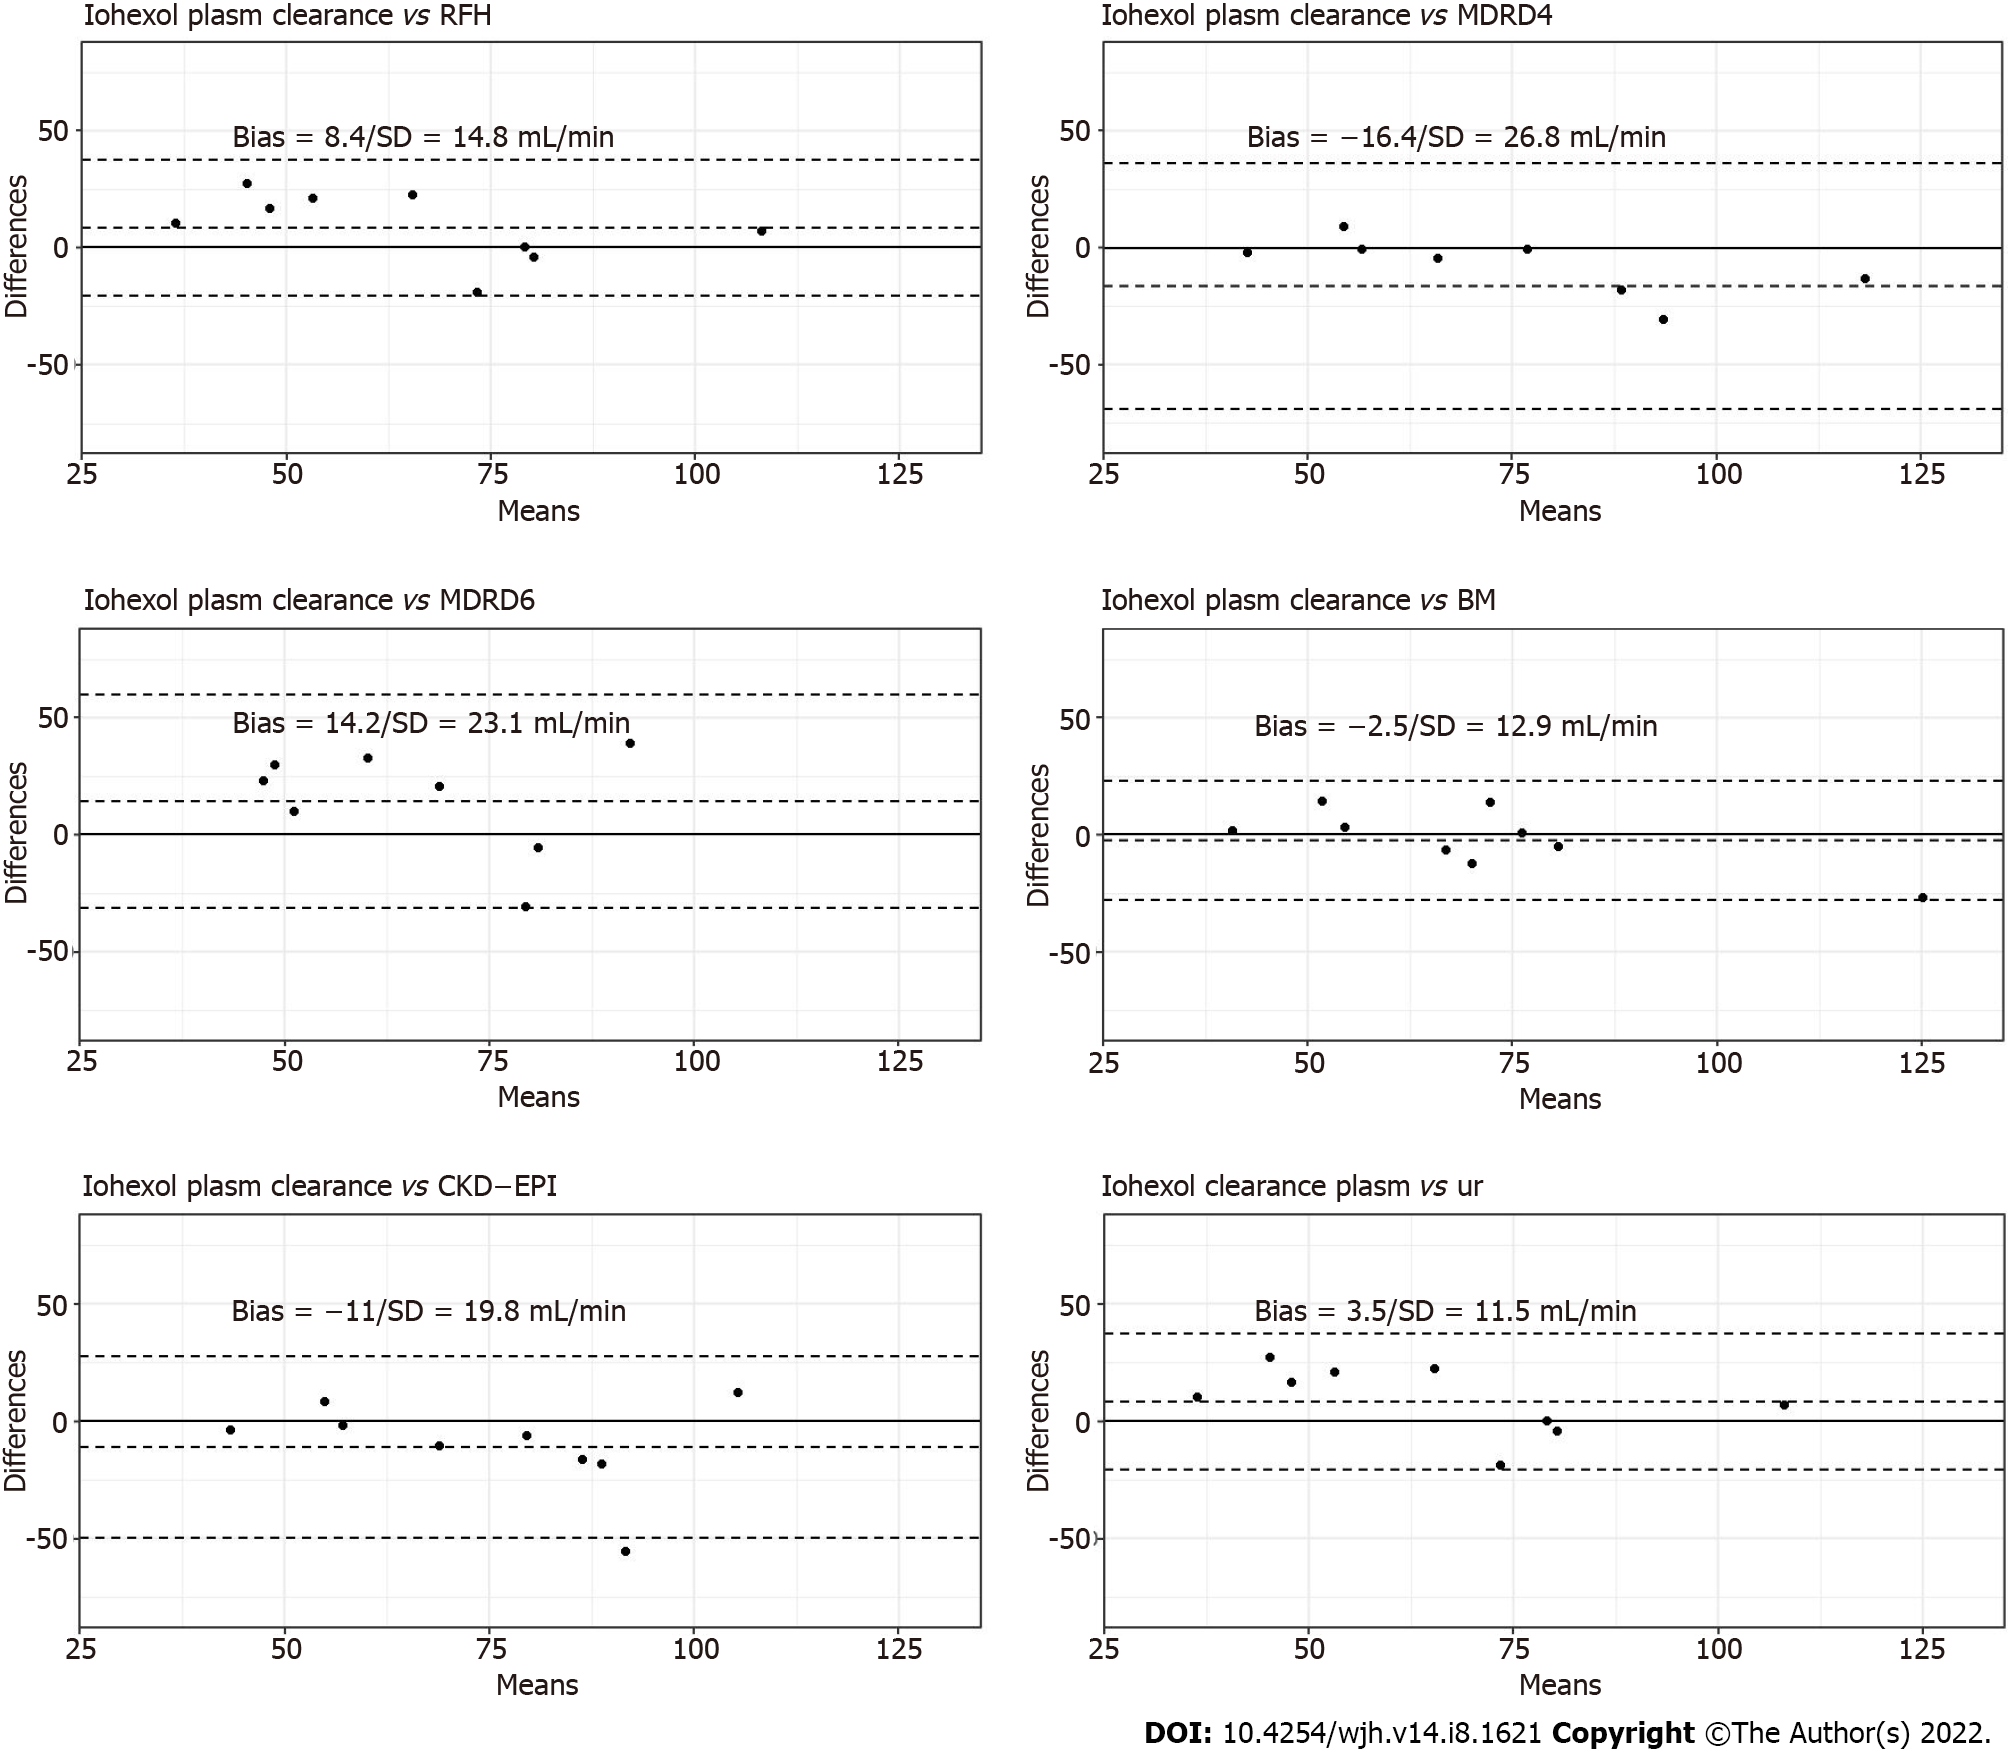
Figure 2 Bland–Altman plots for creatinine-based formula, Royal Free Hospital formula, Brochner–Mortensen formula and iohexol urinary clearance in comparison to iohexol plasma clearance.
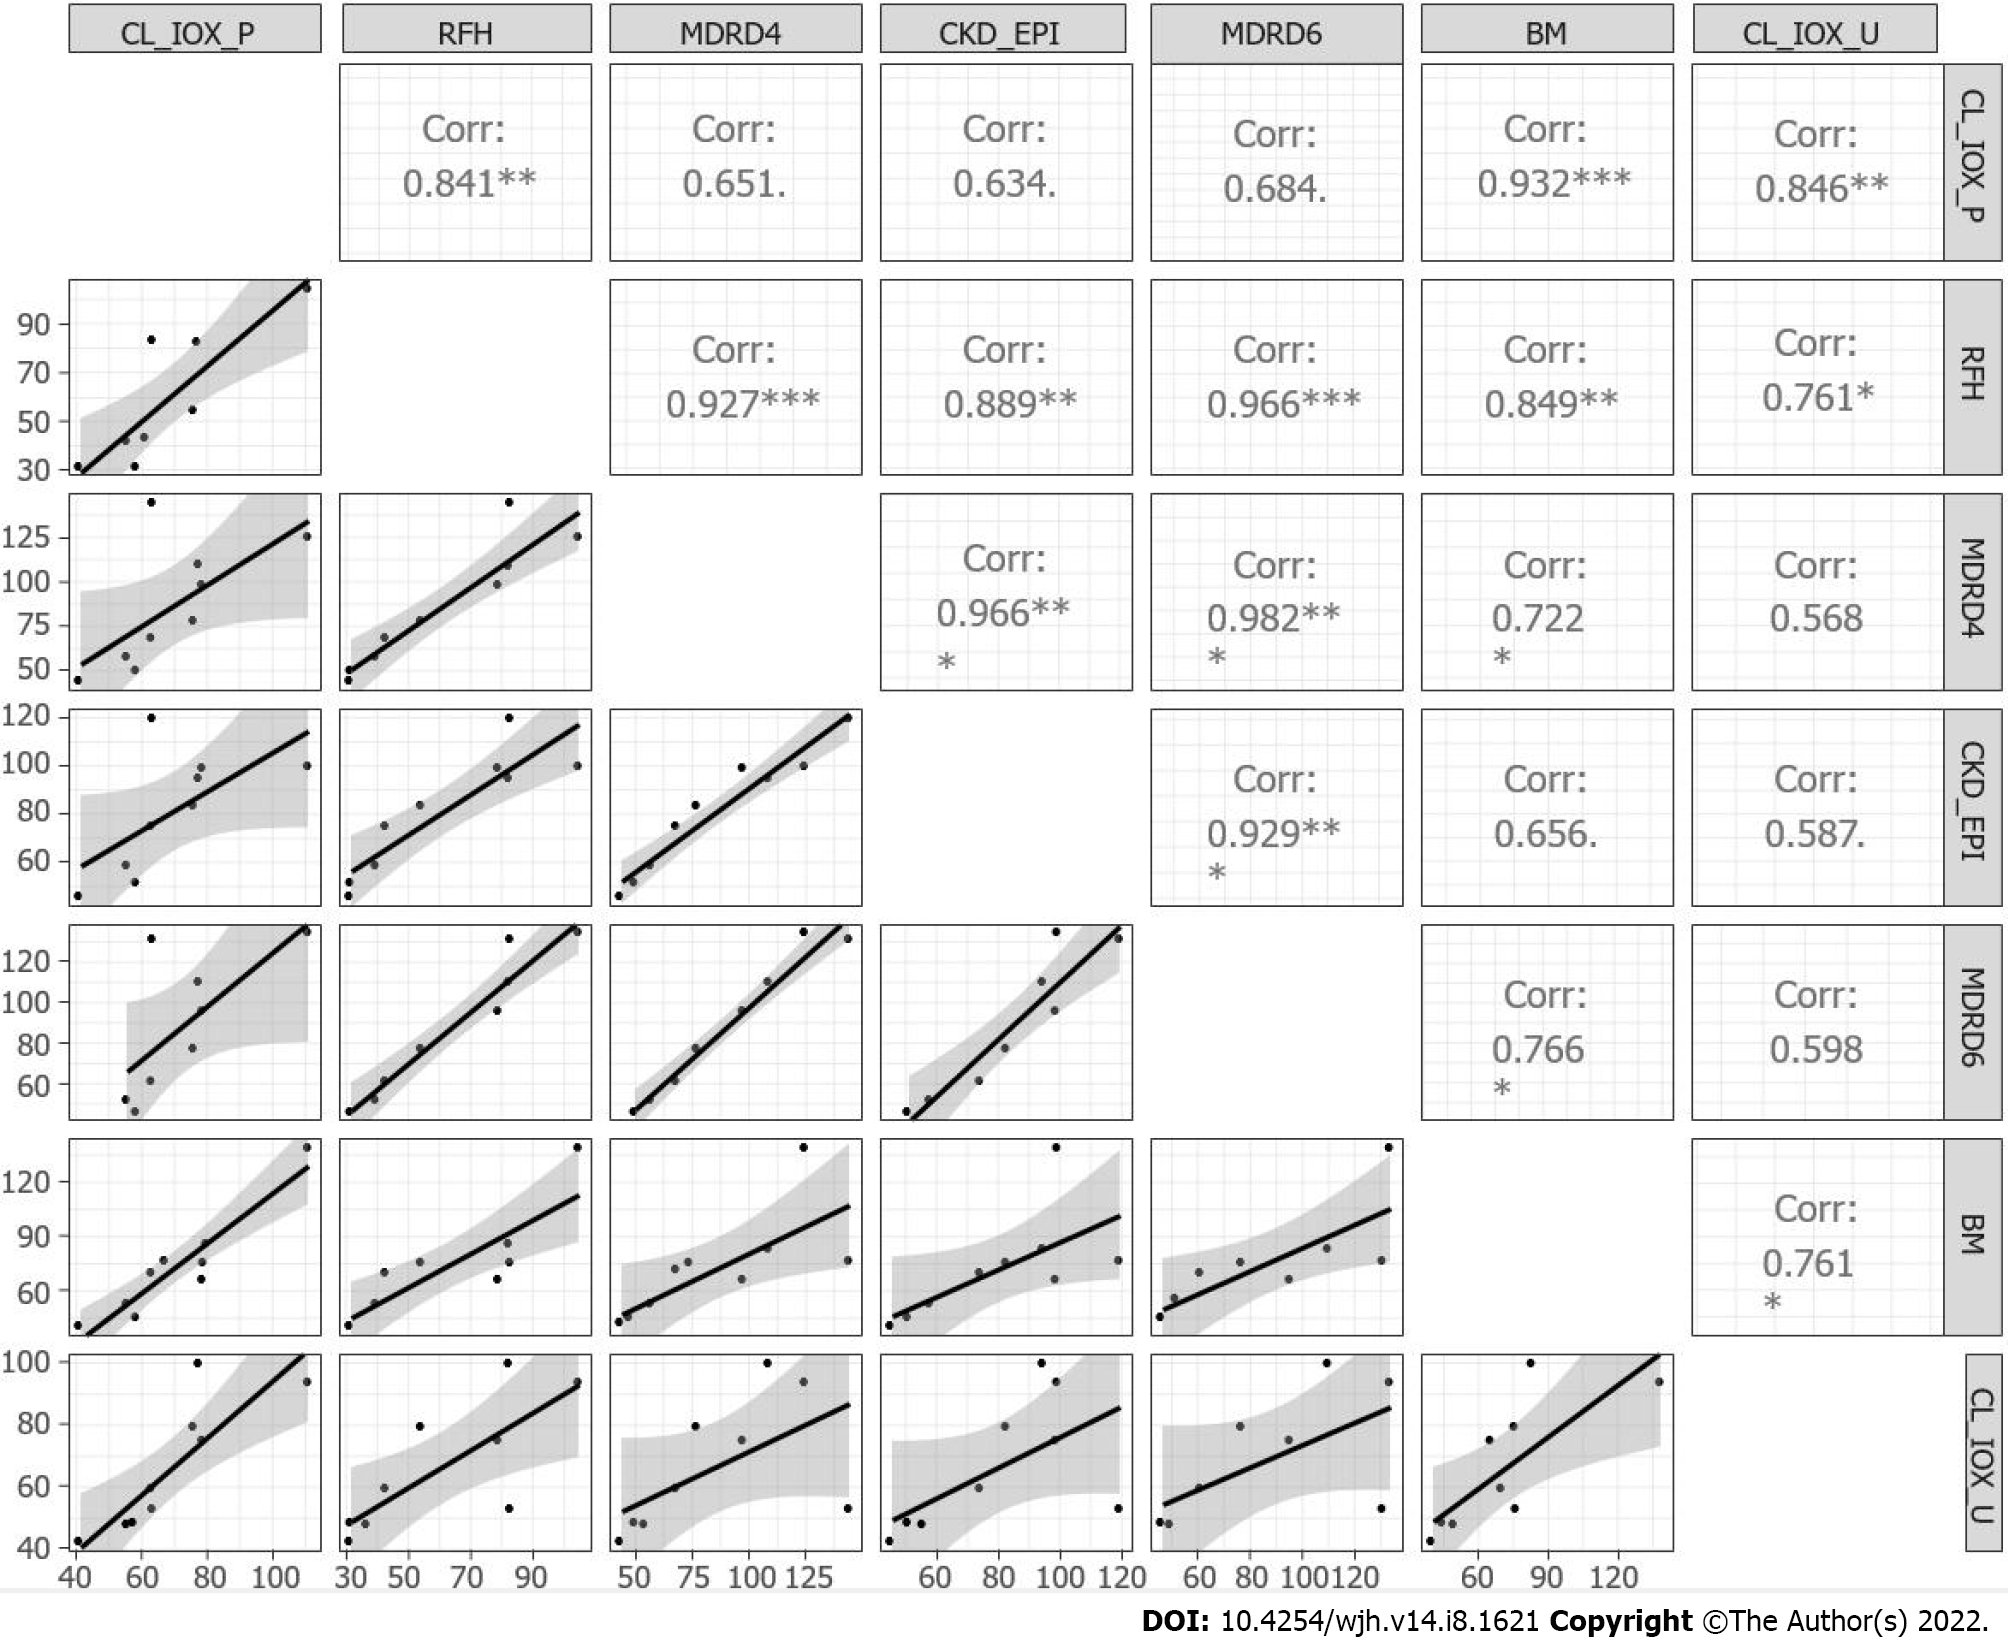
Figure 3 Matrix correlation and scatter plots for the iohexol plasma and urinary clearance, the creatinine-based equations, RHF and Brochner–Mortensen.
CL-IOX-P: Iohexol plasma clearance; CL-IOX-U: Iohexol urinary clearance.
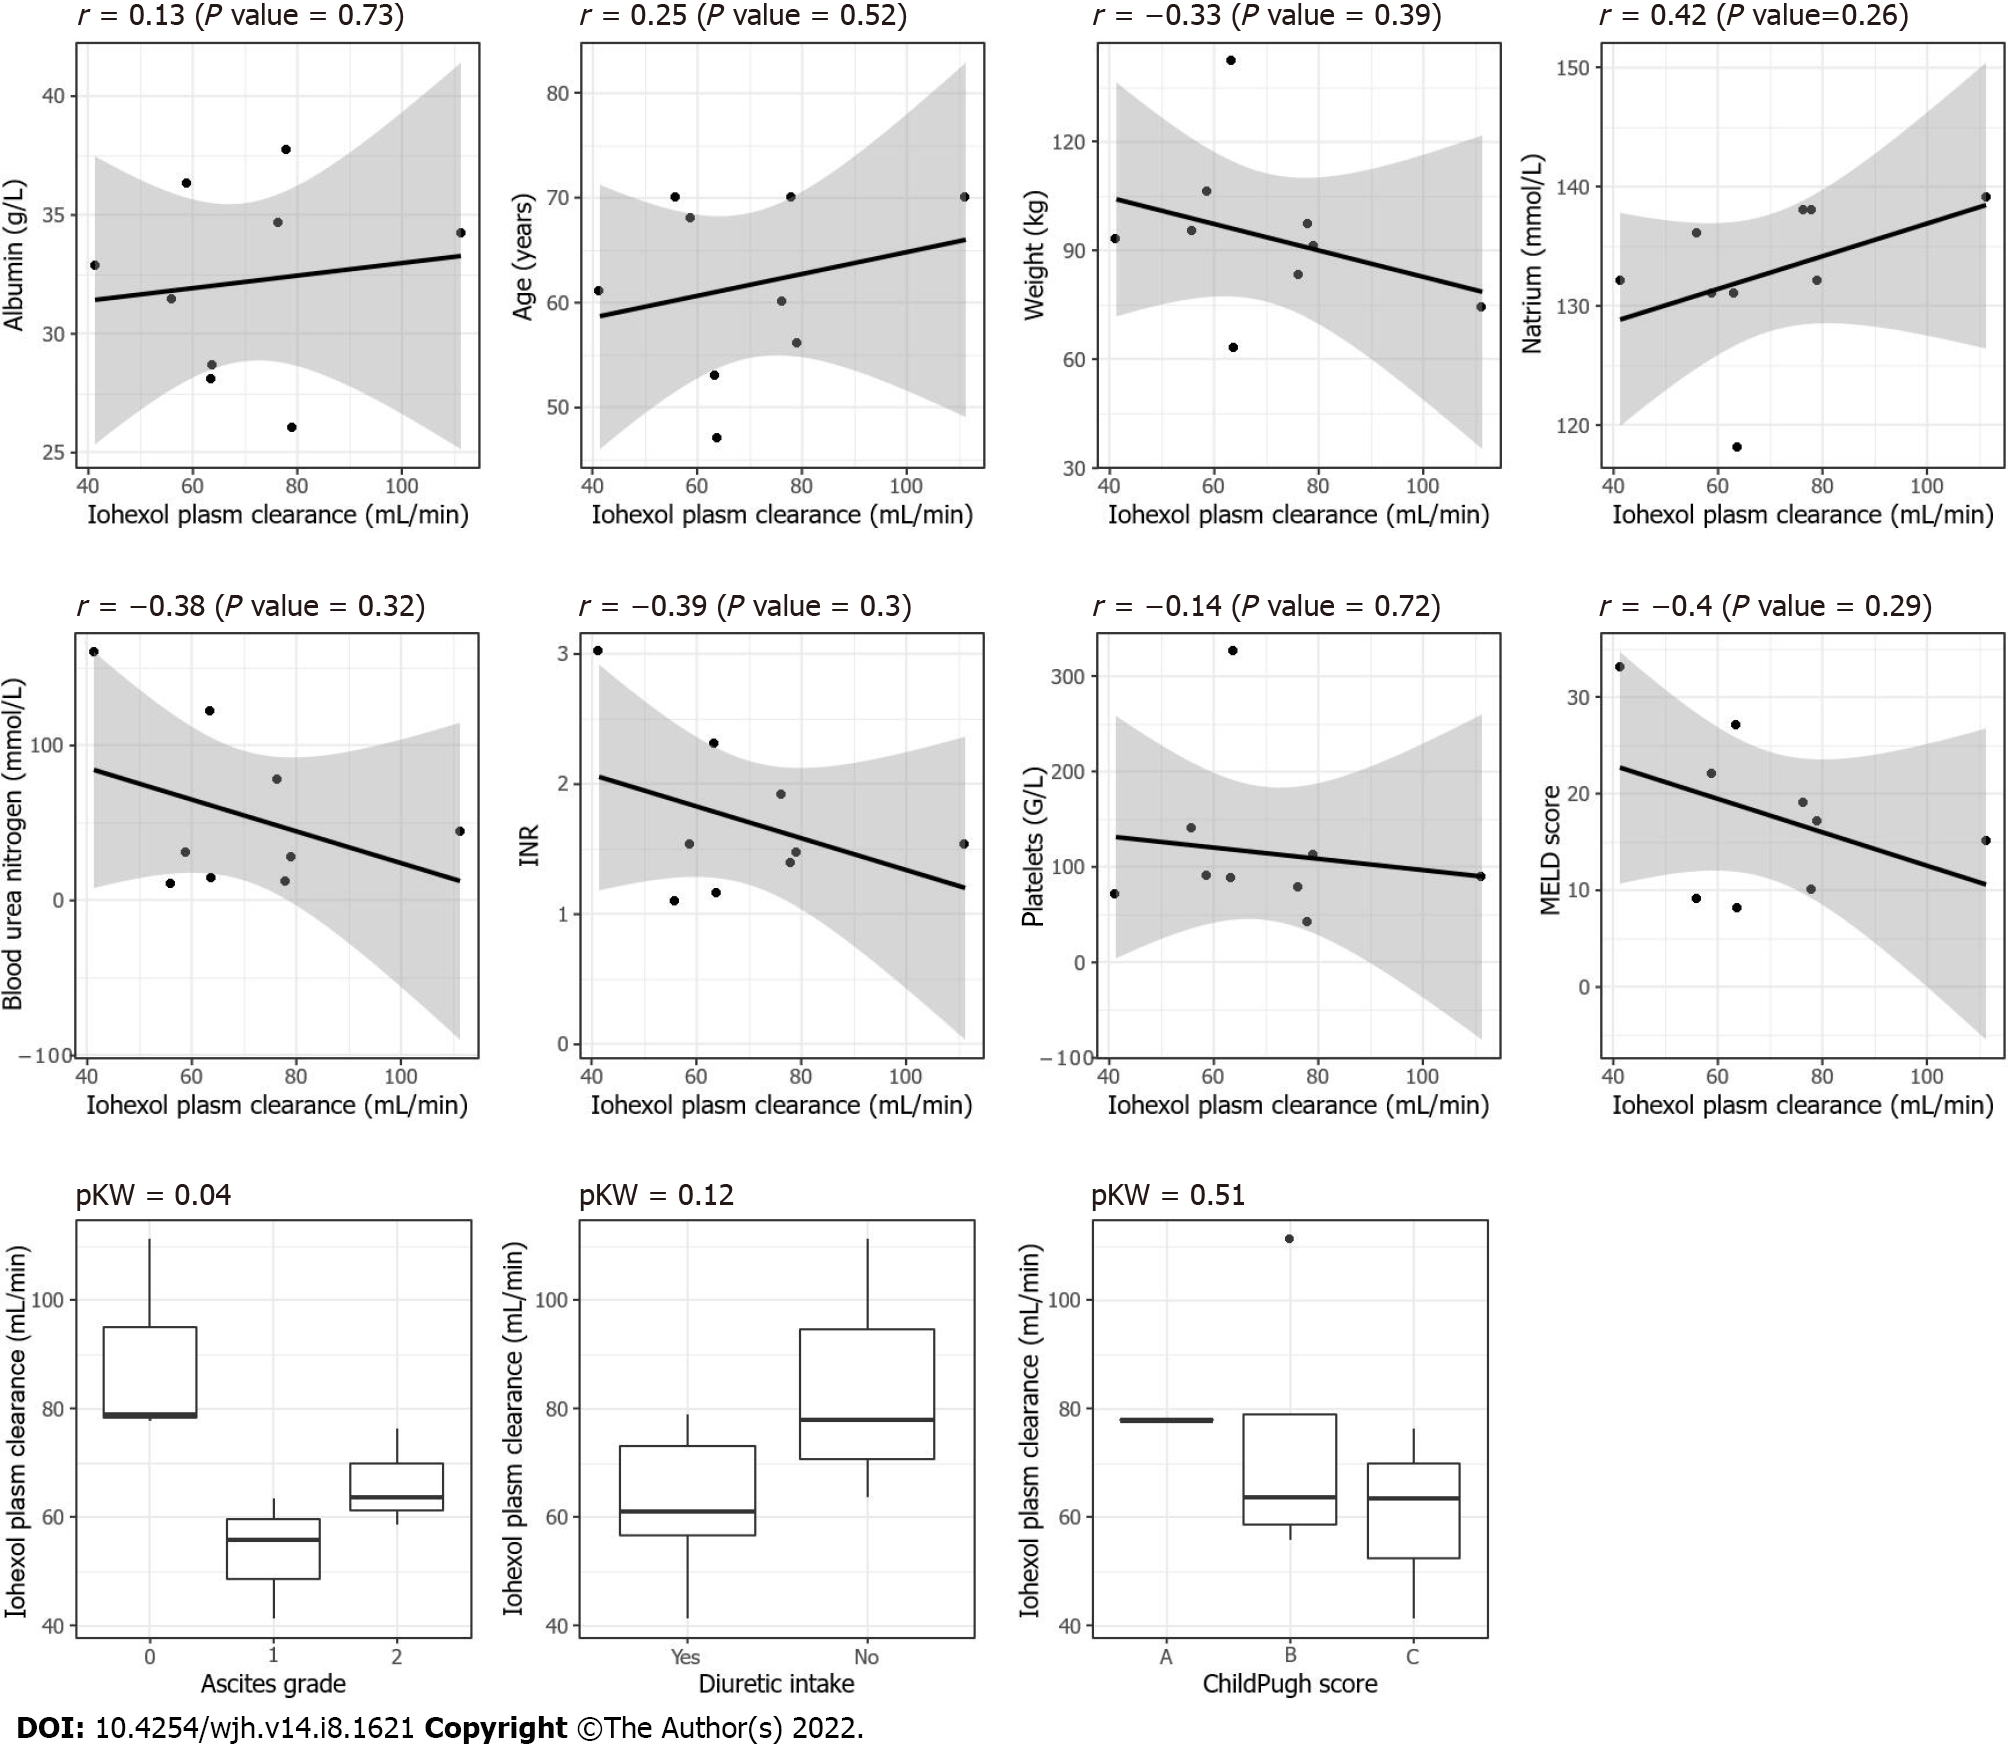
Figure 4 Scatter plot and boxplots between the different covariables including the grade of ascites (0 = no ascites, 1 = grade I, 2 = grade II or III) and the iohexol plasma clearance, P KW = P value for the Kruskal–Wallis test.
- Citation: Carrier P, Destere A, Giguet B, Debette-Gratien M, Essig M, Monchaud C, Woillard JB, Loustaud-Ratti V. Iohexol plasma and urinary concentrations in cirrhotic patients: A pilot study. World J Hepatol 2022; 14(8): 1621-1632
- URL: https://www.wjgnet.com/1948-5182/full/v14/i8/1621.htm
- DOI: https://dx.doi.org/10.4254/wjh.v14.i8.1621


