Copyright
©The Author(s) 2022.
World J Hepatol. Jul 27, 2022; 14(7): 1365-1381
Published online Jul 27, 2022. doi: 10.4254/wjh.v14.i7.1365
Published online Jul 27, 2022. doi: 10.4254/wjh.v14.i7.1365
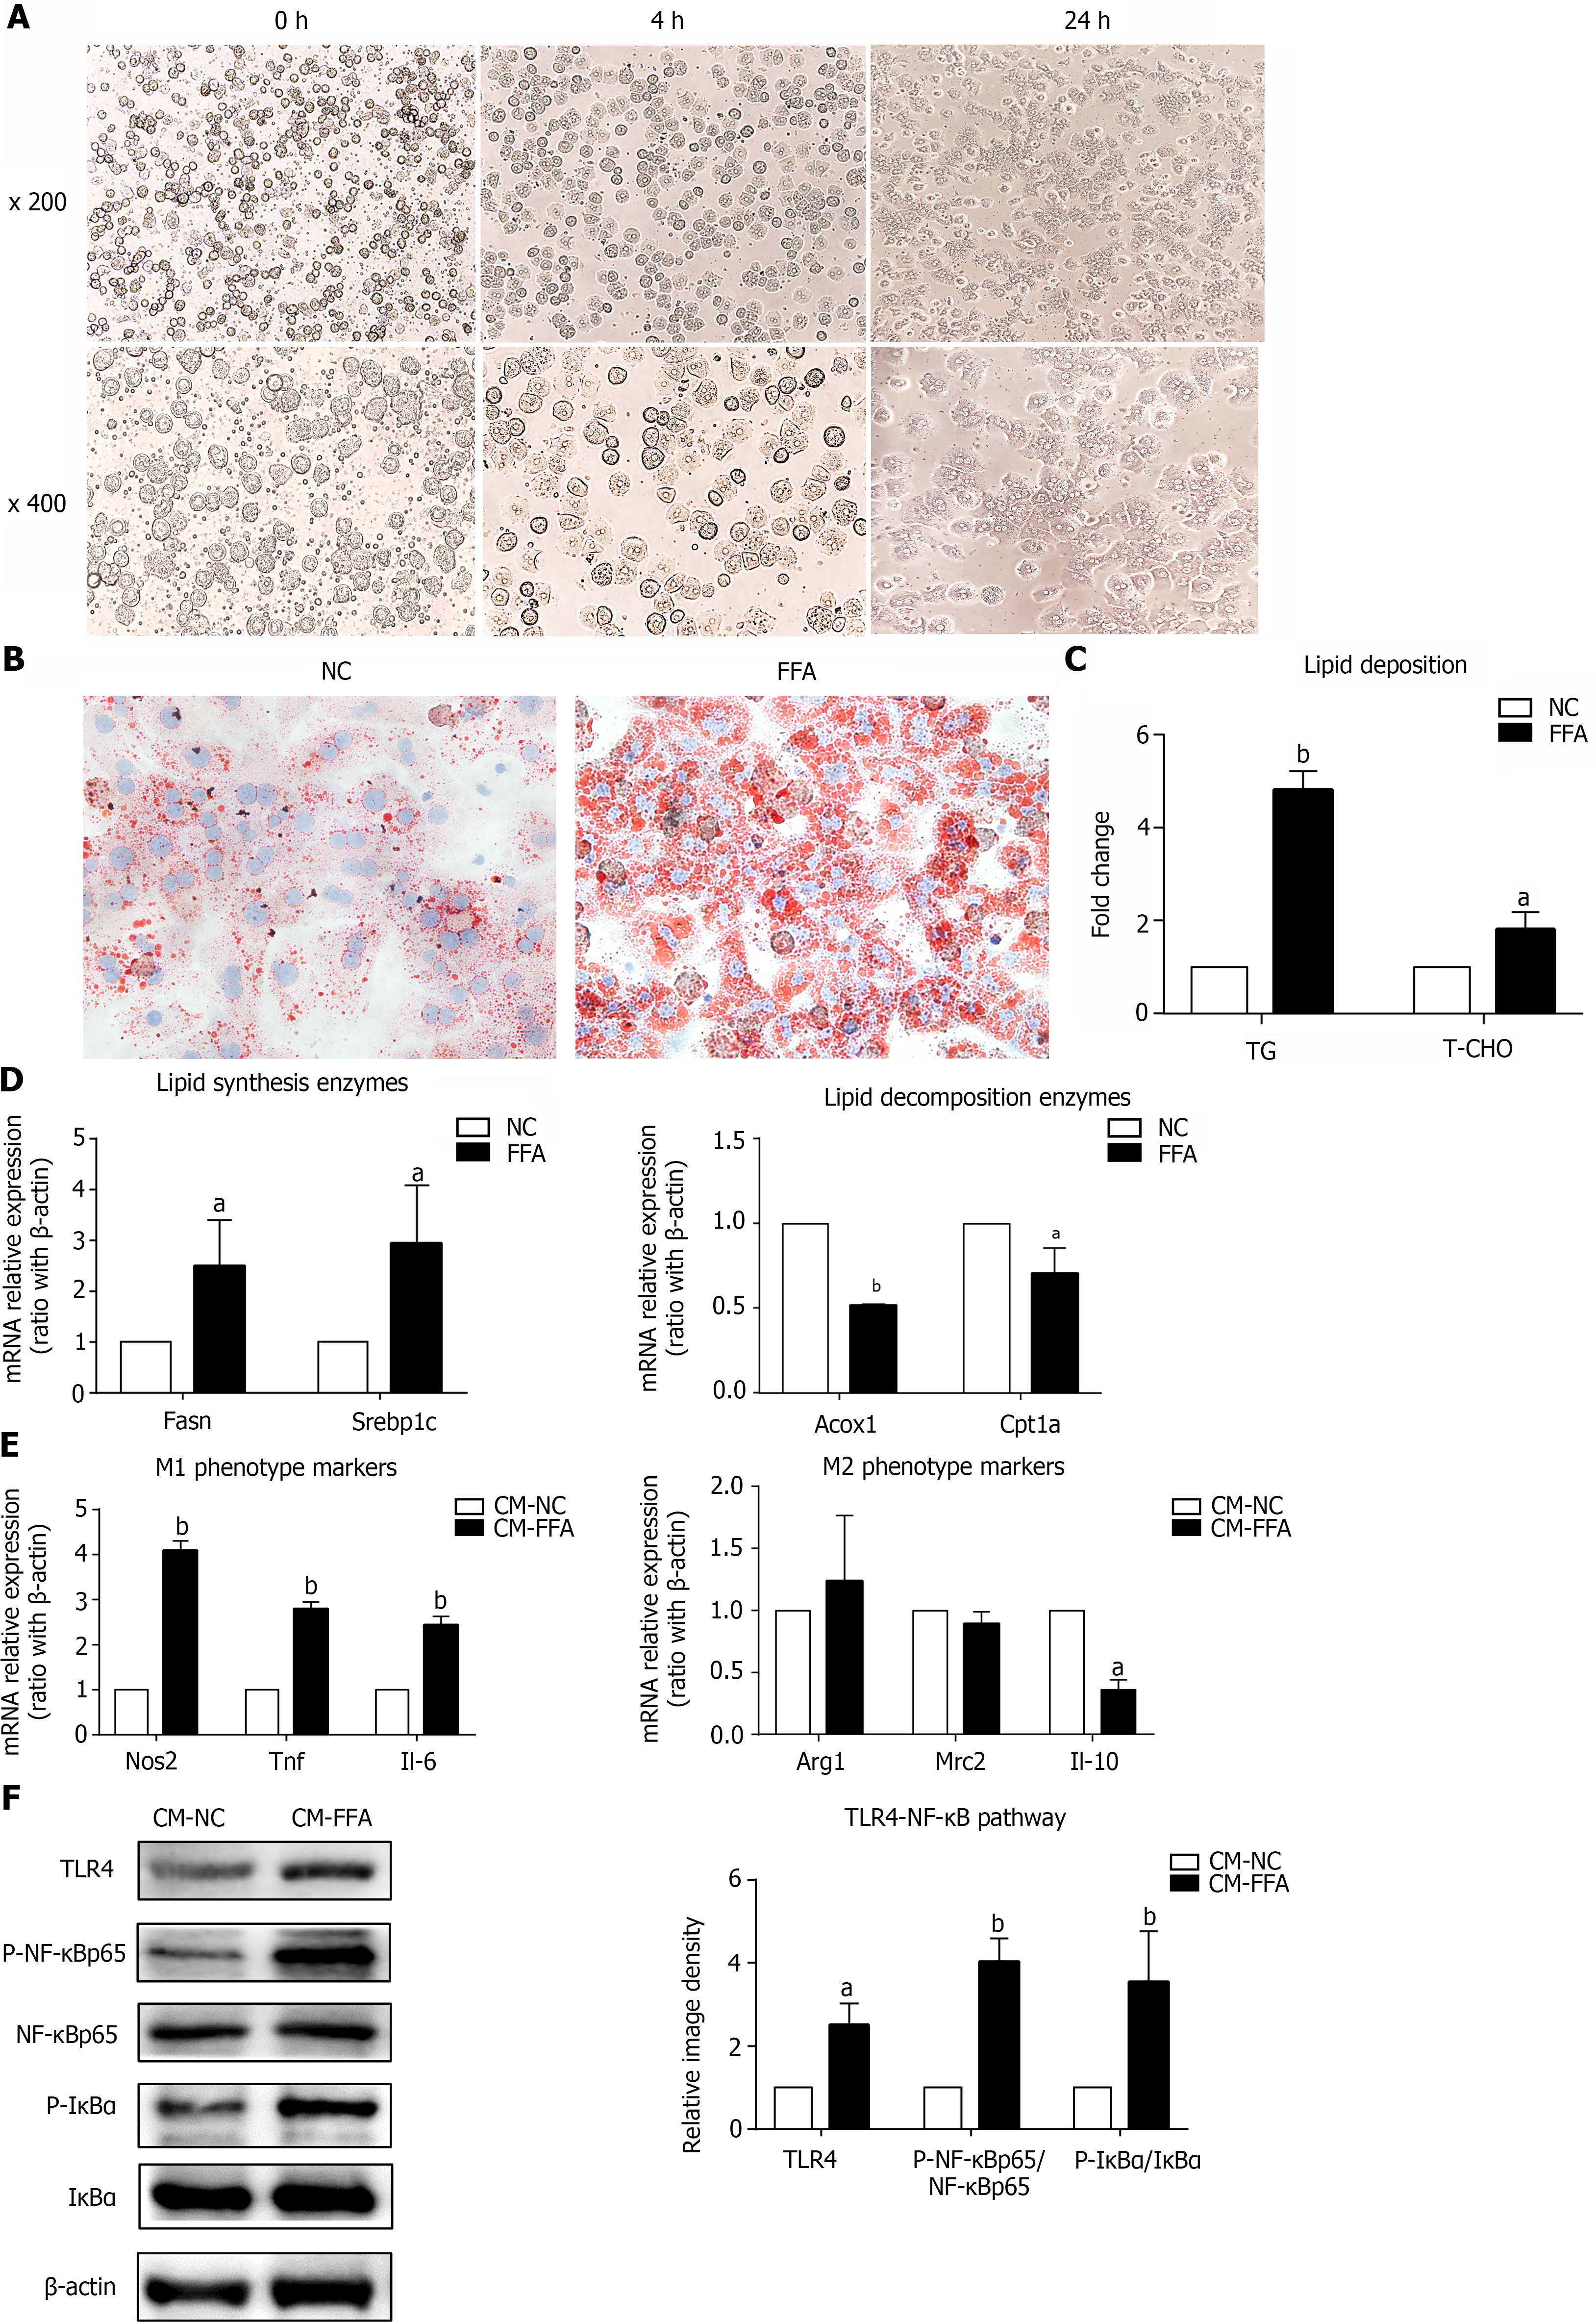
Figure 1 Lipid-laden primary hepatocytes have direct effects on macrophage M1/M2 polarization and inflammation.
Primary hepatocytes were incubated with free fatty acids for 24 h to induce the nonalcoholic fatty liver disease hepatocyte model. Cell culture supernatants of hepatocytes were collected and prepared for different conditioned mediums (CMs). RAW264.7 macrophages were treated with different CMs for 6 h for RT–PCR or 24 h for western blotting. A: Primary hepatocytes isolated by in situ perfusion of collagenase (inverted microscope, × 200, × 400); B: Lipid accumulation in hepatocytes measured by Oil Red O staining (× 400); C: Triglyceride and total cholesterol contents in primary hepatocytes; D: mRNA expression of lipid-related genes in primary hepatocytes; E: mRNA expression of M1/M2 markers in macrophages treated with CM; F: Protein expression of the TLR4/NF-κB pathway in macrophages treated with CM. Values are expressed as the mean ± SE of the mean, aP < 0.05, bP < 0.01 vs normal control (NC) or CM-NC, n = 3 experiments. NC: Normal control; CM: Conditioned medium; Fasn: Fatty acid synthase; Srebp1c: Sterol-regulatory element-binding protein 1C; Acox1: Acyl-CoA oxidase 1; Cpt1a: Carnitine palmitoyltransferase 1A; Nos: Nitric oxide synthase; Tnf: Tumor necrosis factor; Il: Interleukin; Arg1: Arginine-1; Mrc2: Mannose receptor 2; TLR4: Toll-like receptor 4; NF-κB: Nuclear factor kappa-B; IκBα: Inhibitor of nuclear factor kappa-B.
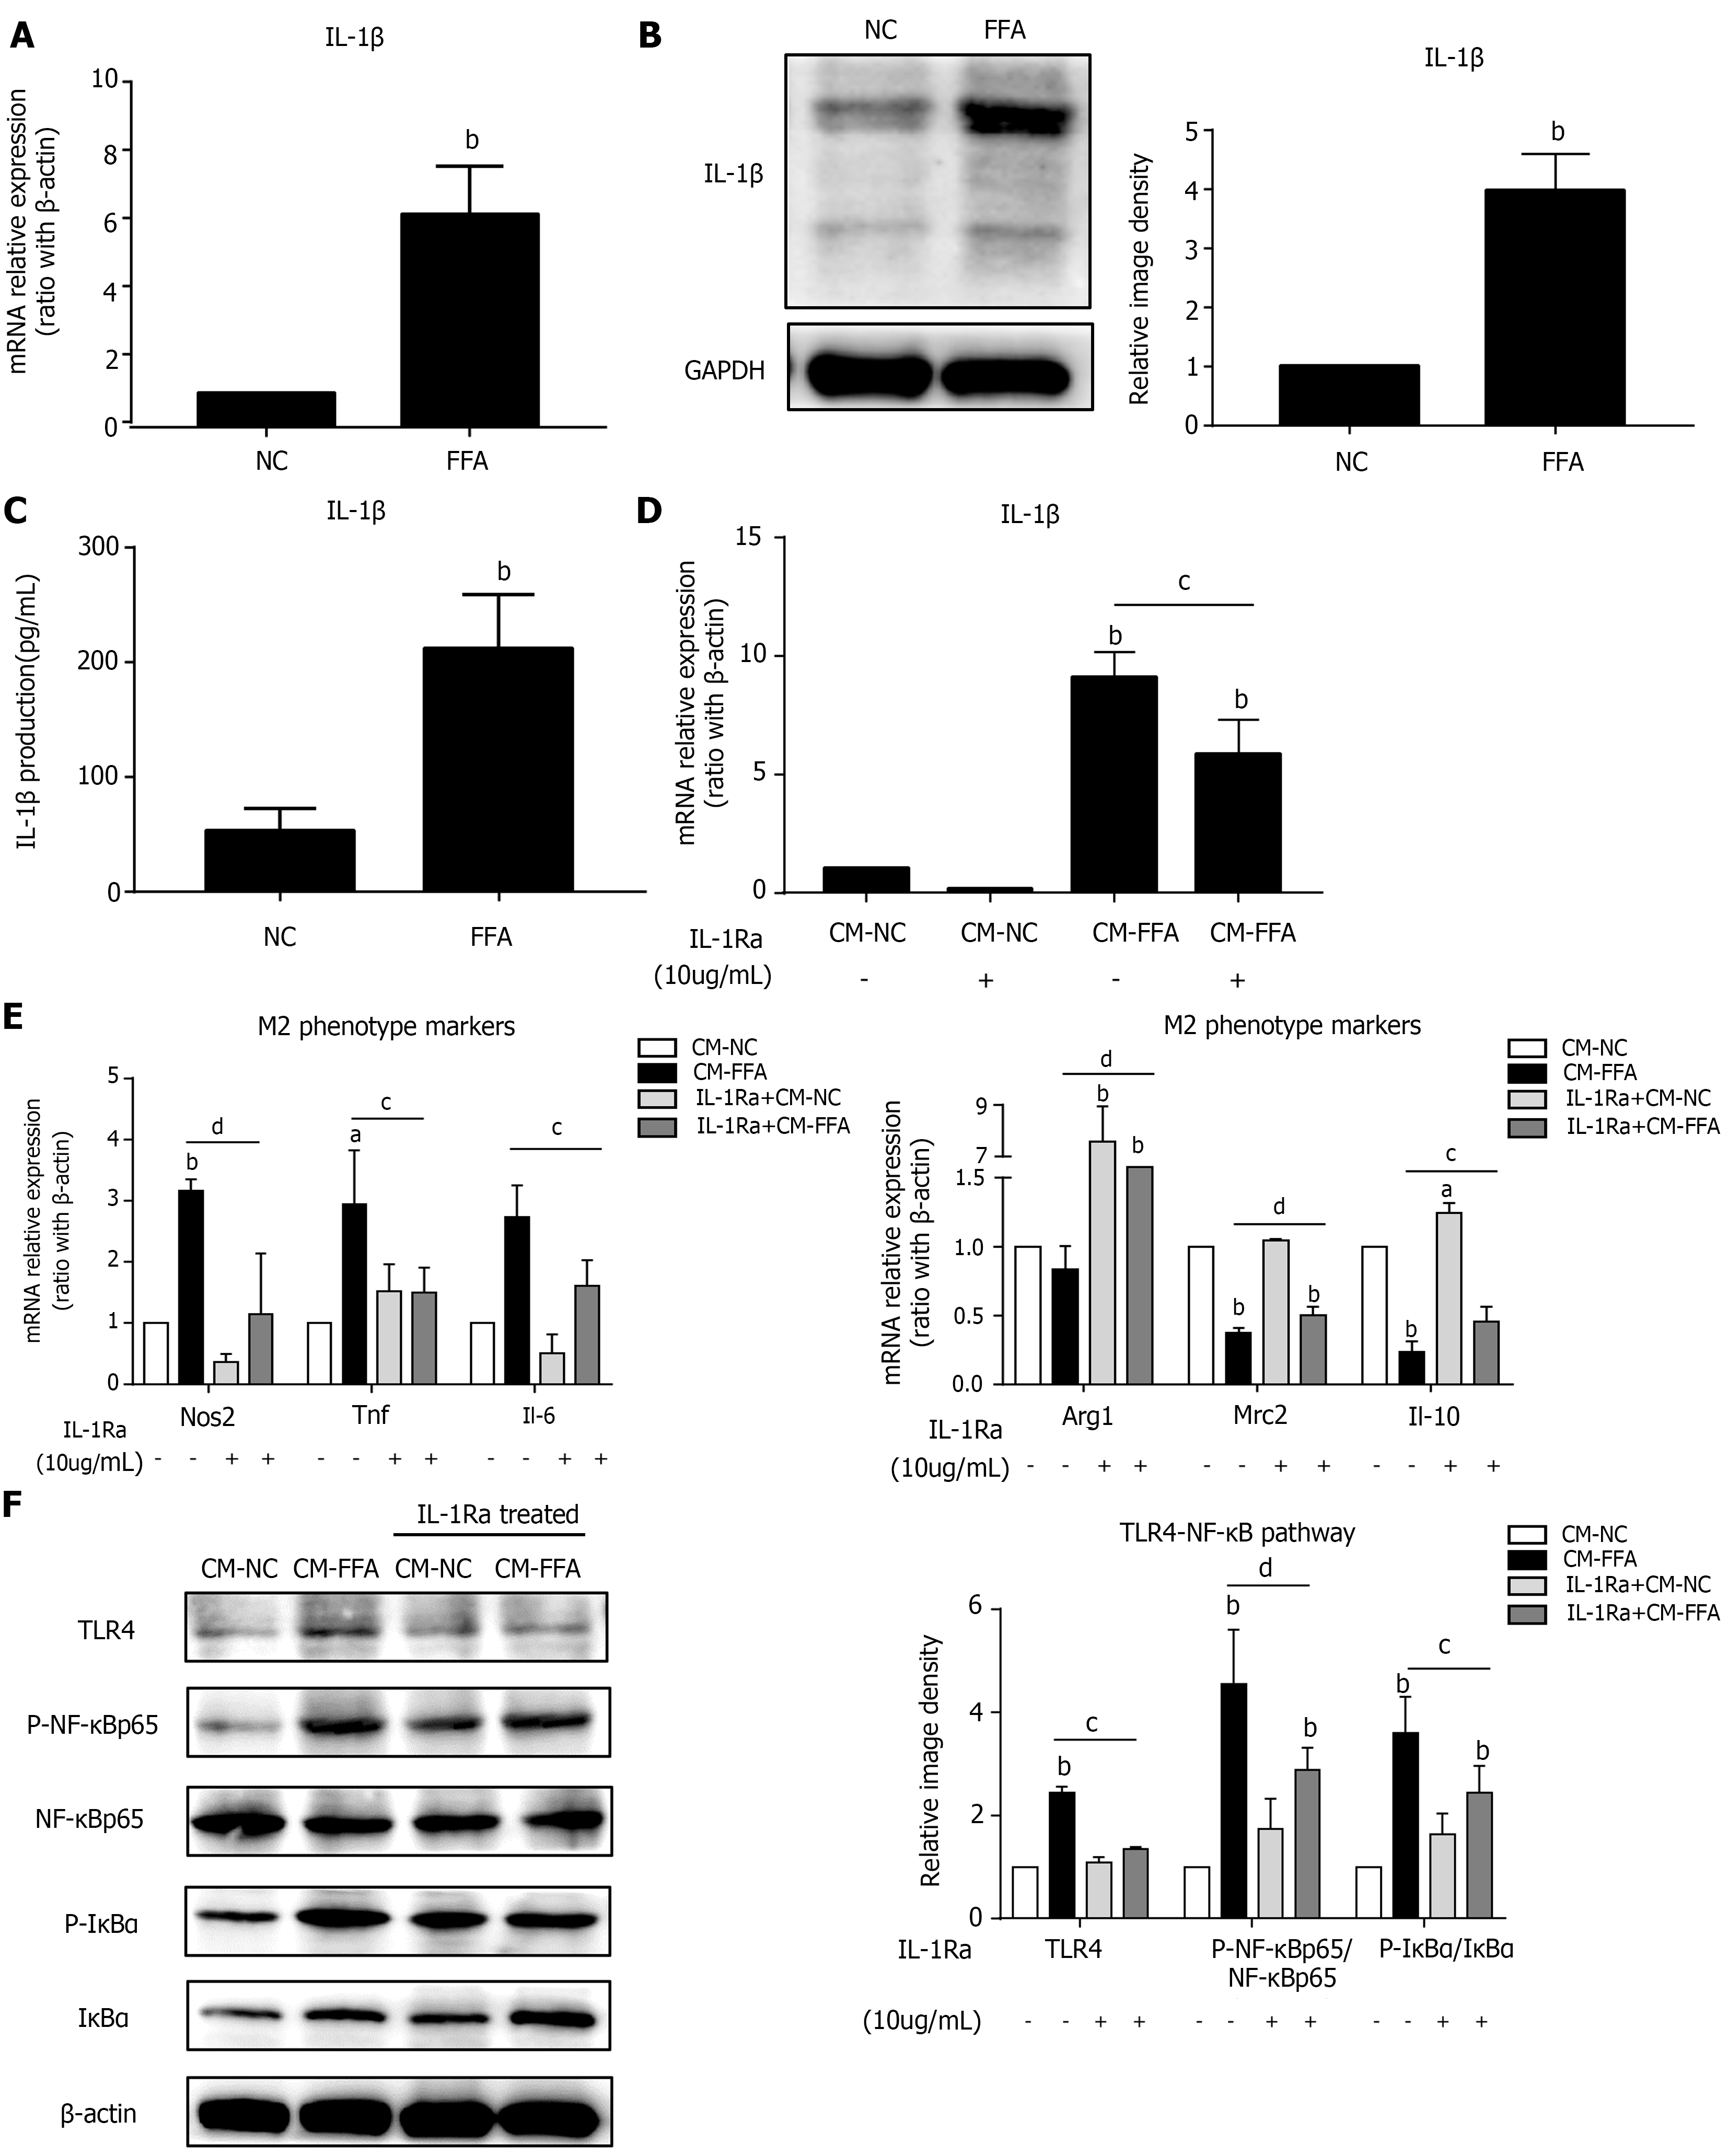
Figure 2 Lipid-laden hepatocytes induce macrophage M1 polarization and inflammation via IL-1β signaling.
Primary hepatocytes were incubated with free fatty acids for 6 h for RT–PCR or 24 h for western blot and ELISA. Cell culture supernatants of hepatocytes were collected and prepared for different conditioned mediums (CMs). RAW264.7 macrophages were pretreated with interleukin-1 receptor antagonist and treated with different CMs for 6 h for RT–PCR or 24 h for western blotting. A: mRNA expression of Il-1β in primary hepatocytes; B: Protein expression of IL-1β in primary hepatocytes; C: IL-1β production in the hepatocyte culture supernatant; D: mRNA expression of Il-1β in macrophages; E: mRNA expression of M1/M2 markers in macrophages; F: Protein expression of the TLR4/NF-κB pathway in macrophages. Values are expressed as the mean ± SE of the mean, aP < 0.05, bP < 0.01 vs normal control (NC) or CM-NC; cP < 0.05, dP < 0.01 comparison of the designated two groups, n = 3 experiments. NC: Normal control; CM: Conditioned medium; GAPDH: Glyceraldehyde-3-phosphate dehydrogenase; IL-1Ra: Interleukin-1 receptor antagonist; Nos: Nitric oxide synthase; Tnf: Tumor necrosis factor; Il: Interleukin; Arg1: Arginine-1; Mrc2: Mannose receptor 2; TLR4: Toll-like receptor 4; NF-κB: Nuclear factor kappa-B; IκBα: Inhibitor of nuclear factor kappa-B.
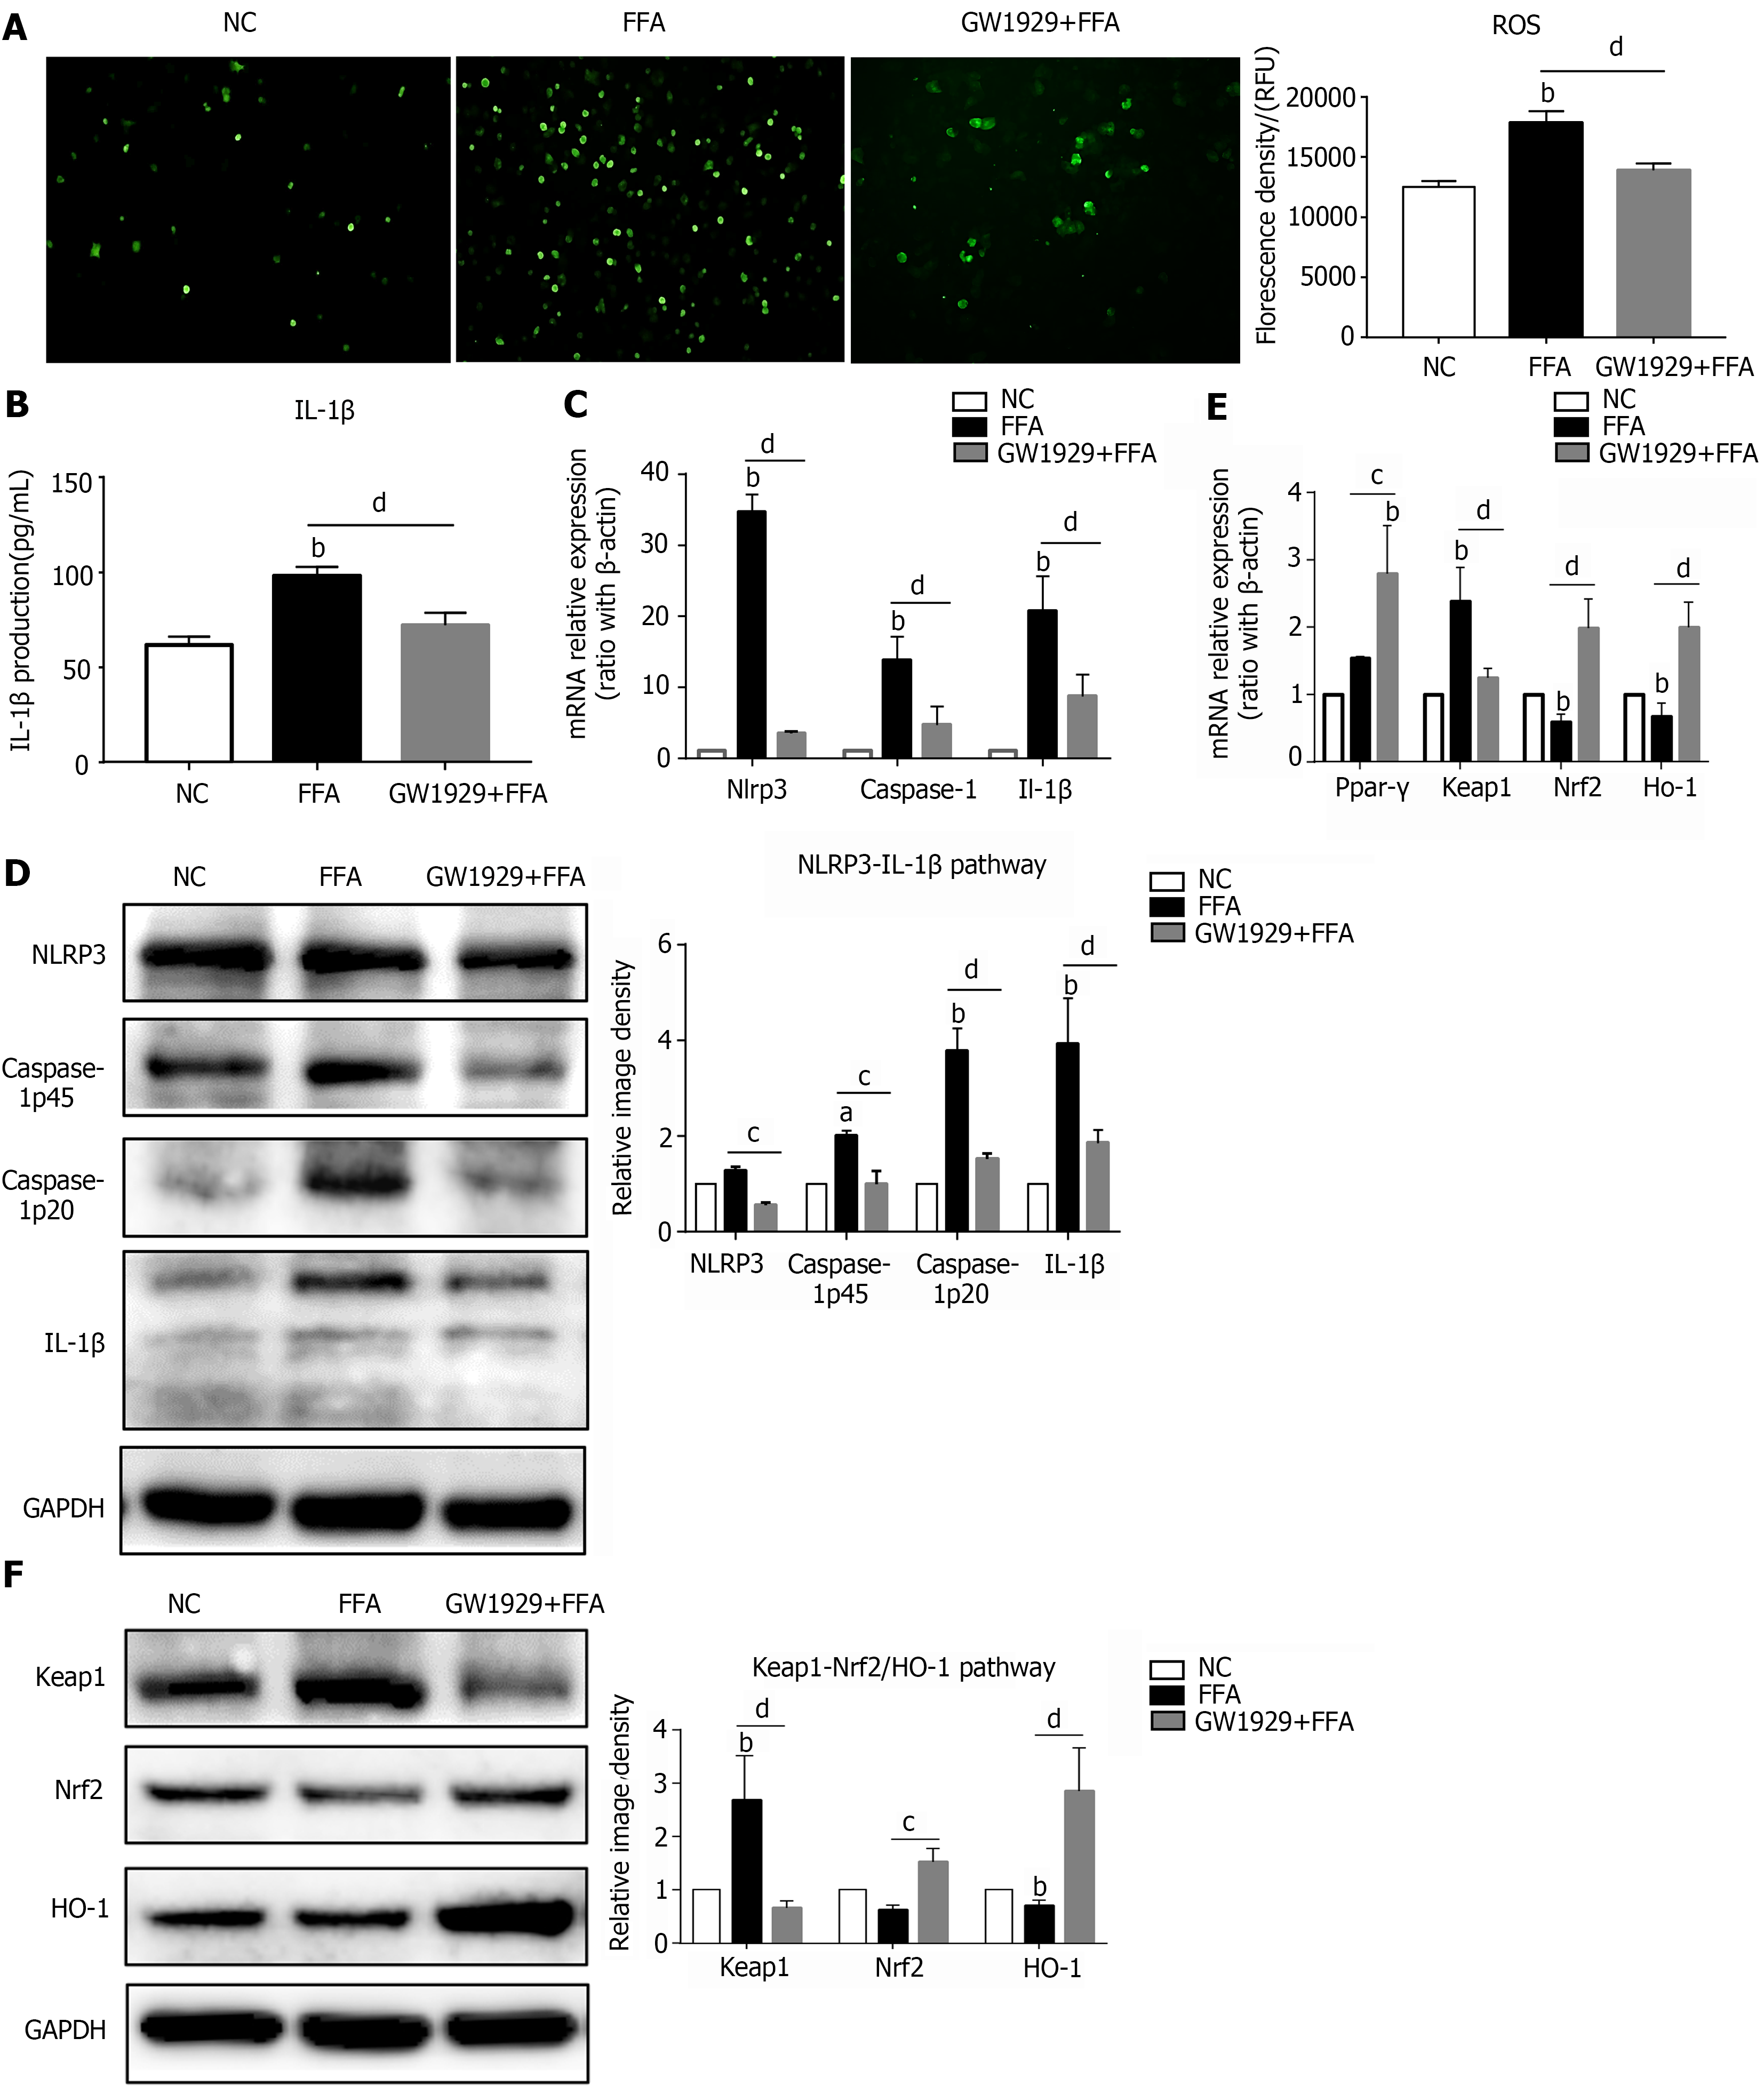
Figure 3 Upregulating PPAR-γ activity ameliorates oxidative stress and NLRP3 inflammasome activation in lipid-laden hepatocytes.
Primary hepatocytes were preincubated with the PPAR-γ agonist GW1929 for 3 h, followed by treatment with free fatty acids for 6 h for RT–PCR or 24 h for western blot and reactive oxygen species (ROS) detection. A: ROS production in primary hepatocytes; B: IL-1β production in the hepatocyte culture supernatant; C: mRNA expression of NLRP3 inflammasome-related genes in hepatocytes; D: Protein expression of NLRP3 inflammasome-related genes in hepatocytes; E: mRNA expression of Ppar-γ and oxidative stress-related genes in hepatocytes; F: Protein expression of oxidative stress-related genes in hepatocytes. Values are expressed as the mean ± SE of the mean, aP < 0.05, bP < 0.01 vs normal control; cP < 0.05, dP < 0.01 comparison of the designated two groups, n = 3 experiments. NC: Normal control; ROS: Reactive oxygen species; GAPDH: Glyceraldehyde-3-phosphate dehydrogenase; IL: Interleukin; Keap1: Kelch-like ECH-associated protein 1; Nrf2: NF-E2-related factor 2; Ho-1: Heme oxygenase-1; Nlrp3: NLR family pyrin domain-containing 3; Caspase-1: Cysteinyl aspartate-specific proteinase-1; Ppar-γ: Peroxisome proliferators-activated receptor-γ.
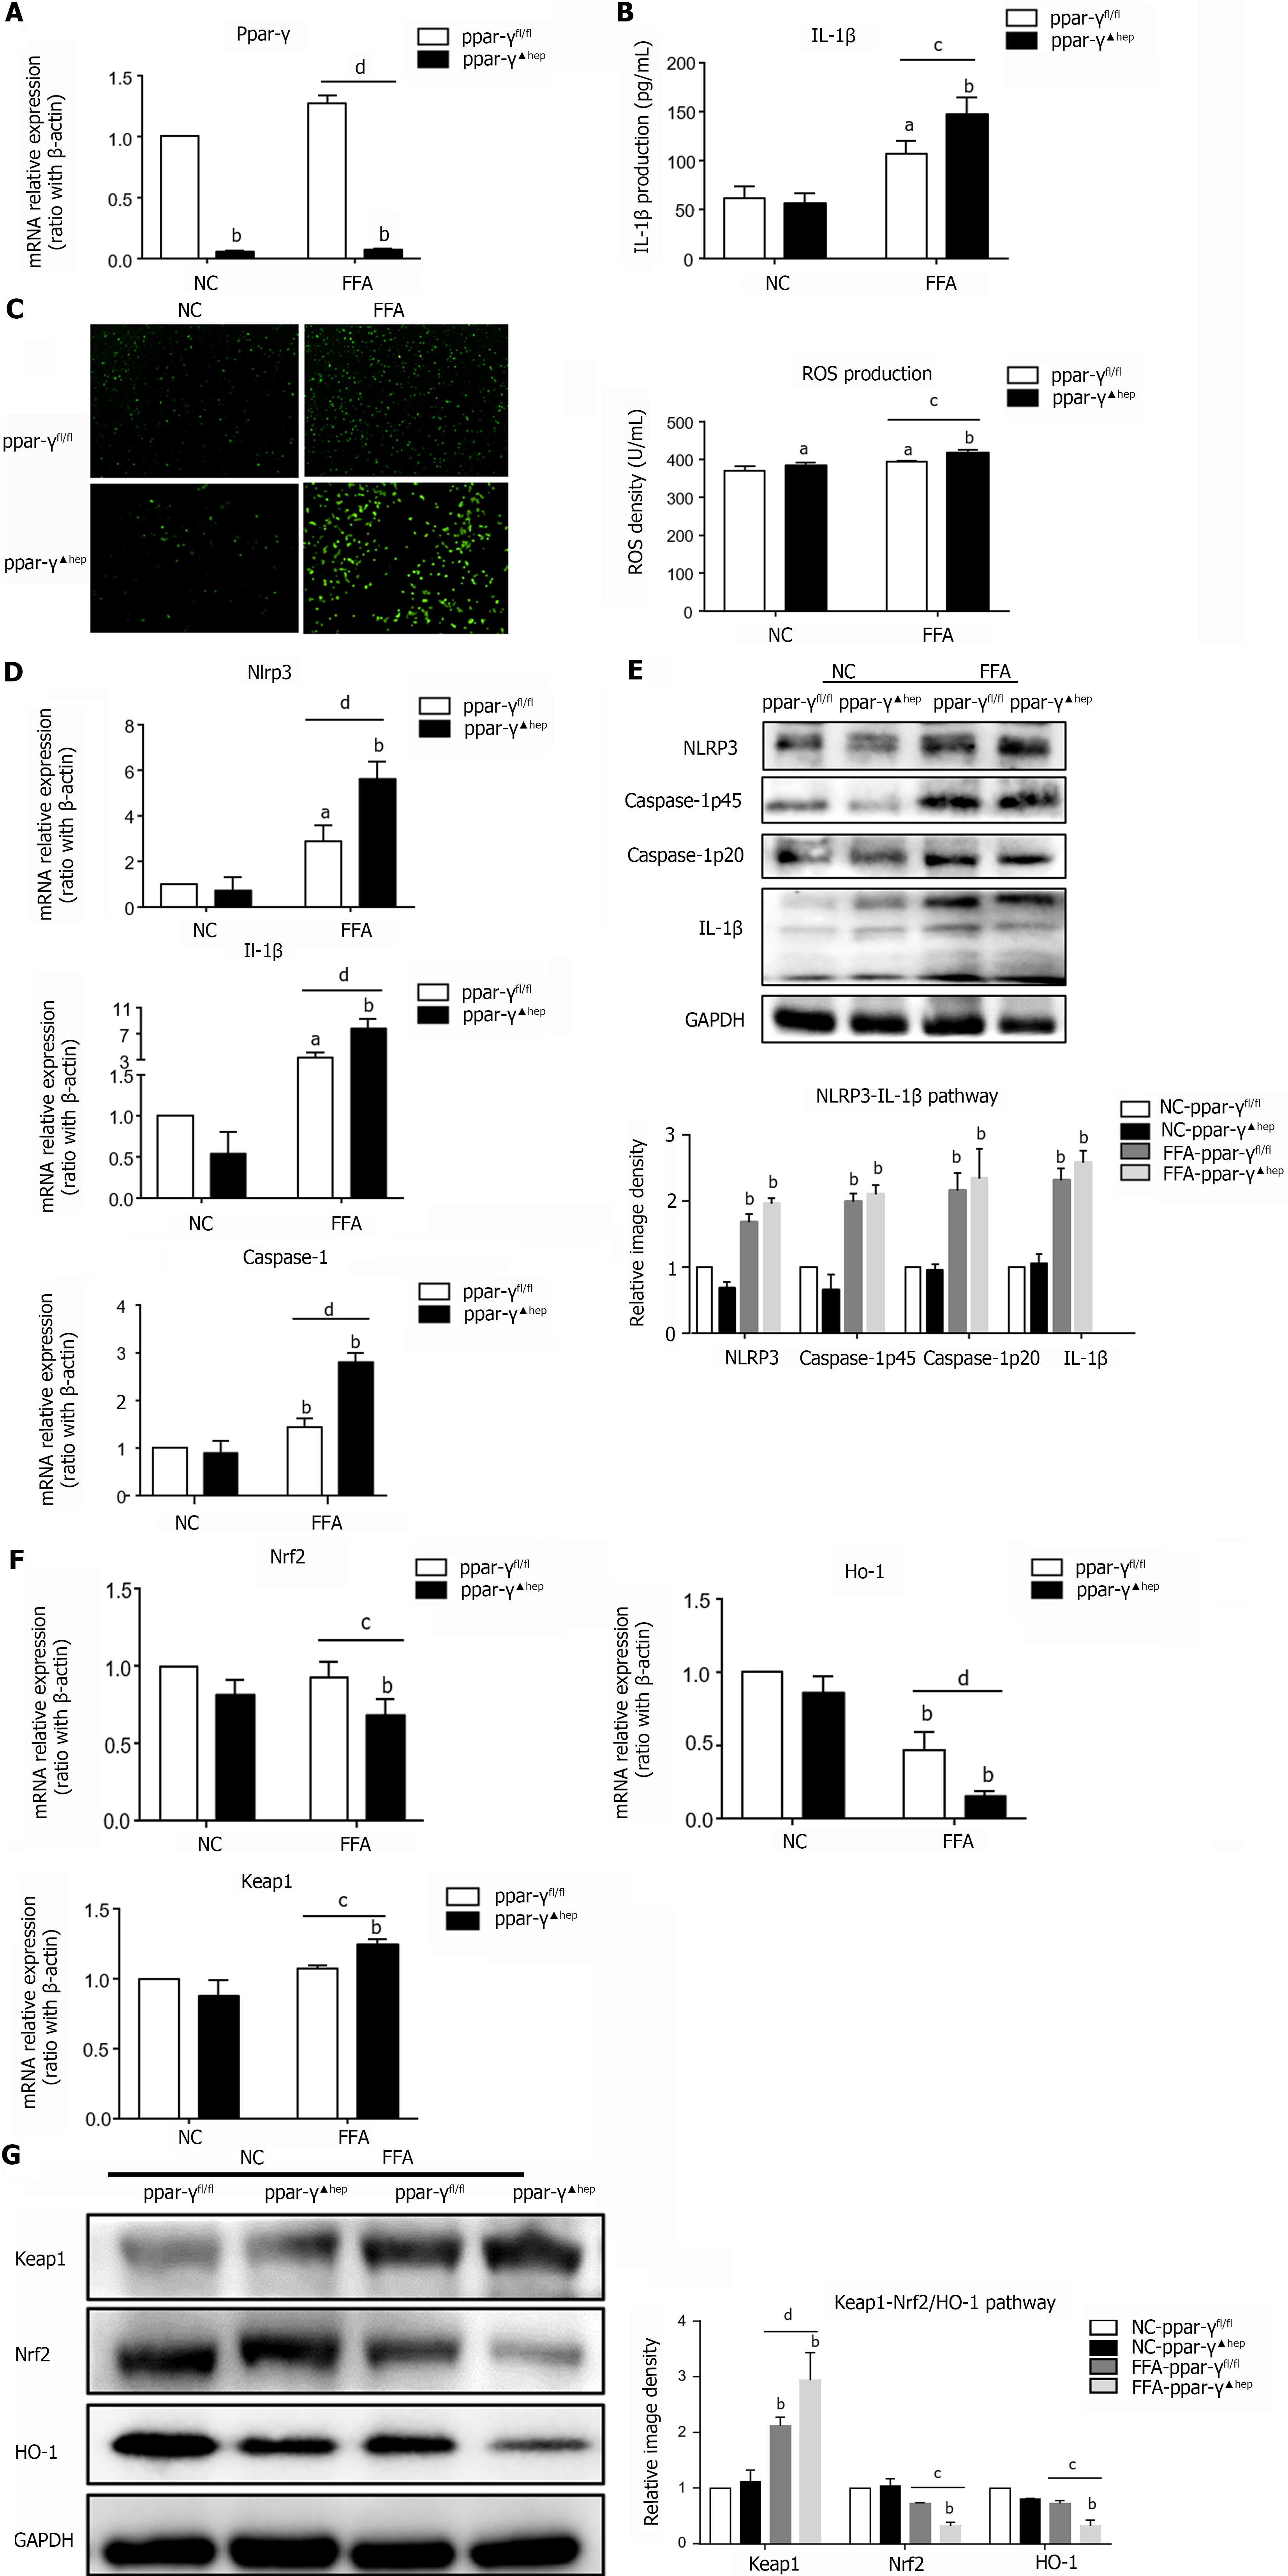
Figure 4 Hepatocyte-specific PPAR-γ knockout aggravates oxidative stress and NLRP3 inflammasome activation in lipid-laden hepatocytes.
Primary hepatocytes were isolated from PPAR-γfl/fl and PPAR-γ▲hep mice and treated with free fatty acids for 6 h for RT–PCR or 24 h for western blot, ELISA and reactive oxygen species (ROS) detection. A: mRNA expression of Ppar-γ in PPAR-γ-deficient hepatocytes; B: IL-1β production in PPAR-γ-deficient hepatocyte culture supernatant; C: ROS production in PPAR-γ deficiency hepatocytes; D: mRNA expression of NLRP3 inflammasome-related genes in PPAR-γ-deficient hepatocytes; E: Protein expression of NLRP3 inflammasome-related genes in PPAR-γ-deficient hepatocytes; F: mRNA expression of oxidative stress-related genes in PPAR-γ-deficient hepatocytes; G: Protein expression of oxidative stress-related genes in PPAR-γ-deficient hepatocytes. Values are expressed as the mean ± SE of the mean, aP < 0.05, bP < 0.01 vs ppar-γfl/fl or normal control-ppar-γfl/fl; cP < 0.05, dP < 0.01 comparison of the designated two groups, n = 3 experiments. NC: Normal control; ROS: Reactive oxygen species; GAPDH: Glyceraldehyde-3-phosphate dehydrogenase; Keap1: Kelch-like ECH-associated protein 1; Nrf2: NF-E2-related factor 2; Ho-1: Heme oxygenase-1; Nlrp3: NLR family pyrin domain-containing 3; Caspase-1: Cysteinyl aspartate-specific proteinase-1; Ppar-γ: Peroxisome proliferators-activated receptor-γ; IL: Interleukin.
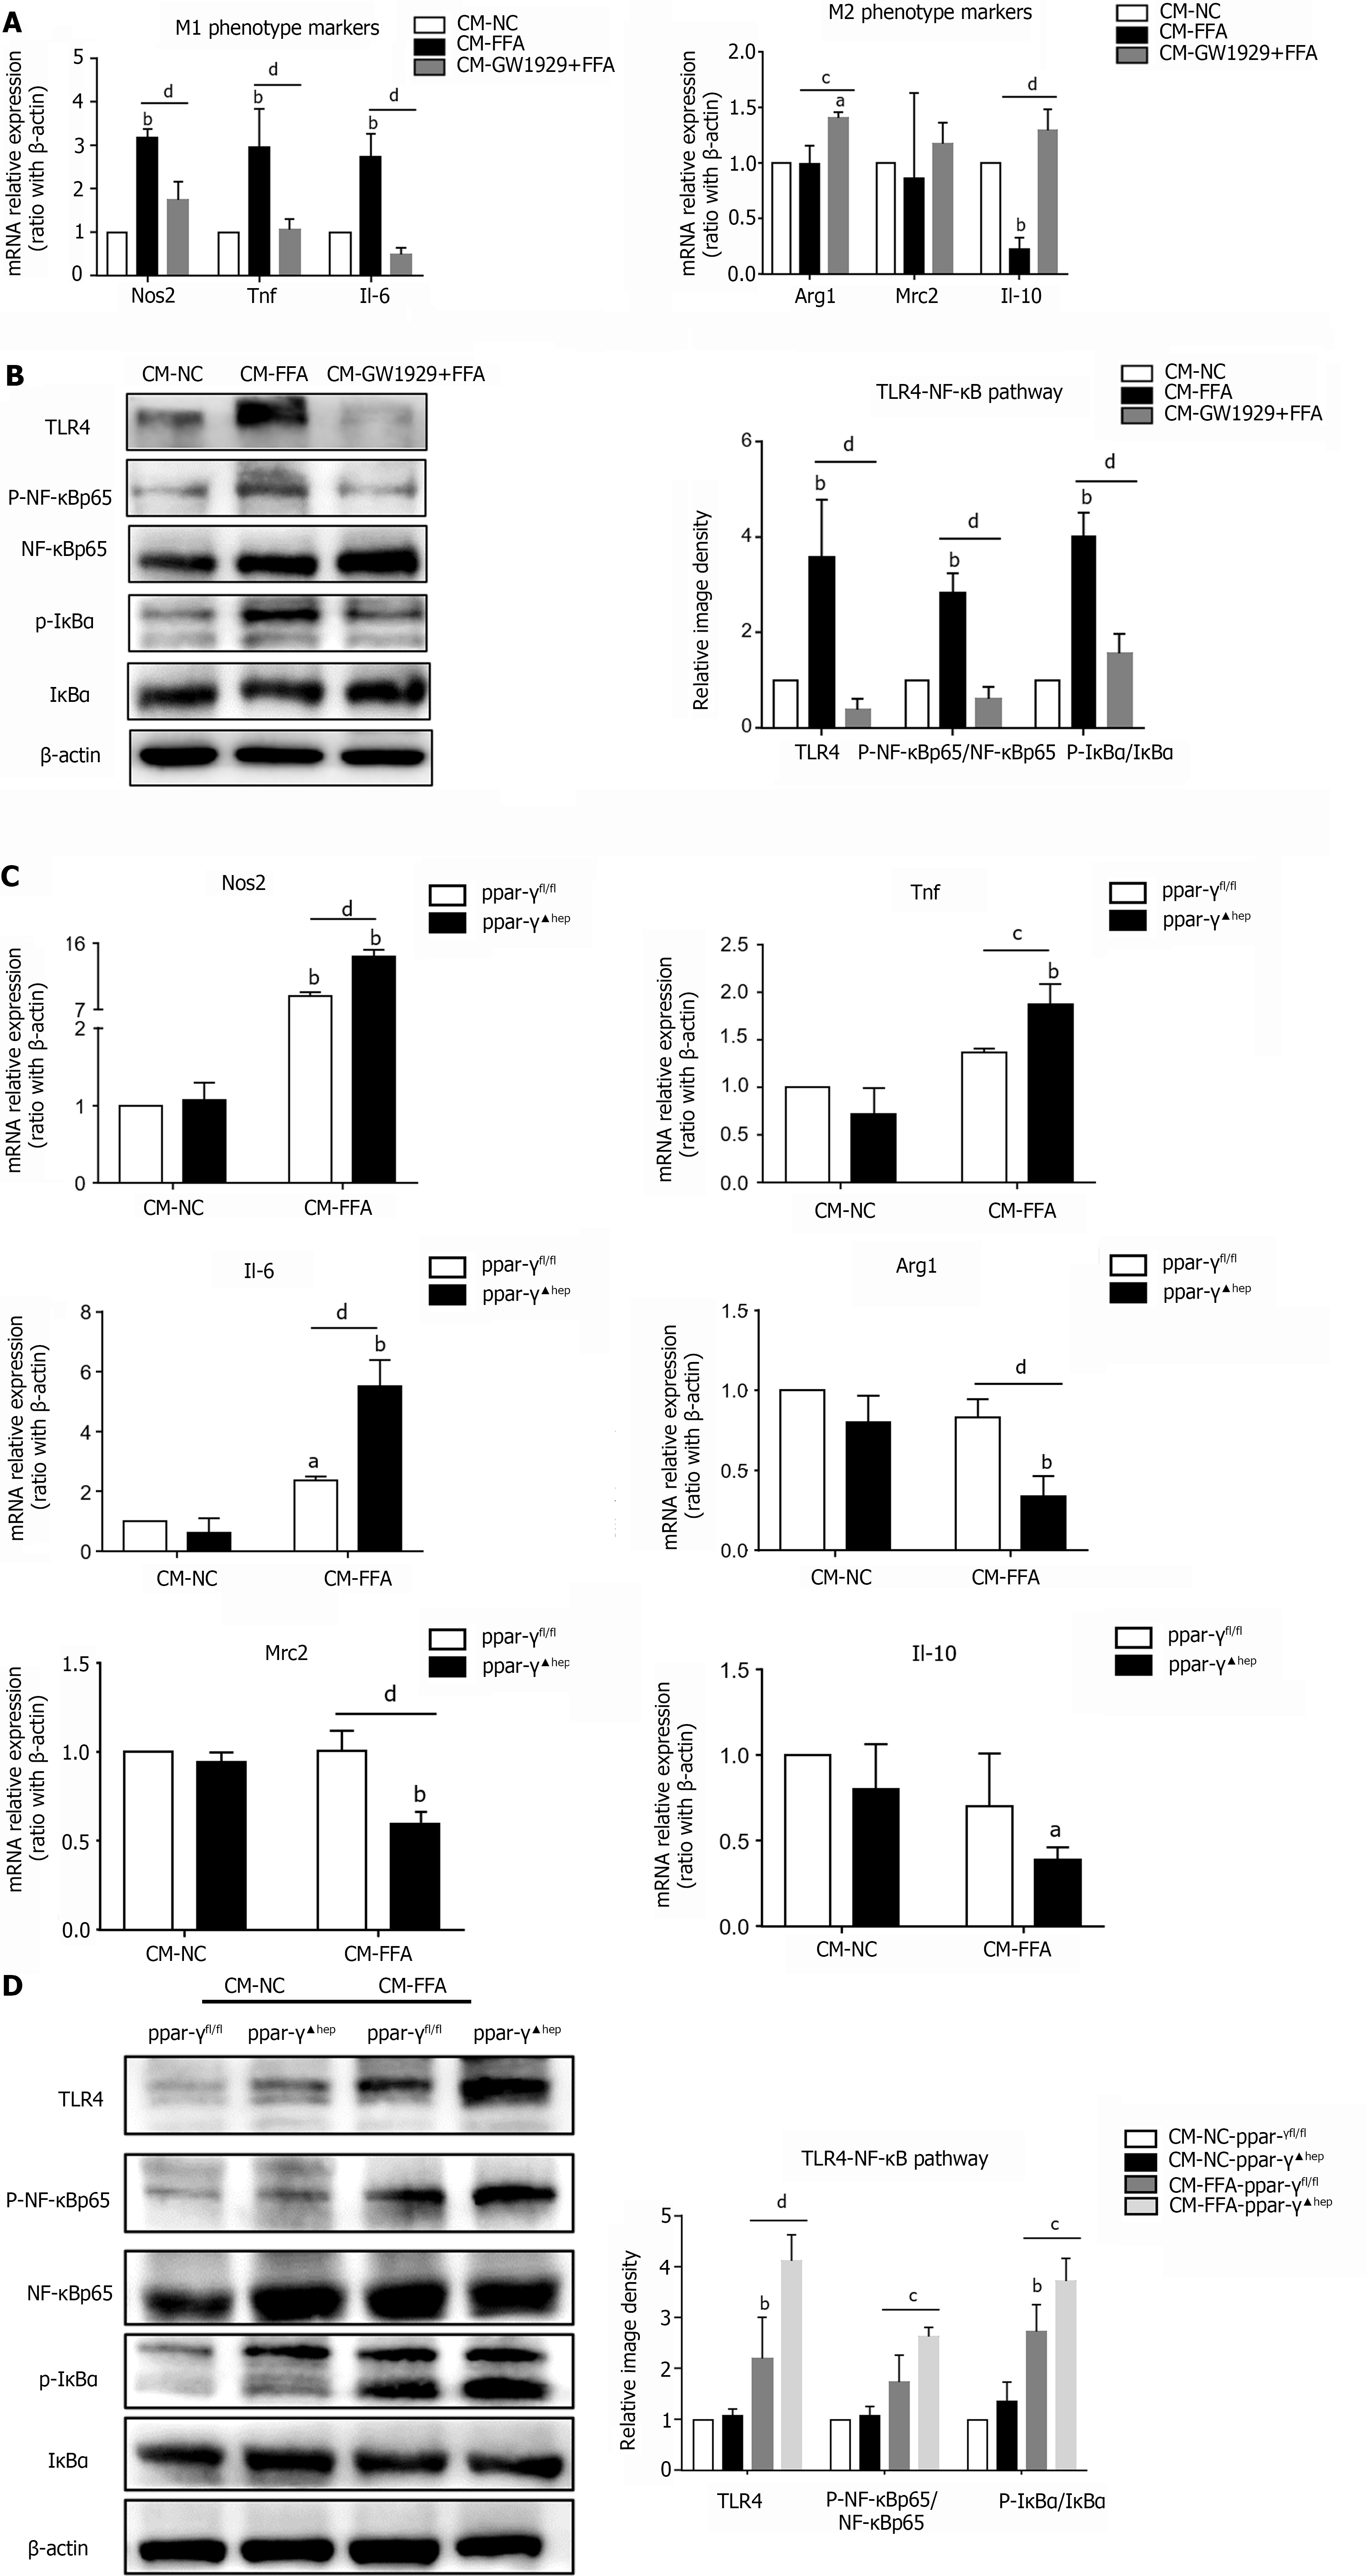
Figure 5 Regulation of PPAR-γ activity in lipid-laden hepatocytes affects macrophage polarization and inflammation.
Primary hepatocytes were preincubated with the PPAR-γ agonist GW1929 for 3 h, followed by treatment with free fatty acids (FFAs) for 24 h (GW1929+FFA). Primary hepatocytes were isolated from PPAR-γfl/fl and PPAR-γ▲hep mice and treated with FFA for 24 h. Cell culture supernatants of hepatocytes were collected and prepared for different conditioned mediums (CMs). Macrophages were treated with different CMs for 6 h for RT–PCR or 24 h for western blotting. A: mRNA expression of M1/M2 markers in macrophages treated with CM; B: Protein expression of the TLR4/NF-κB pathway in macrophages treated with CM; C: mRNA expression of M1/M2 markers in macrophages treated with CM from PPAR-γ knockout hepatocytes; D: Protein expression of the TLR4/NF-κB pathway in macrophages treated with CM from PPAR-γ knockout hepatocytes. Values are expressed as the mean ± SE of the mean, aP < 0.05, bP < 0.01 vs CM- normal control (NC) or CM-NC-ppar-γfl/fl; cP < 0.05, dP < 0.01 comparison of the designated two groups, n = 3 experiments. NC: Normal control; CM: Conditioned medium; Nos: Nitric oxide synthase; Tnf: Tumor necrosis factor; Il: Interleukin; Arg1: Arginine-1; Mrc2: Mannose receptor 2; TLR4: Toll-like receptor 4; NF-κB: Nuclear factor kappa-B; IκBα: Inhibitor of nuclear factor kappa-B.
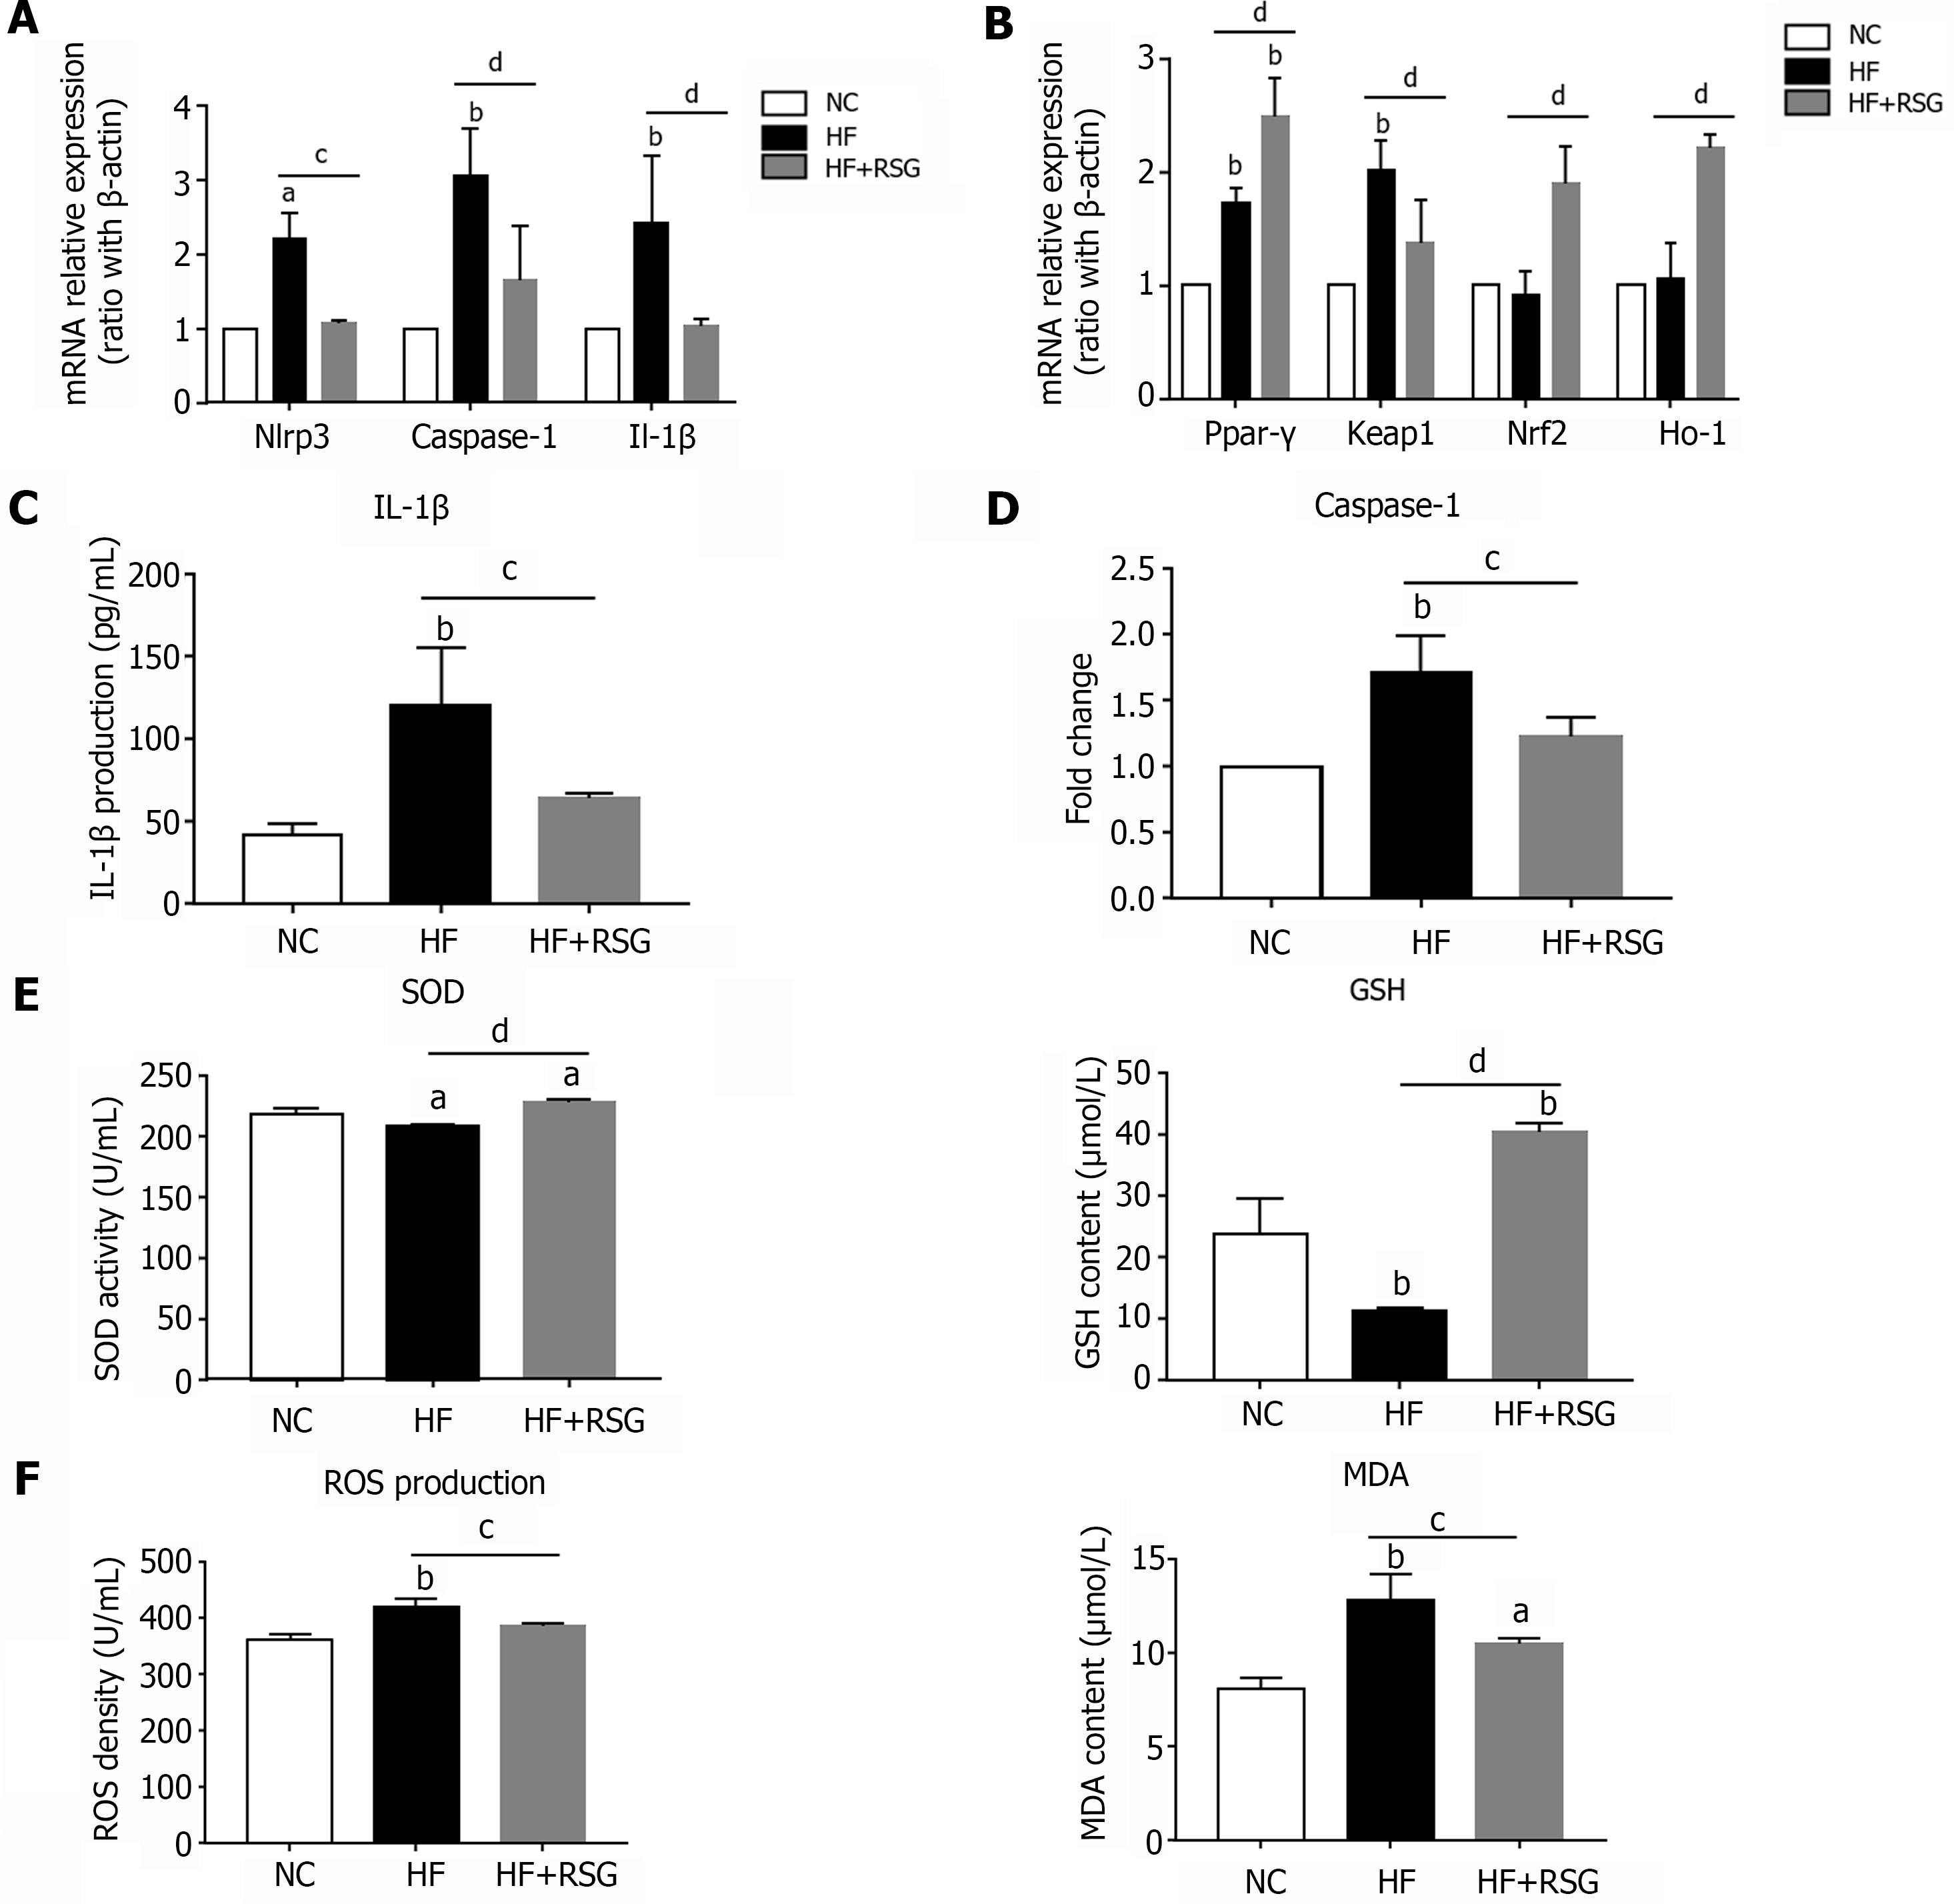
Figure 6 Rosiglitazone improved NLRP3 inflammasome activation and oxidative stress in high-fat diet-induced nonalcoholic fatty liver disease mice.
Wild-type C57BL/6 mice were fed either an normal control diet or an high-fat diet for 16 wk. Rosiglitazone was administered by oral gavage once daily for 28 consecutive days after 12 wk of HF diet feeding. A: mRNA expression of NLRP3 inflammasome-related genes in the bulk cells of liver; B: mRNA expression of Ppar-γ and oxidative stress-related genes in the liver; C: IL-1β Level in the plasma; D: Caspase-1 activity in the liver; E: SOD activity and GSH content in the plasma; F: ROS and MDA production in the plasma. Values are expressed as the mean ± SE of the mean, aP < 0.05, bP < 0.01 vs NC; cP < 0.05, dP < 0.01 comparison of the designated two groups, n = 10 animals per group. HF: High-fat; NC: Normal control; RSG: Rosiglitazone; Keap1: Kelch-like ECH-associated protein 1; Nrf2: NF-E2-related factor 2; Ho-1: Heme oxygenase-1; Nlrp3: NLR family pyrin domain-containing 3; Caspase-1: Cysteinyl aspartate-specific proteinase-1; Ppar-γ: Peroxisome proliferators-activated receptor-γ; IL: Interleukin; SOD: Superoxide dismutase; GSH: Glutathione; MDA: Malondialdehyde; ROS: Reactive oxygen species.
- Citation: Li XY, Ji PX, Ni XX, Chen YX, Sheng L, Lian M, Guo CJ, Hua J. Regulation of PPAR-γ activity in lipid-laden hepatocytes affects macrophage polarization and inflammation in nonalcoholic fatty liver disease. World J Hepatol 2022; 14(7): 1365-1381
- URL: https://www.wjgnet.com/1948-5182/full/v14/i7/1365.htm
- DOI: https://dx.doi.org/10.4254/wjh.v14.i7.1365


