Copyright
©The Author(s) 2022.
World J Hepatol. Apr 27, 2022; 14(4): 778-790
Published online Apr 27, 2022. doi: 10.4254/wjh.v14.i4.778
Published online Apr 27, 2022. doi: 10.4254/wjh.v14.i4.778
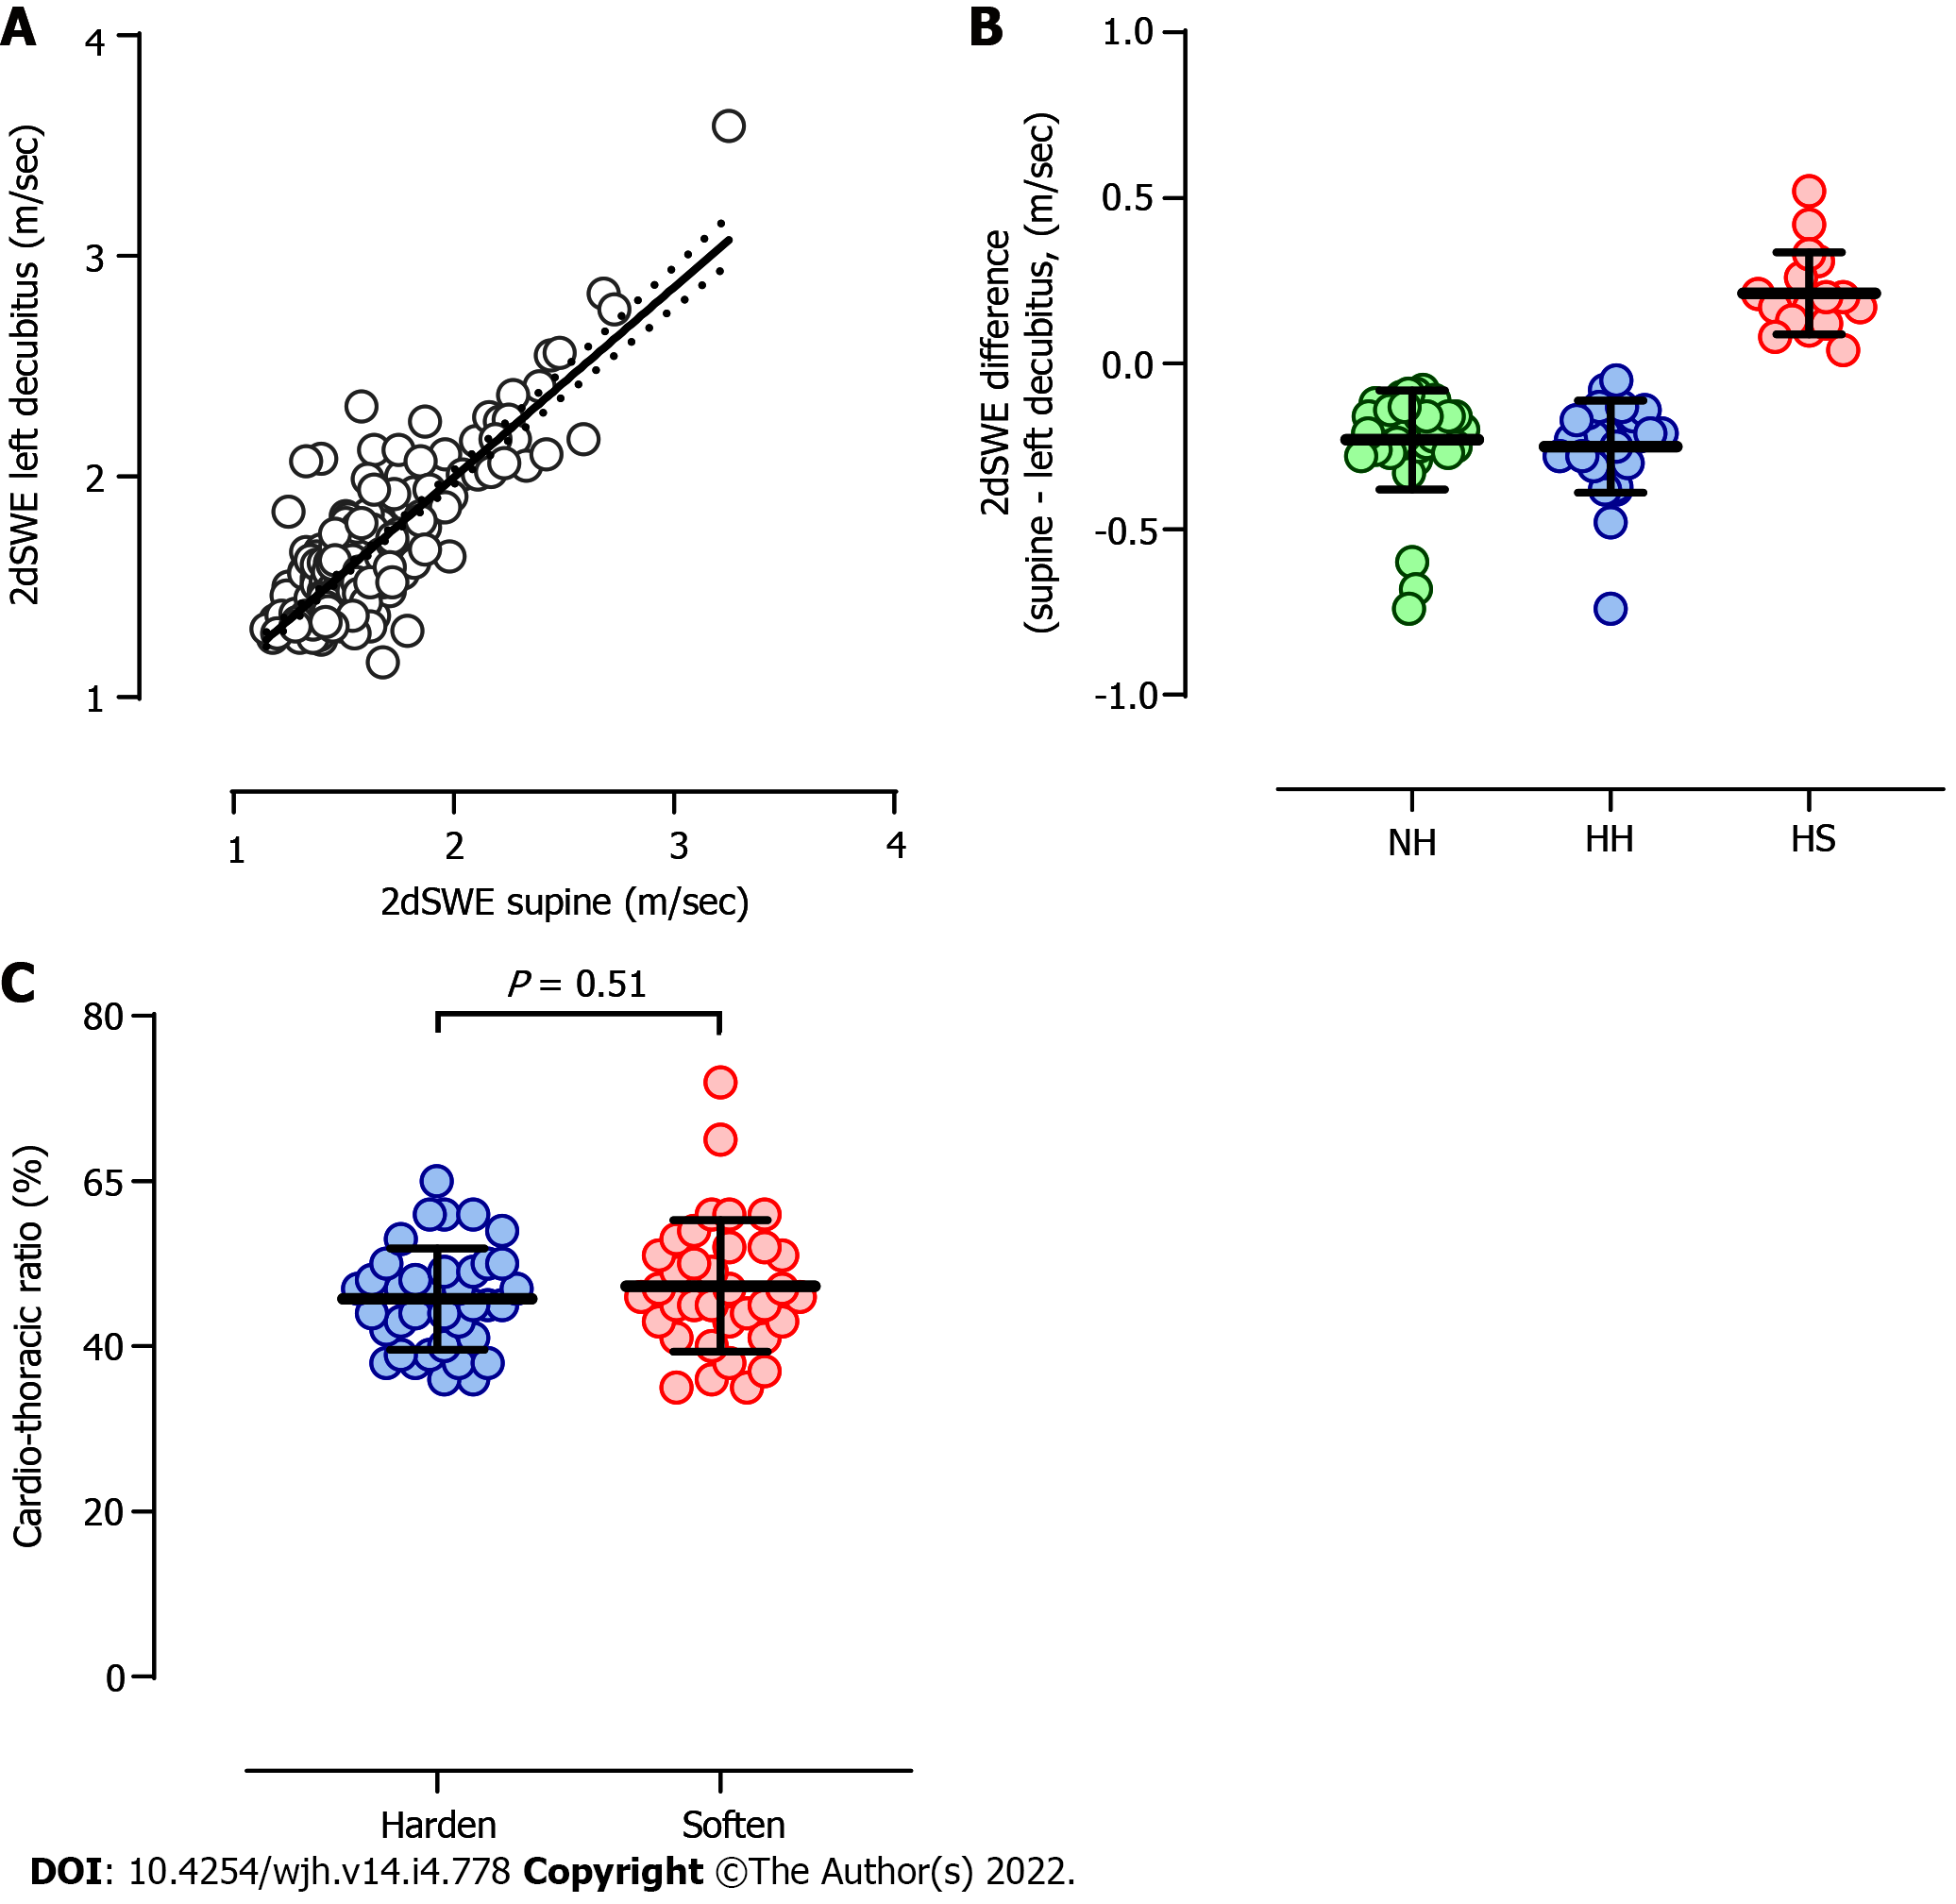
Figure 1 Body position effects on liver stiffness.
A: Two-dimensional shear wave elastography (2dSWE) values that were measured in the supine and left decubitus positions revealed a significant positive correlation (P < 0.0001, r = 0.68). The black continuous and dotted lines reveal the best hit and 95% confidence band in the equation of least squares; B: The cases in which 2dSWE increased or decreased in association with changing body positions beyond the magnitude of robust coefficient of variation can be classified into 3 groups: normal 2dSWE (Normal-to-Hard: NH) or abnormal 2dSWE that increased (Hard-to-Hard: HH) or decreased (Hard-to-Soft: HS) in the left decubitus position. The difference in 2dSWE between supine and left decubitus positions (supine - left decubitus) was negative in NH (-0.23 ± 0.15 m/sec) and HH (-0.25 ± 0.14 m/sec) but was positive in HS (0.21 ± 0.12 m/sec); C: The cardiothoracic ratio was not significantly different between the patients with abnormal 2dSWE in the supine position that further hardened or softened in the left decubitus position (P = 0.51, 47.3 ± 8.0 vs 45.7 ± 6.1%). The horizontal bars in B and C indicate the average (“Bold”) and standard deviation. 2dSWE: Two-dimensional shear wave elastography; HH: Hard-to-Hard; NH: Normal-to-Hard; HS: Hard-to-Soft.
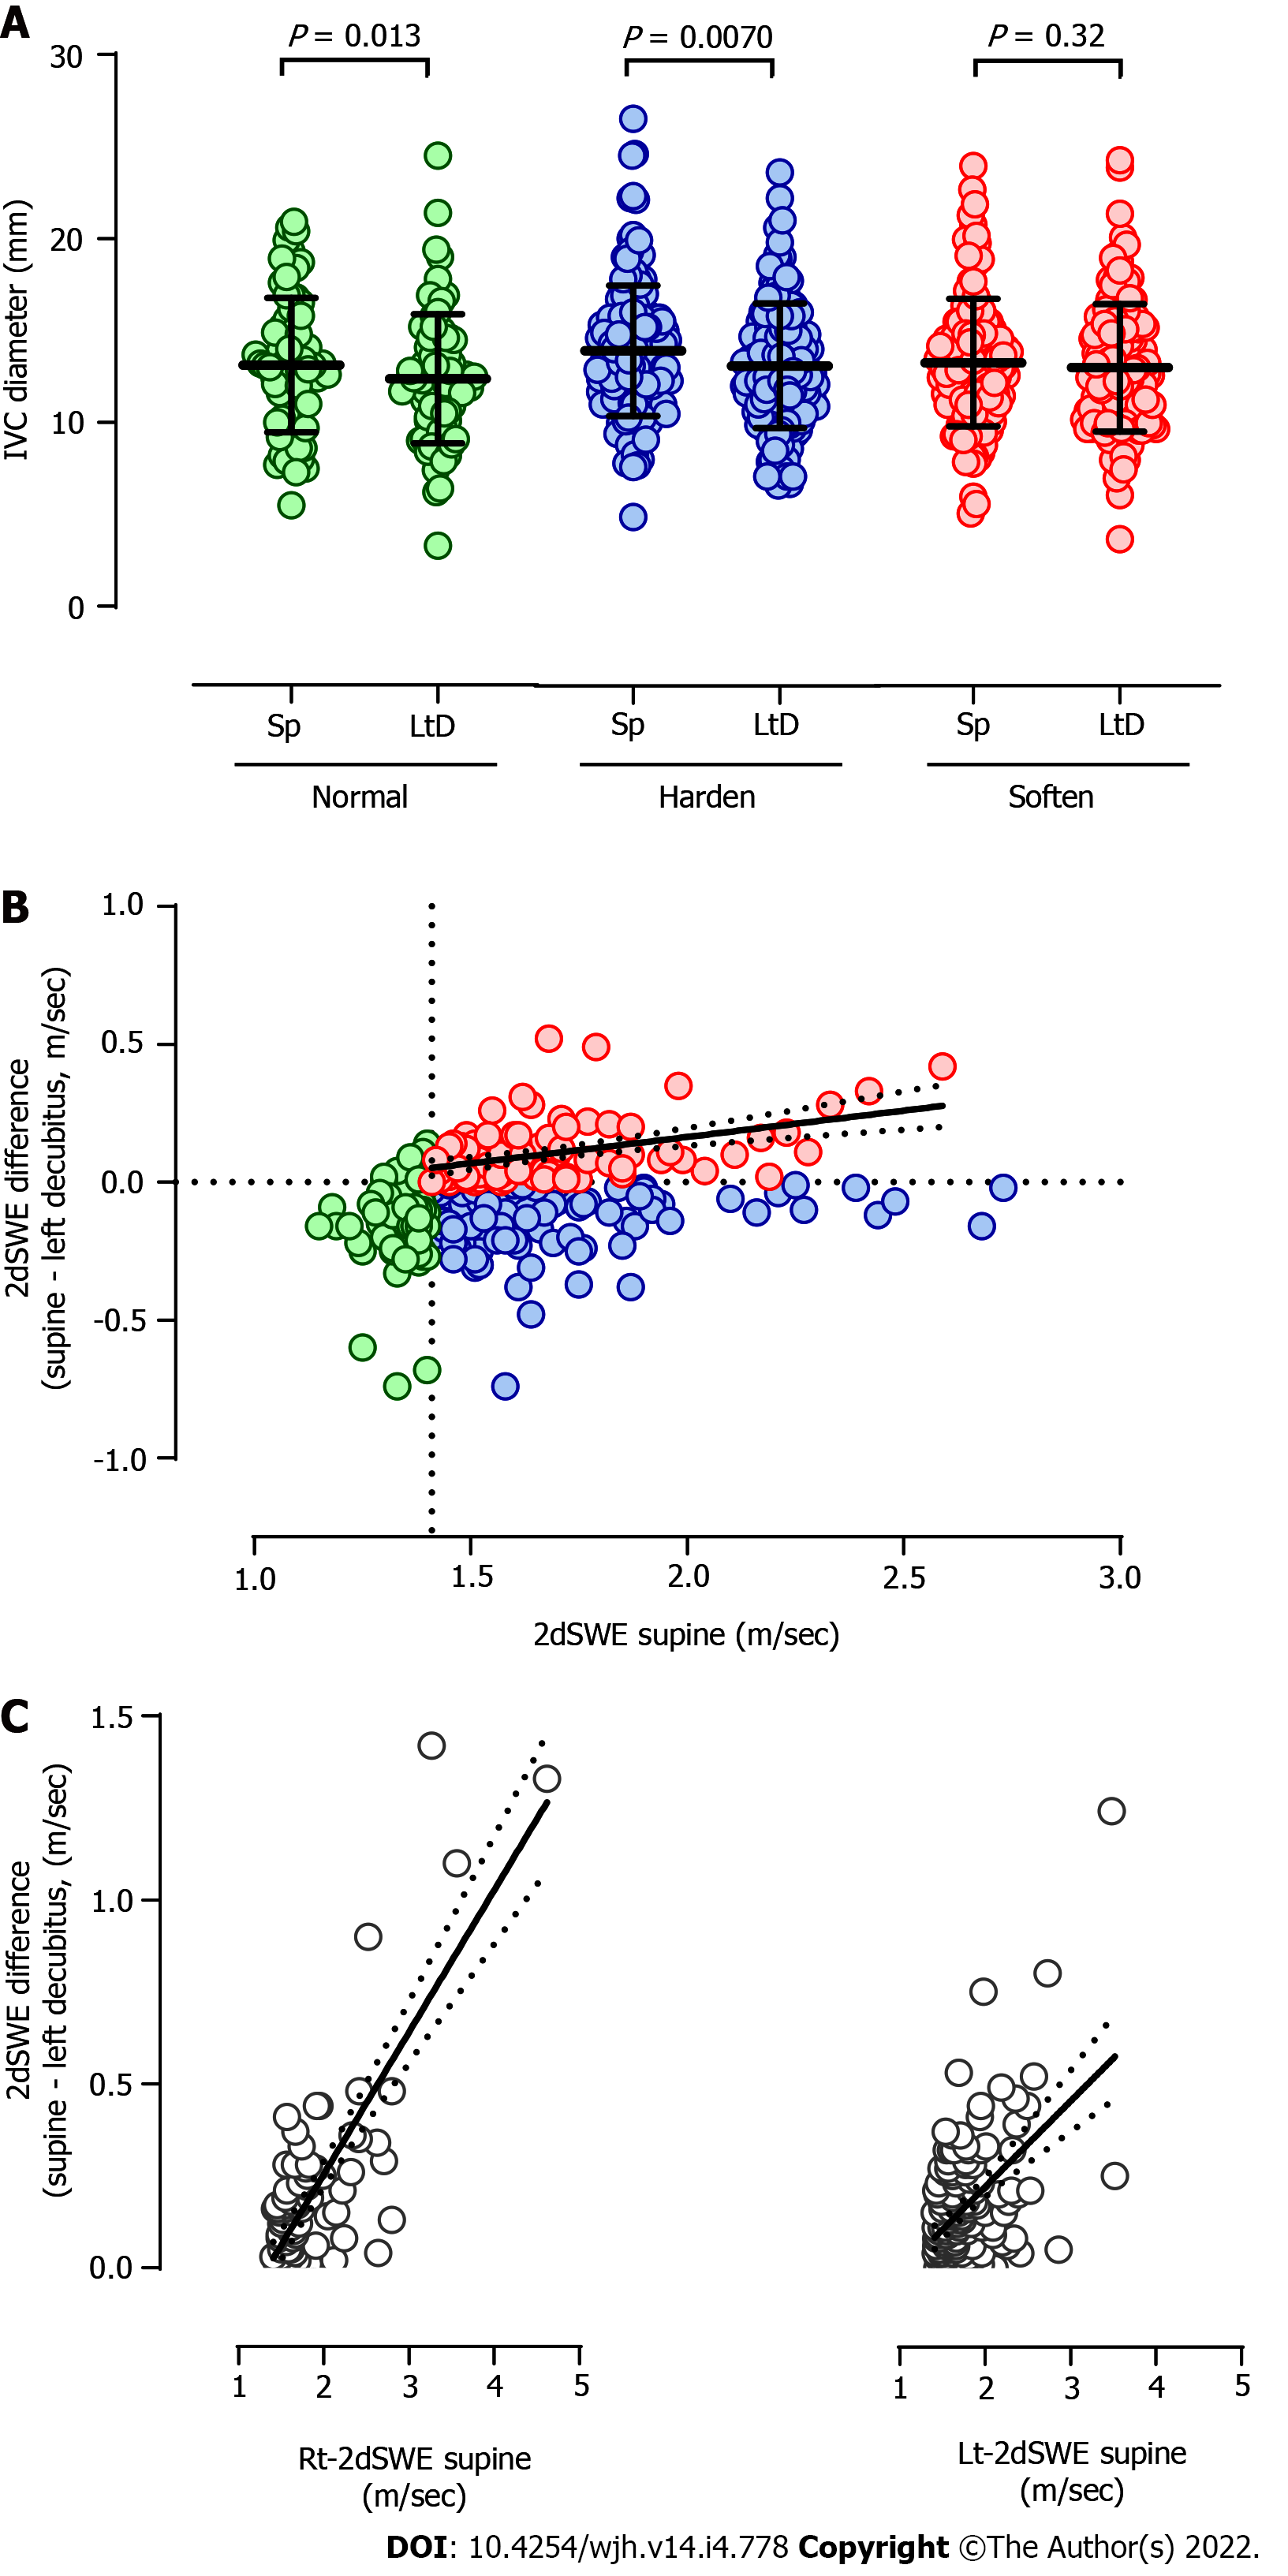
Figure 2 Alteration of the inferior vena cava diameter and liver stiffness after changing body positions.
A: The inferior vena cava diameter was significantly reduced in patients with normal two-dimensional shear wave elastography (2dSWE) values in the supine position (Normal, P = 0.013, 13.1 ± 3.7 vs 12.4 ± 3.5 mm) or patients with abnormal 2dSWE in the supine position that further hardened in the left decubitus position (Harden, P = 0.0070, 13.9 ± 3.6 vs 13.1 ± 3.4 mm). However, the diameter was not reduced in patients with abnormal 2dSWE in the supine position that softened in the left decubitus position (Soften, P = 0.32, 13.3 ± 3.5 vs 13.0 ± 3.5 mm). The horizontal bars in each plot indicate the average (“Bold”) and standard deviation. Supine and LtD indicate the supine and left decubitus positions, respectively; B: 2dSWE in the supine position revealed a significant positive correlation with the difference in 2dSWE between the two body positions only in the Soften group (red) (P < 0.0001, r = 0.38) but not in the Normal (green) and Harden (blue) groups; C: In the Soften group, 2dSWE values in the supine position were plotted against the difference in 2dSWE between the supine and left decubitus positions in the right or left lobe. A Spearman's correlation coefficient of 0.48 in the right lobe was higher than 0.31 in the left lobe. The black continuous and dotted lines reveal the best hit and 95% confidence band in the equation of least squares between 2dSWE values in the supine position and the difference in 2dSWE for two body positions in B and C. IVC: Inferior vena cava; Sp: Supine; 2dSWE: Two-dimensional shear wave elastography.
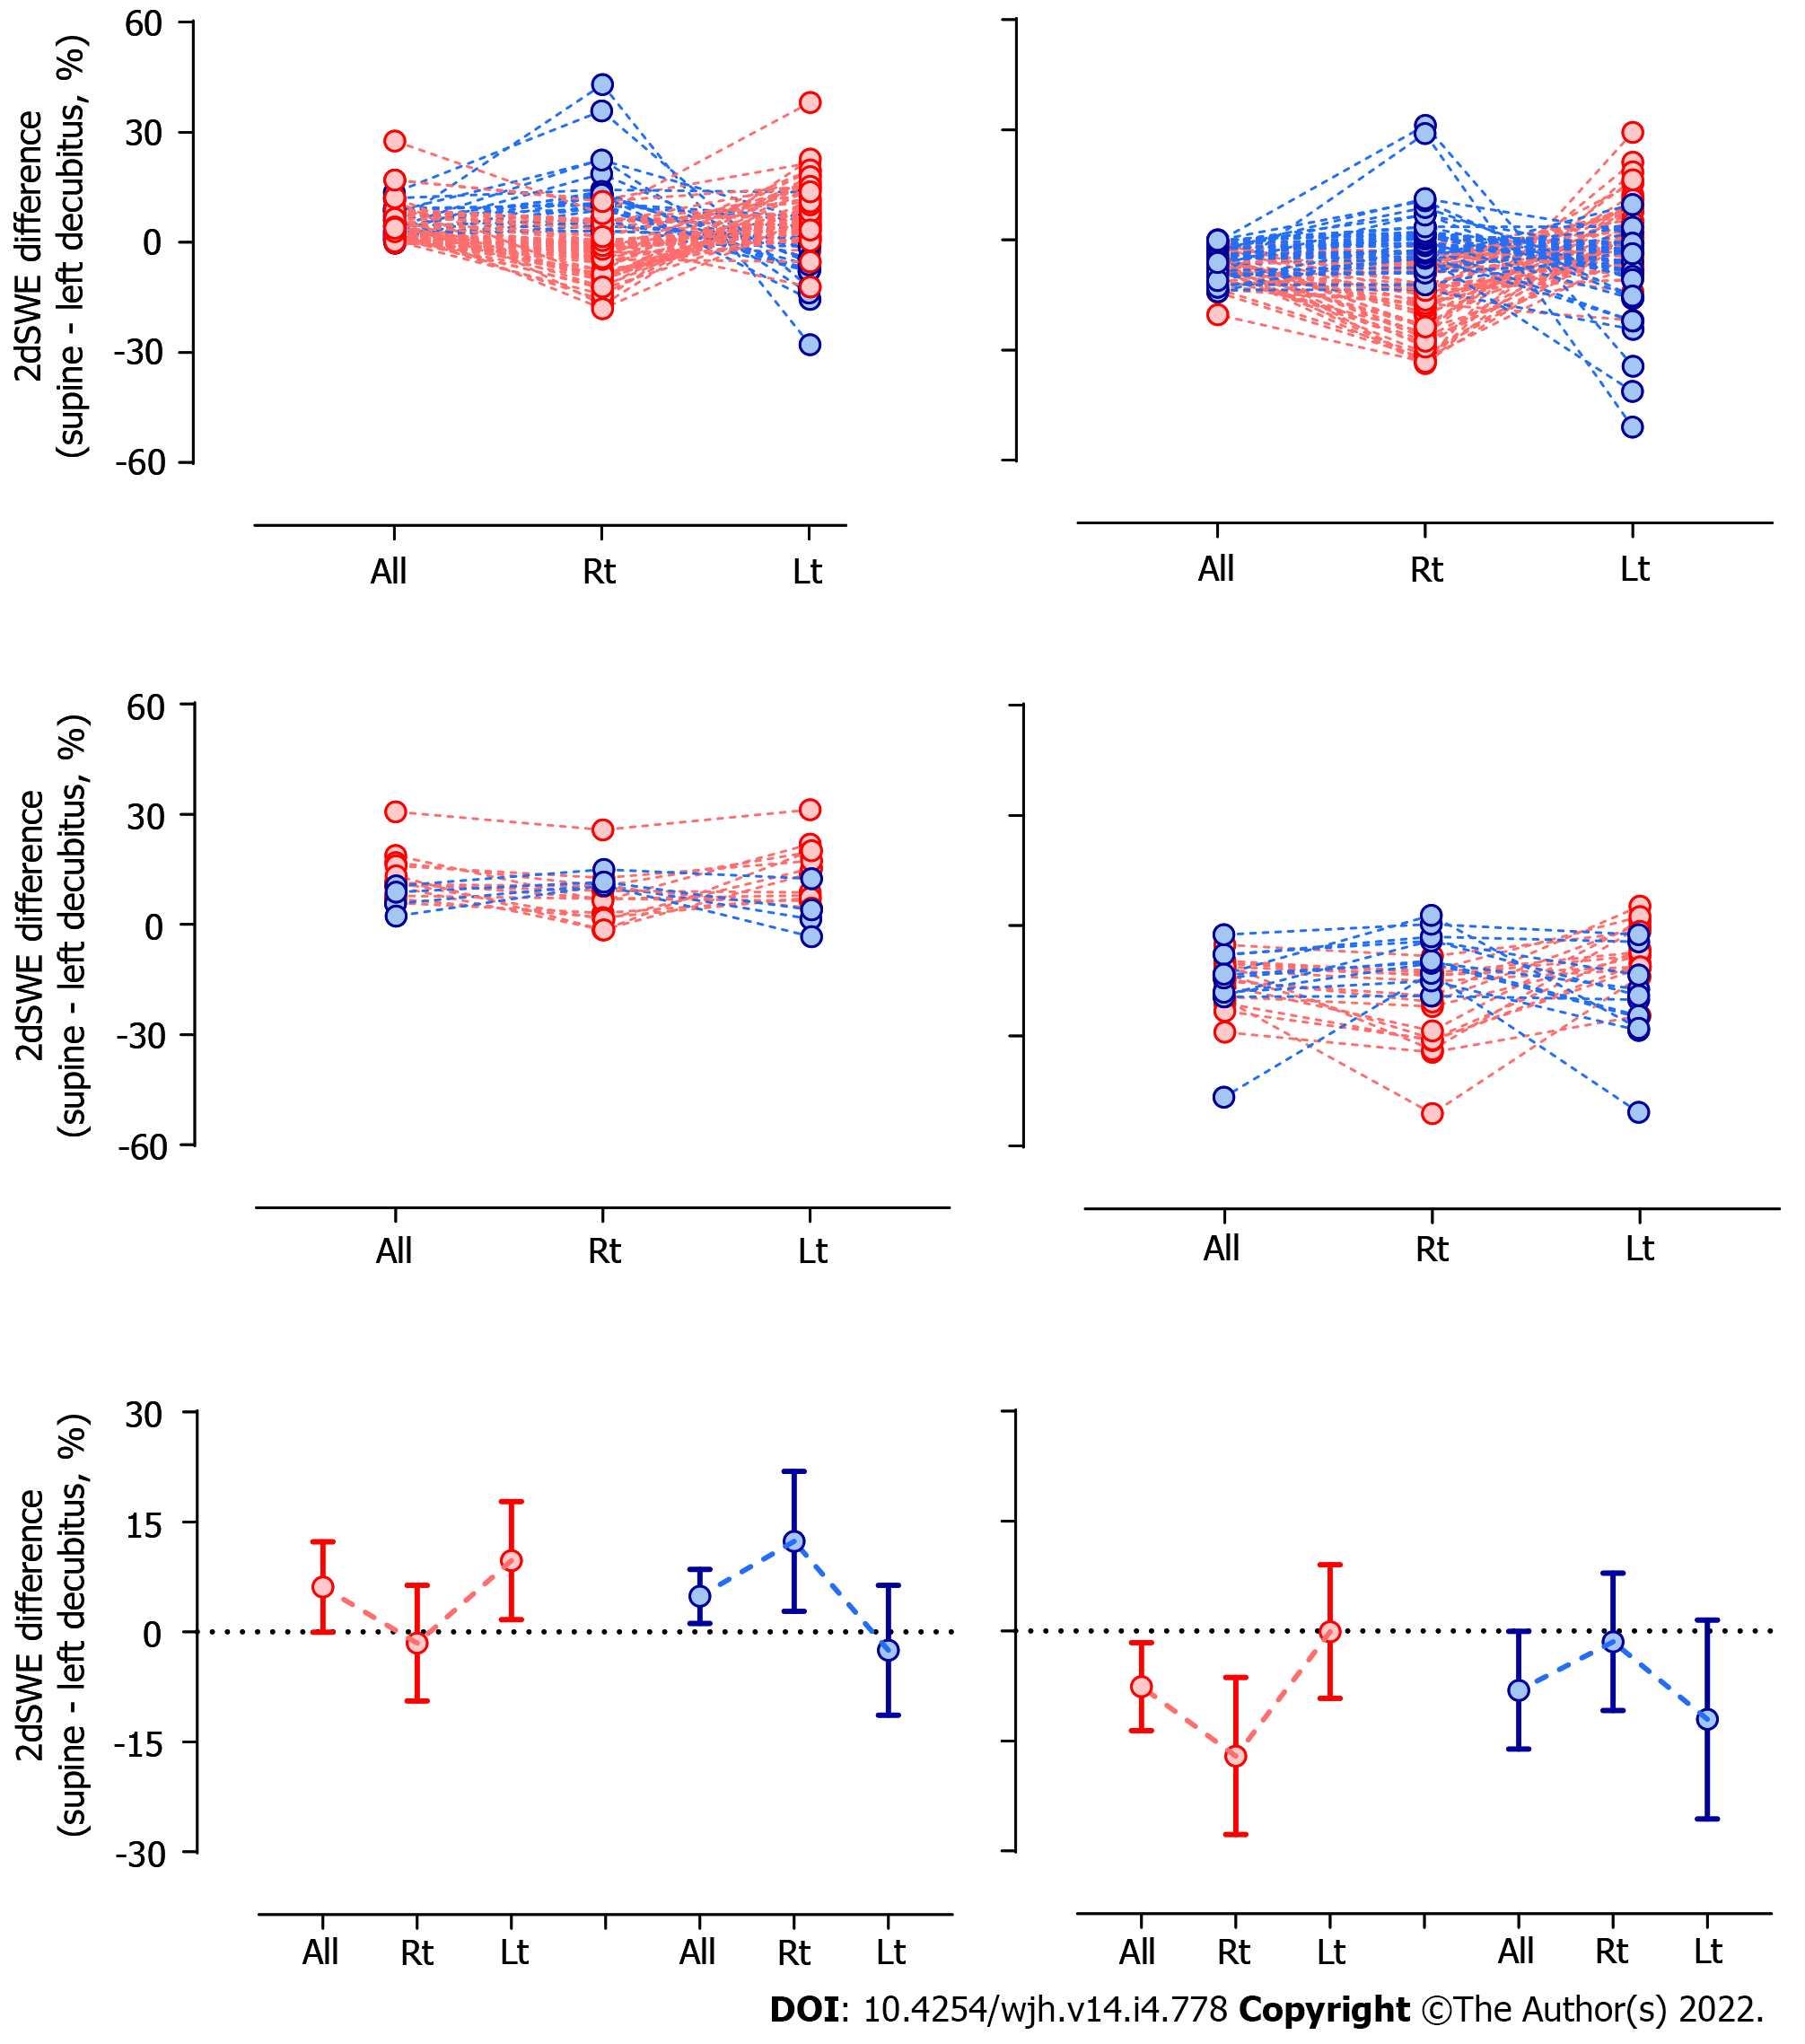
Figure 3 Reciprocal variation in liver stiffness difference between lobes.
In both cases, with positive (left column) or negative (right column) differences of two-dimensional shear wave elastography (2dSWE) values between two body positions in the entire liver (All), the difference varies less (positive: -1.52 ± 7.91 m/sec, negative: -17.04 ± 10.71 m/sec) or more (positive: 12.38 ± 9.55 m/sec, negative: -1.46 ± 9.39 m/sec) in the right lobe compared with the entire liver (red or blue, respectively, positive: 6.13 ± 6.18 m/sec, negative: -7.57 ± 5.98 m/sec) and reciprocally more (positive: 9.74 ± 8.03 m/sec, negative: -0.08 ± 9.11 m/sec) and less (positive: -2.51 ± 8.85 m/sec, negative: -12.05 ± 13.56 m/sec) in the left lobe compared with the entire liver (positive: 4.86 ± 3.68 m/sec, negative: -8.06 ± 8.02 m/sec). The upper and middle panels represent cases where the difference in 2dSWE for the entire liver is within or beyond the magnitude of robust coefficient of variation, respectively. In the bottom panel, the results in the upper and middle panels are combined. The circle and horizontal bars in each plot indicate the average and standard deviation, respectively. Lt: Left lobe; Rt: Right lobe; 2dSWE: Two-dimensional shear wave elastography.
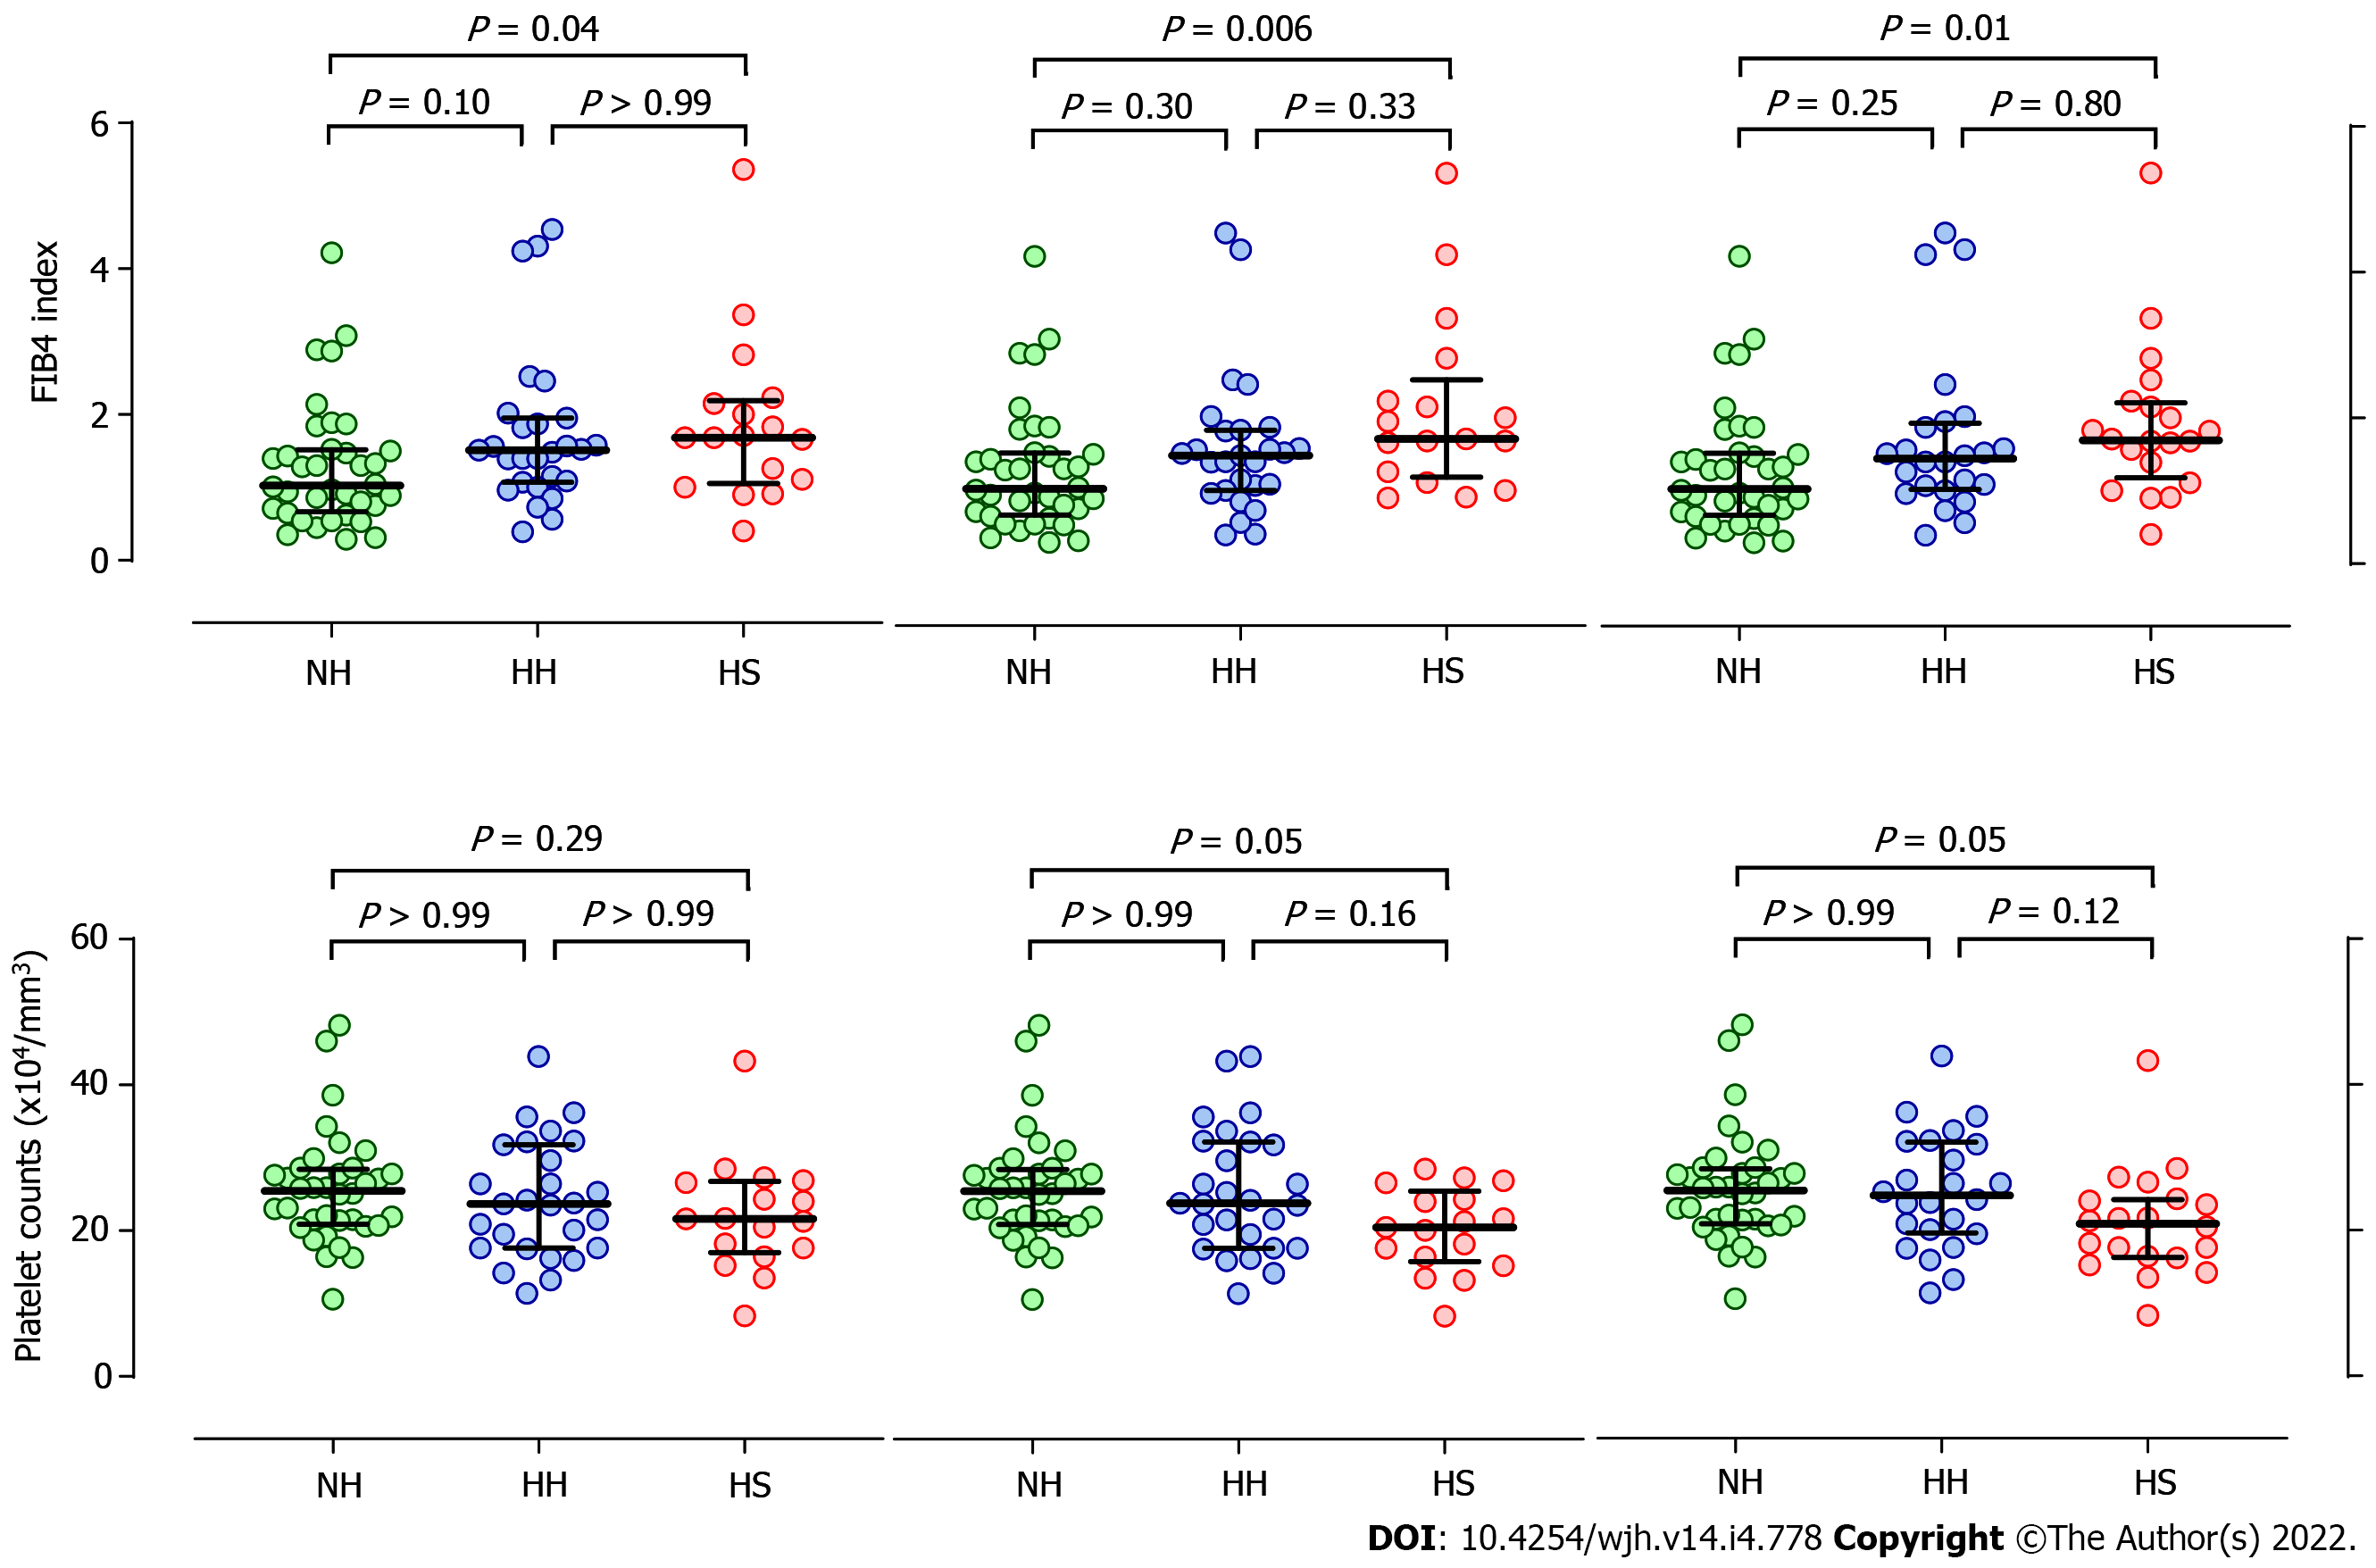
Figure 4 Fibrous progression of the liver was suggested in the soften group.
Fibrosis-4 (FIB4, top panel) and its constituent of platelet counts (bottom panel) were compared among 3 groups in which two-dimensional shear wave elastography (2dSWE) values increased or decreased in association with changing body positions beyond the magnitude of robust coefficient of variation; normal in the supine position (Normal-to-Hard: NH), abnormal and increased (Hard-to-Hard: HH) or decreased (Hard-to-Soft: HS) in the left decubitus position. The group was classified based on the difference in 2dSWE values in the entire liver (left column) or each lobe of right (middle column) or left (right column). A significant difference in FIB4 (entire: P = 0.04, 1.29 ± 0.87 vs 1.89 ± 1.16, right: P = 0.006, 1.29 ± 0.87 vs 2.12 ± 1.22, left: P = 0.01, 1.29 ± 0.87 vs 1.91 ± 1.07) and platelet counts (entire: P = 0.29, 25.7 ± 7.6 vs 22.1 ± 7.7 x10⁴/mm3, right: P = 0.05, 25.7 ± 7.6 vs 20.2 ± 5.7 x10⁴/mm3, left: P = 0.05, 25.7 ± 7.6 vs 21.0 ± 7.3 x10⁴/mm3) was observed between Normal-to-Hard and Hard-to-Soft. The probabilities were higher when the group was determined in each lobe. The horizontal bars in each plot indicate an average (“Bold”) and standard deviation. HH: Hard-to-Hard; NH: Normal-to-Hard; HS: Hard-to-Soft.
- Citation: Suda T, Sugimoto A, Kanefuji T, Abe A, Yokoo T, Hoshi T, Abe S, Morita S, Yagi K, Takahashi M, Terai S. Gravity assistance enables liver stiffness measurements to detect liver fibrosis under congestive circumstances. World J Hepatol 2022; 14(4): 778-790
- URL: https://www.wjgnet.com/1948-5182/full/v14/i4/778.htm
- DOI: https://dx.doi.org/10.4254/wjh.v14.i4.778


