Copyright
©The Author(s) 2022.
World J Hepatol. Mar 27, 2022; 14(3): 570-582
Published online Mar 27, 2022. doi: 10.4254/wjh.v14.i3.570
Published online Mar 27, 2022. doi: 10.4254/wjh.v14.i3.570
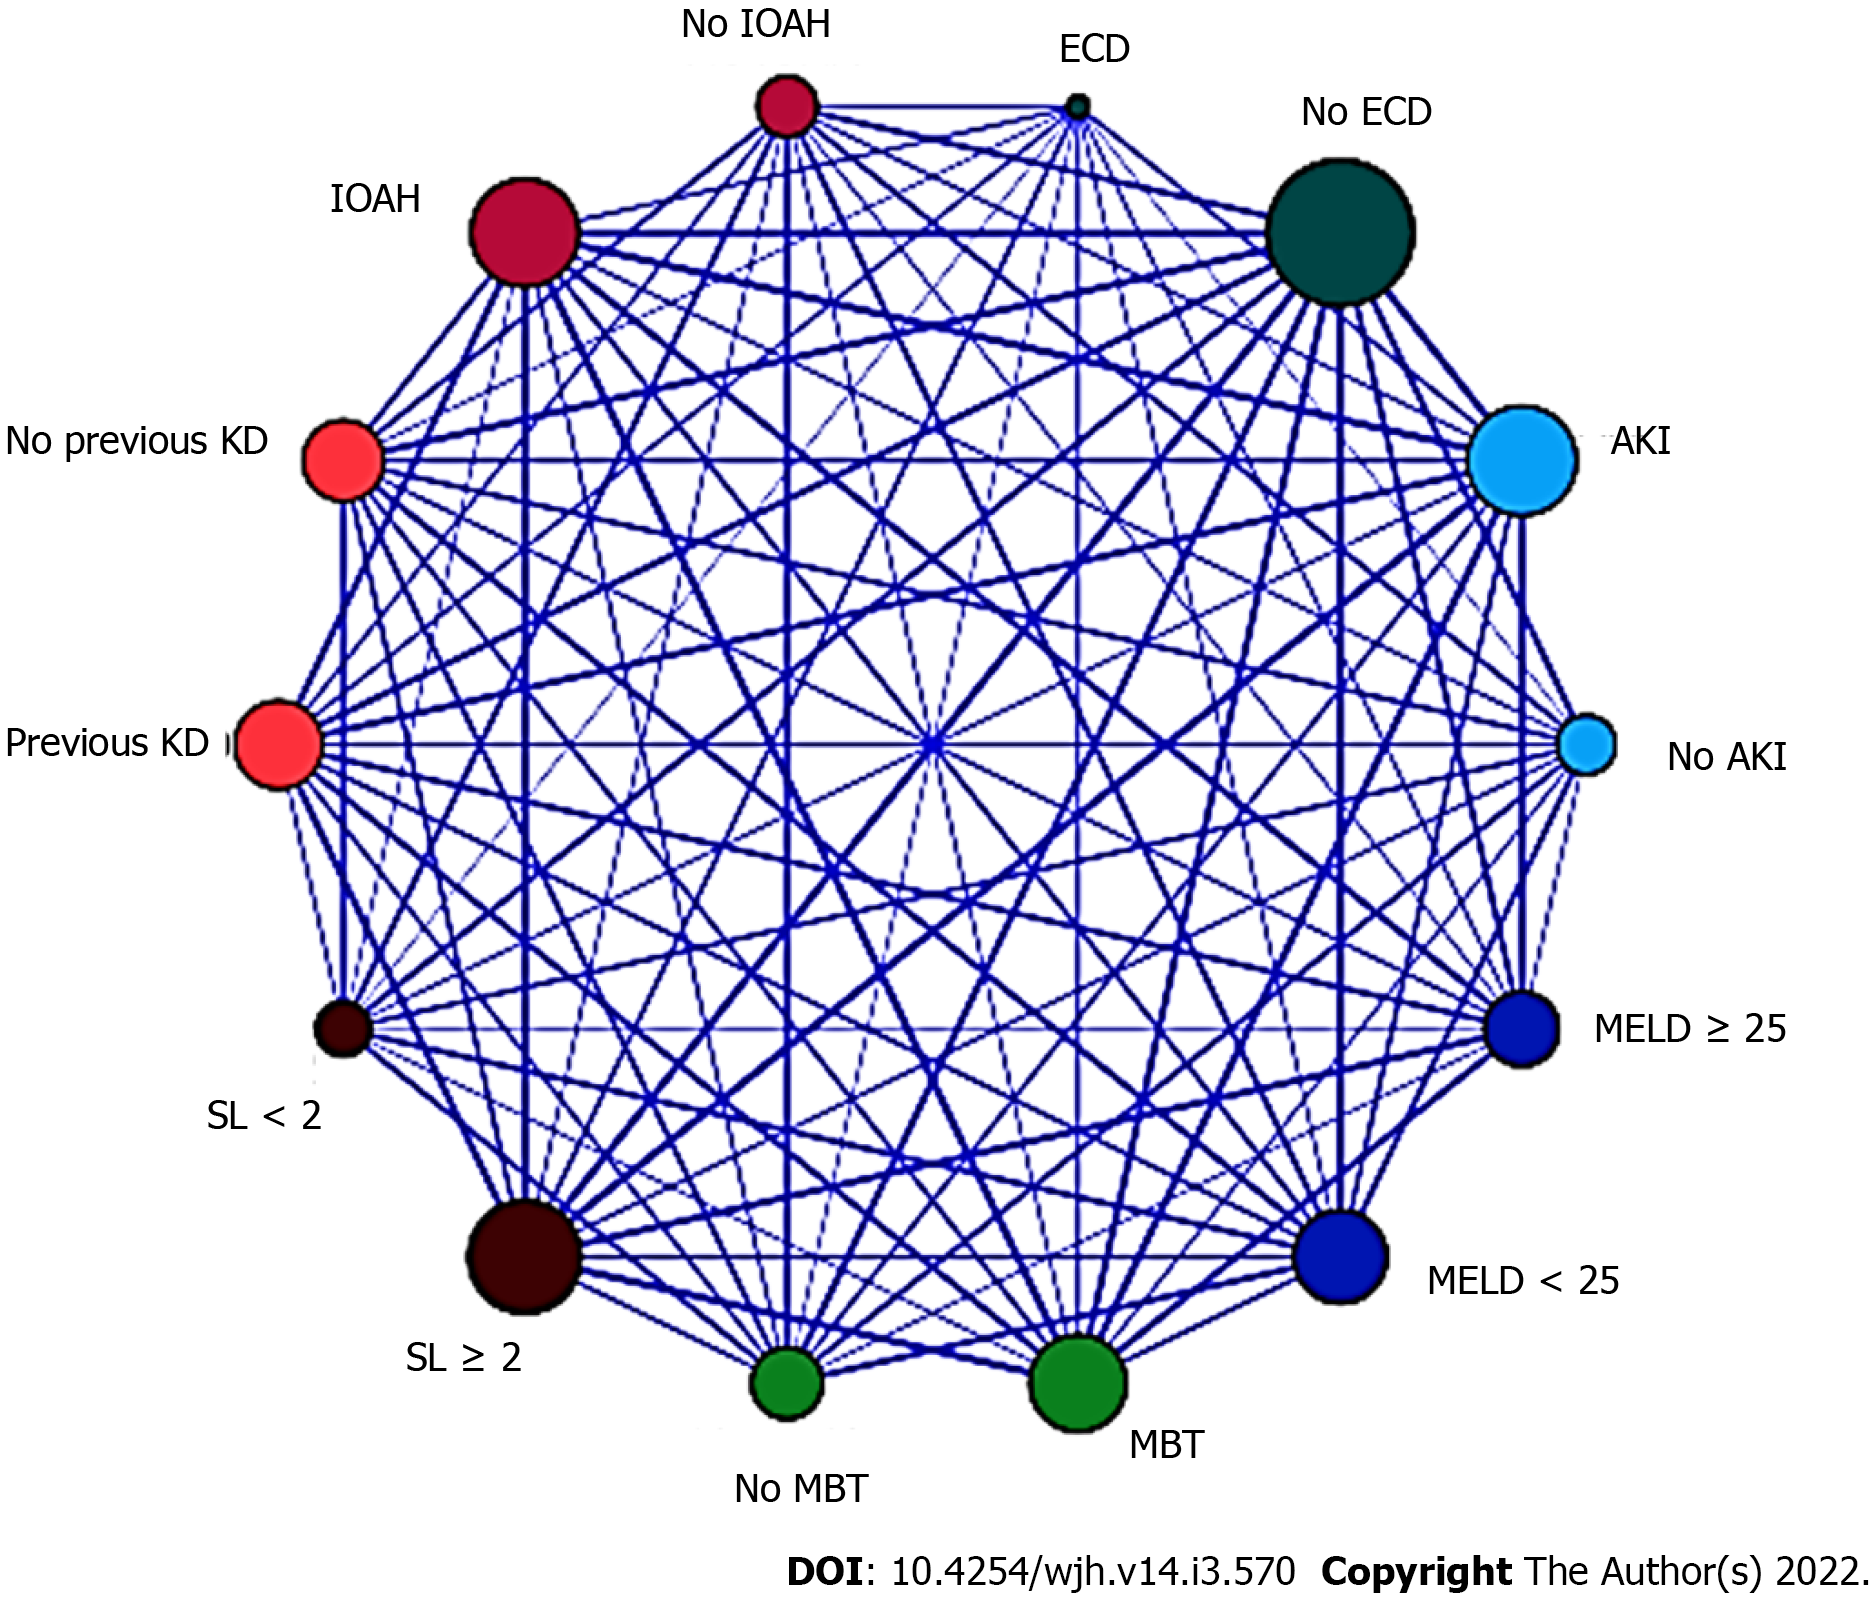
Figure 1 Relationship map between the selected variables in the logistic regression for acute kidney injury after deceased-donor liver transplantation (n = 145).
MELD: Model for End-stage Liver Disease; KD: Kidney dysfunction; ECD: Extended criteria donor; IOAH: Intra-operative arterial hypotension; MBT: Massive blood transfusion; SL: Serum lactate. LR: Logistic regression; AKI: Acute kidney injury.
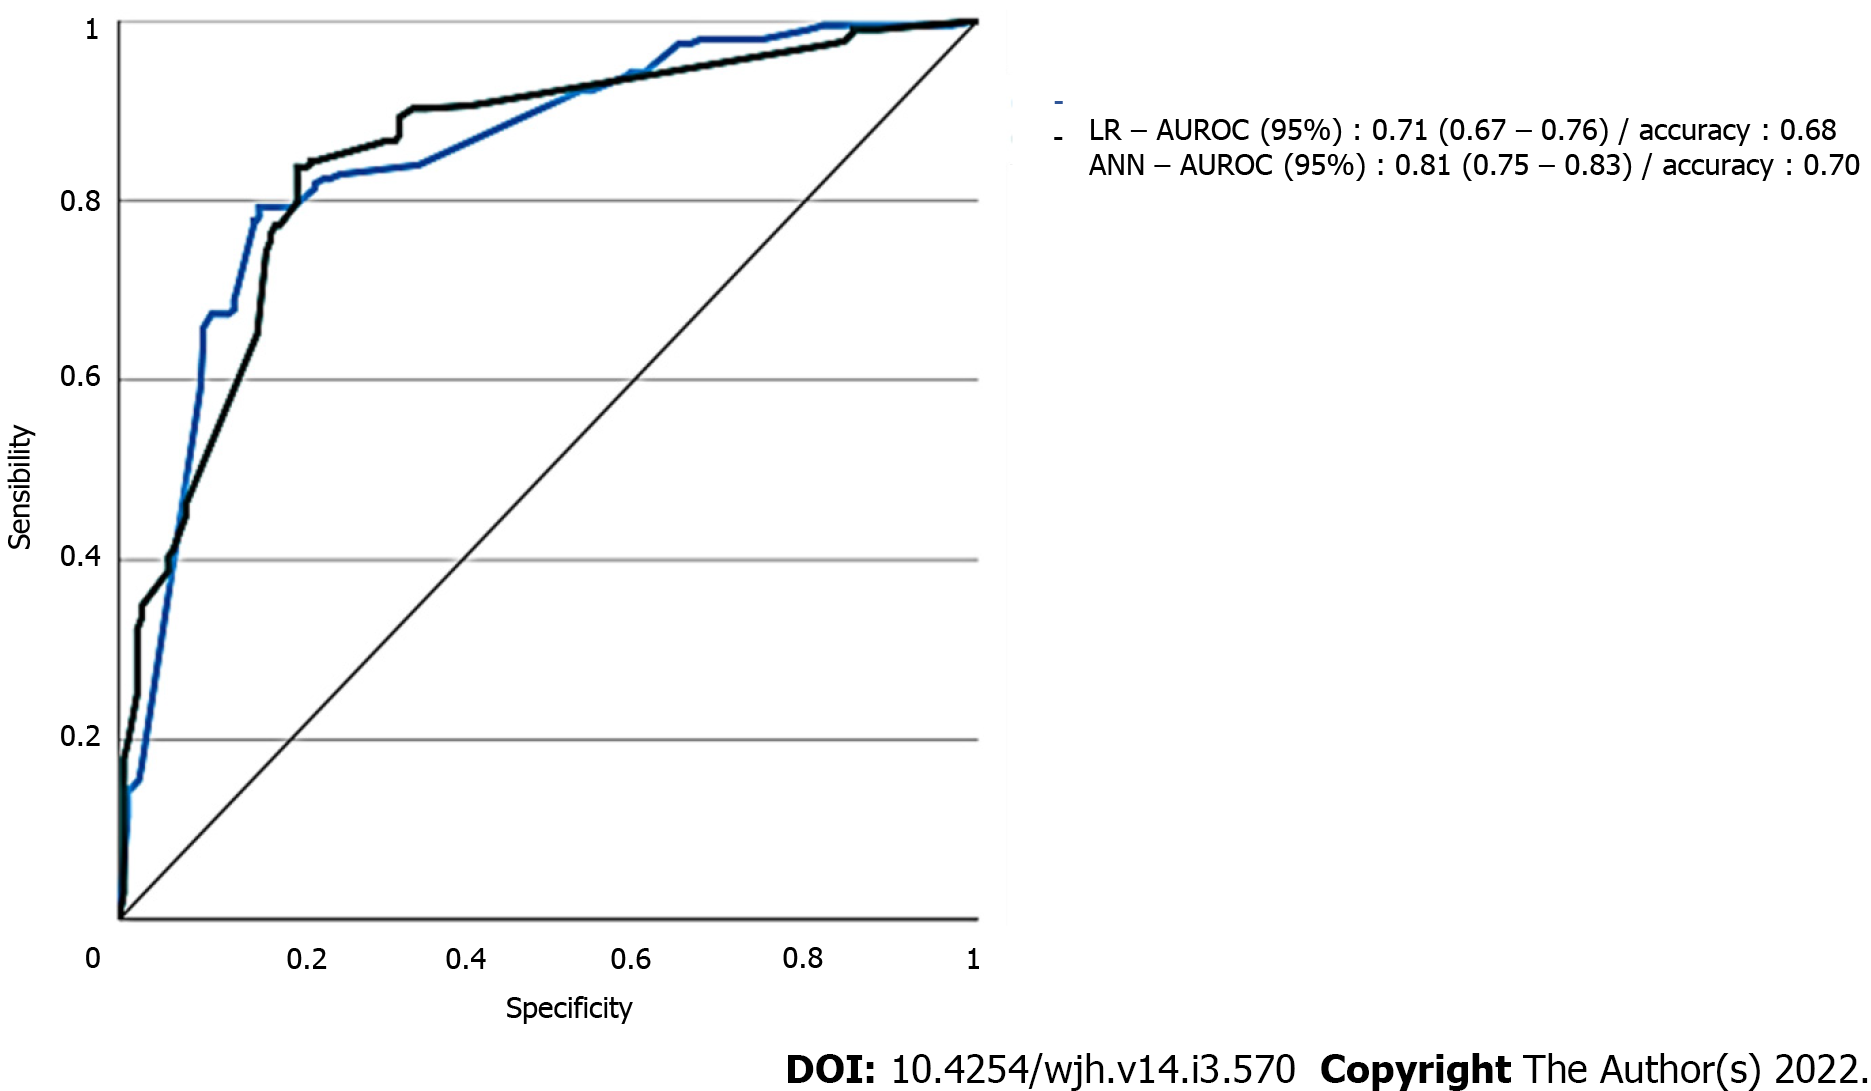
Figure 2 Area under the receiver-operating characteristic curve of the two different models for predicting acute kidney injury (n = 145).
LR: Logistic regression; AUROC: Area under the receiver-operating characteristic curve; ANN: Artificial neural network; AKI: Acute kidney injury.
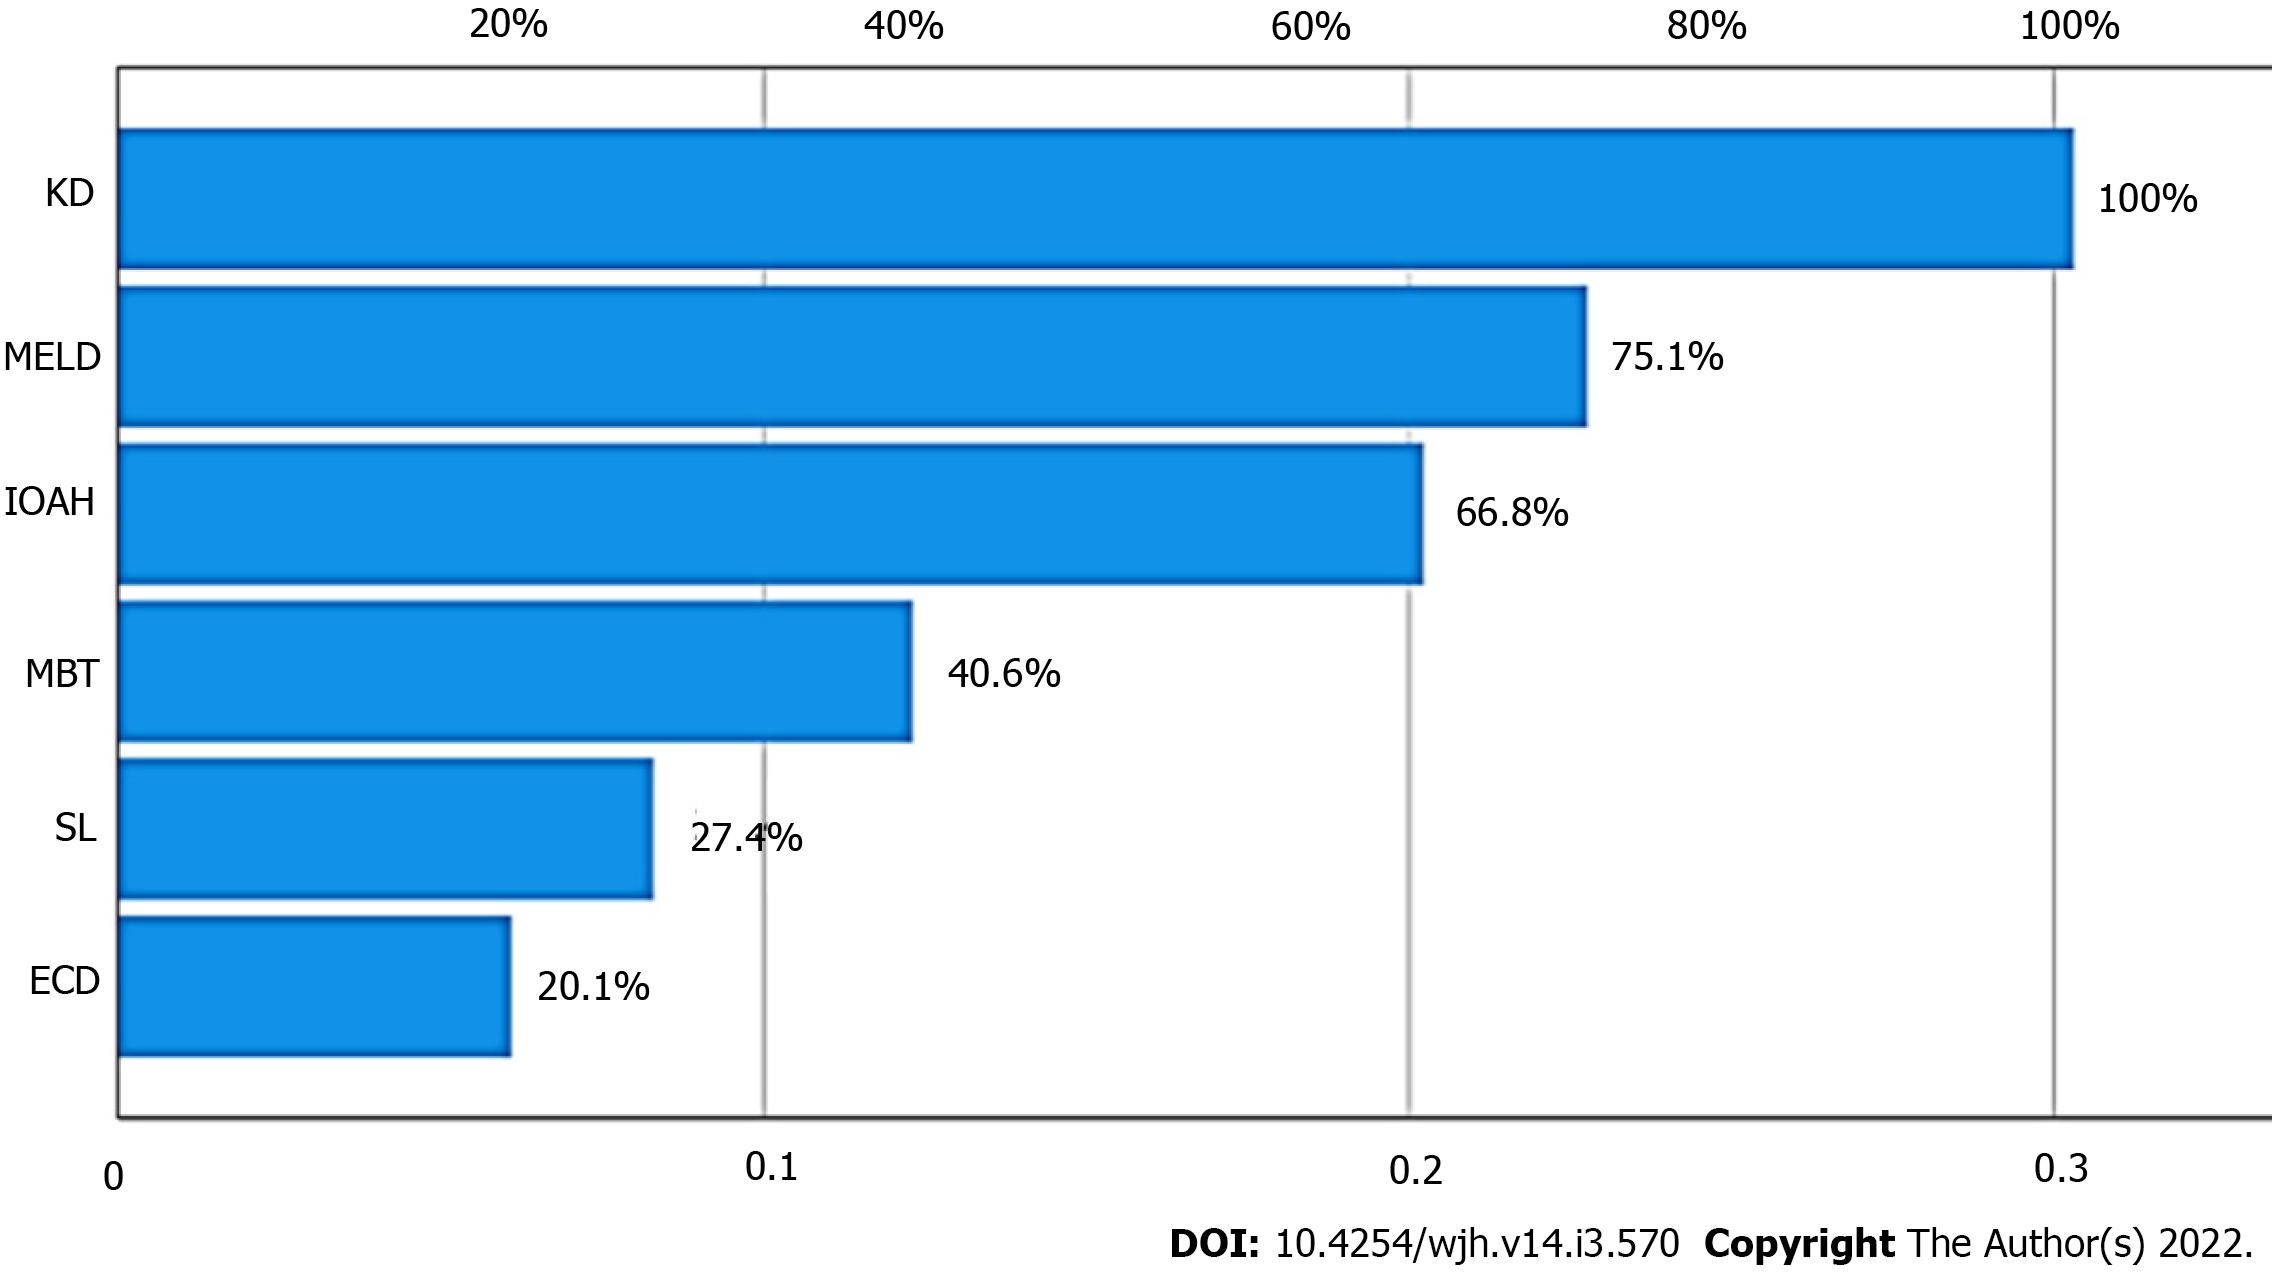
Figure 3 Variance importance plot of predictors of acute kidney injury for artificial neural network.
KD: Kidney dysfunction; MELD: Model for End-stage Liver Disease; IOAH: Intra-operative arterial hypotension; MBT: Massive blood transfusion; ECD: Extended criteria donor; AKI: Acute kidney injury; ANN: Artificial neural network.
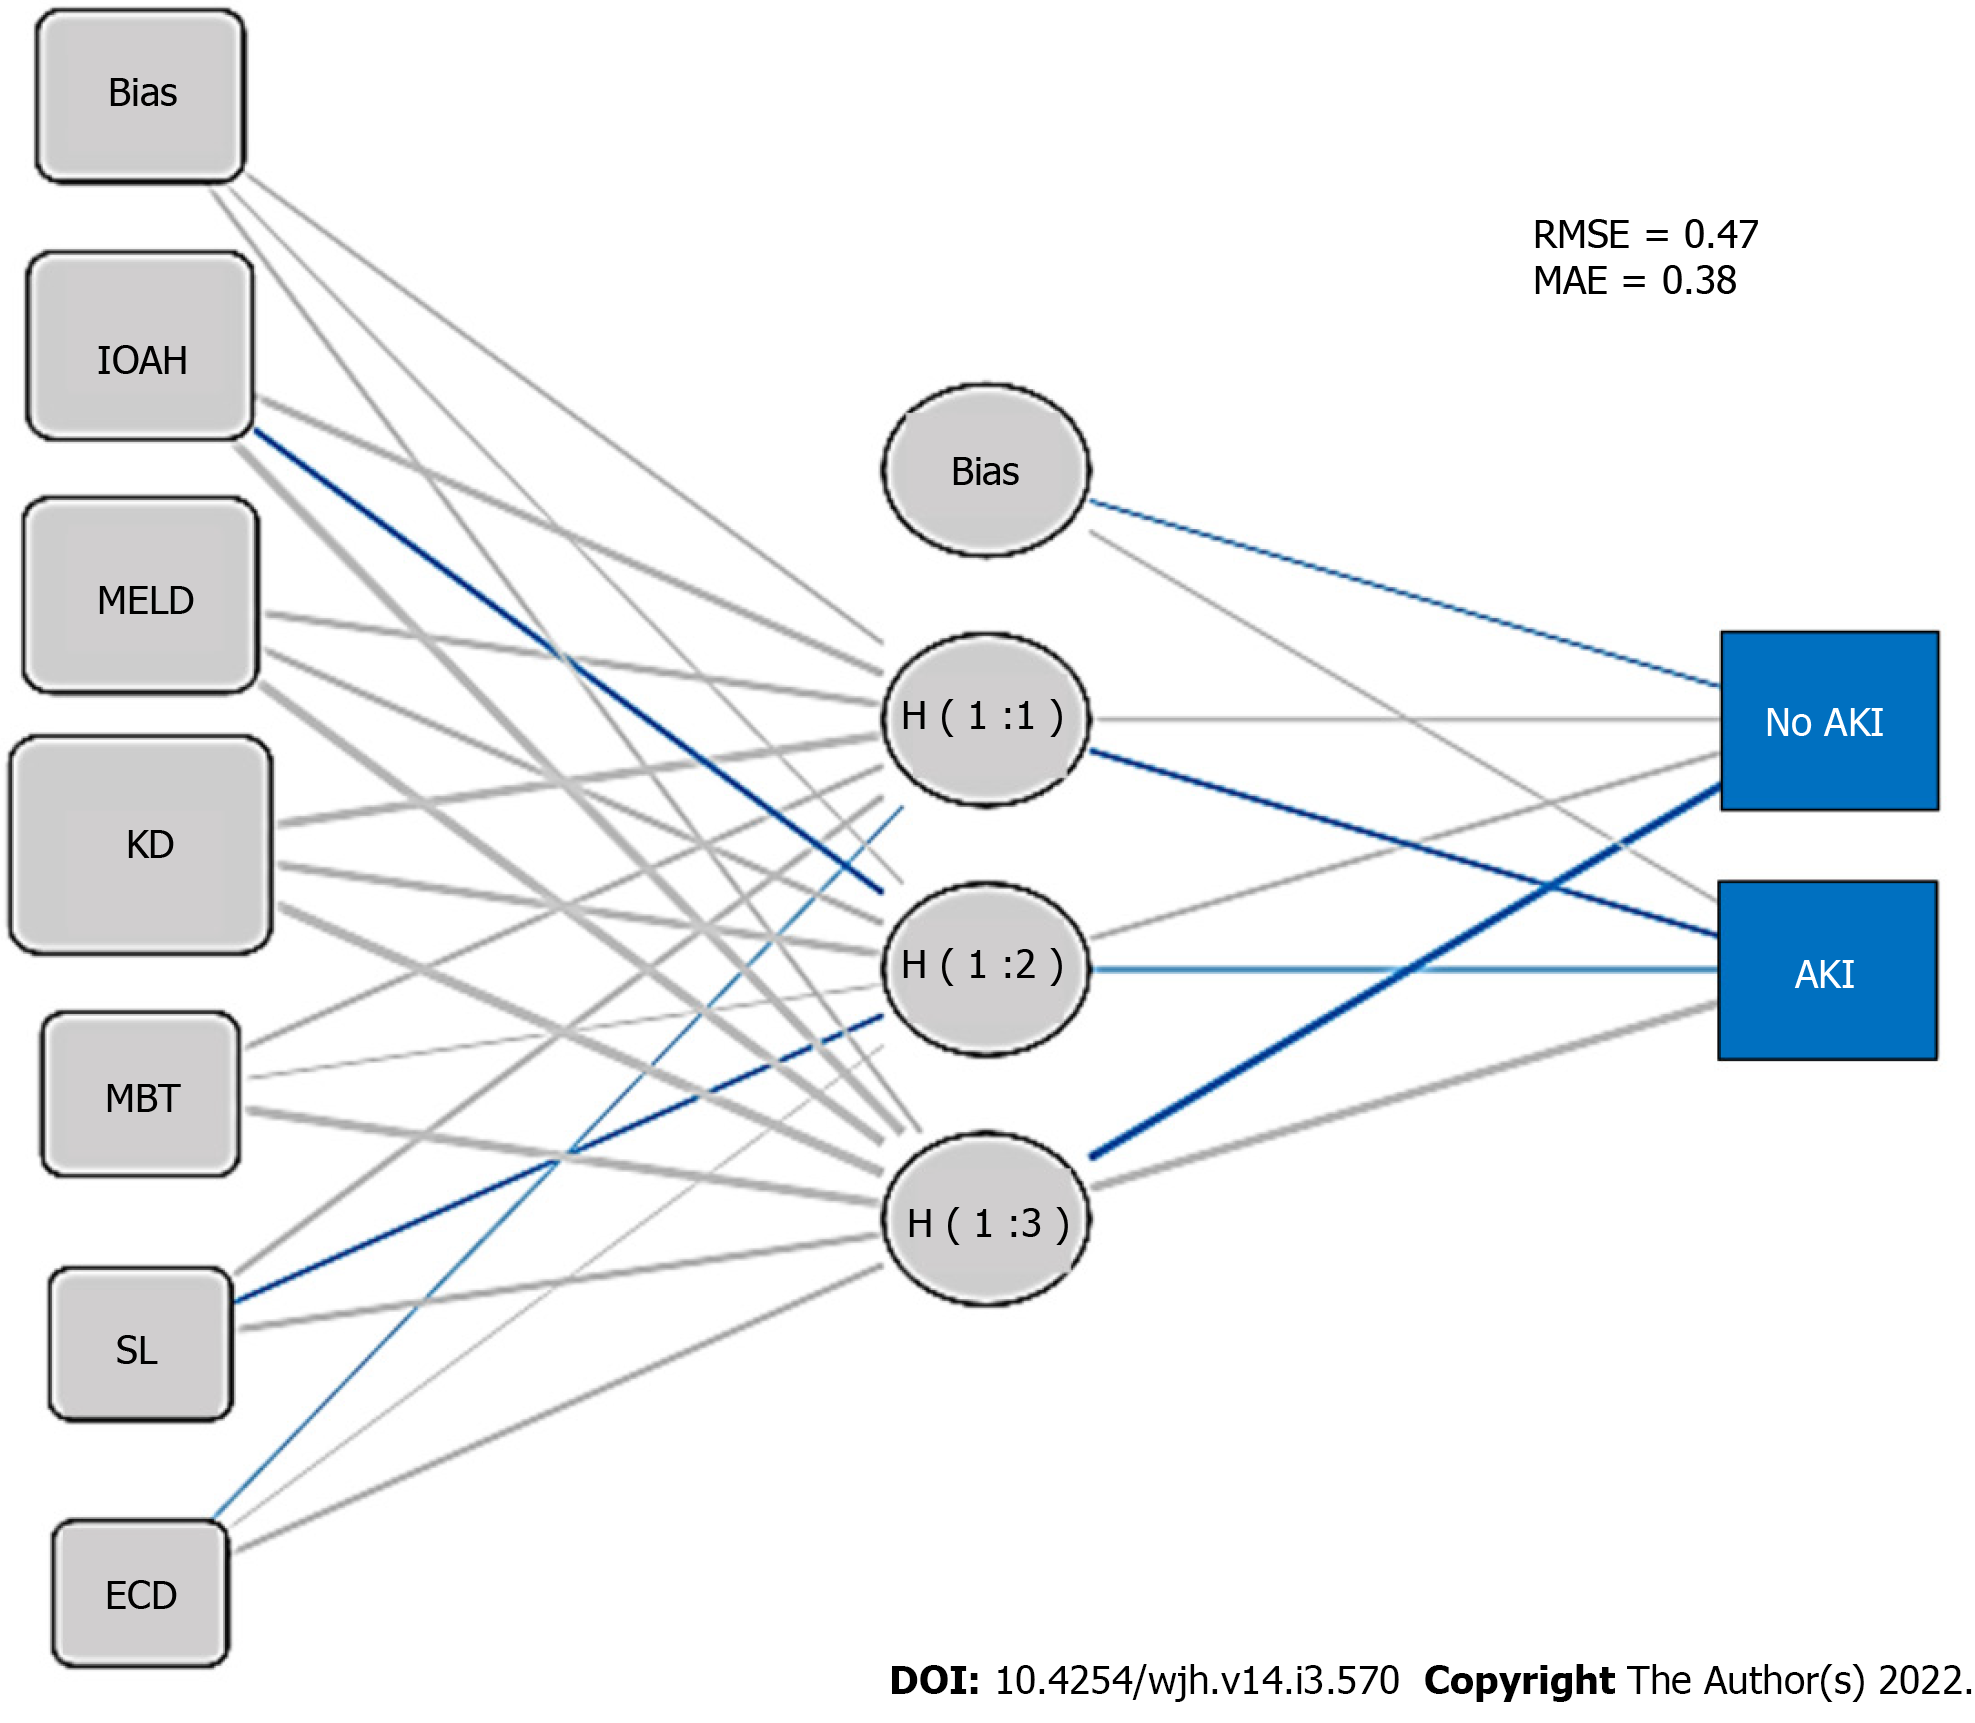
Figure 4 Artificial neural network structural model diagram for acute kidney injury after deceased-donor liver transplantation.
IOAH: Intra-operative arterial hypotension; MELD: Model for End-stage Liver Disease; KD: Kidney dysfunction; MBT: Massive blood transfusion; ECD: Extended criteria donor; AKI: Acute kidney injury; ANN: Artificial neural network; RMSE: Root-mean-square error; MAE: Mean absolute error.
- Citation: Bredt LC, Peres LAB, Risso M, Barros LCAL. Risk factors and prediction of acute kidney injury after liver transplantation: Logistic regression and artificial neural network approaches . World J Hepatol 2022; 14(3): 570-582
- URL: https://www.wjgnet.com/1948-5182/full/v14/i3/570.htm
- DOI: https://dx.doi.org/10.4254/wjh.v14.i3.570


