Copyright
©The Author(s) 2020.
World J Hepatol. Mar 27, 2020; 12(3): 84-98
Published online Mar 27, 2020. doi: 10.4254/wjh.v12.i3.84
Published online Mar 27, 2020. doi: 10.4254/wjh.v12.i3.84
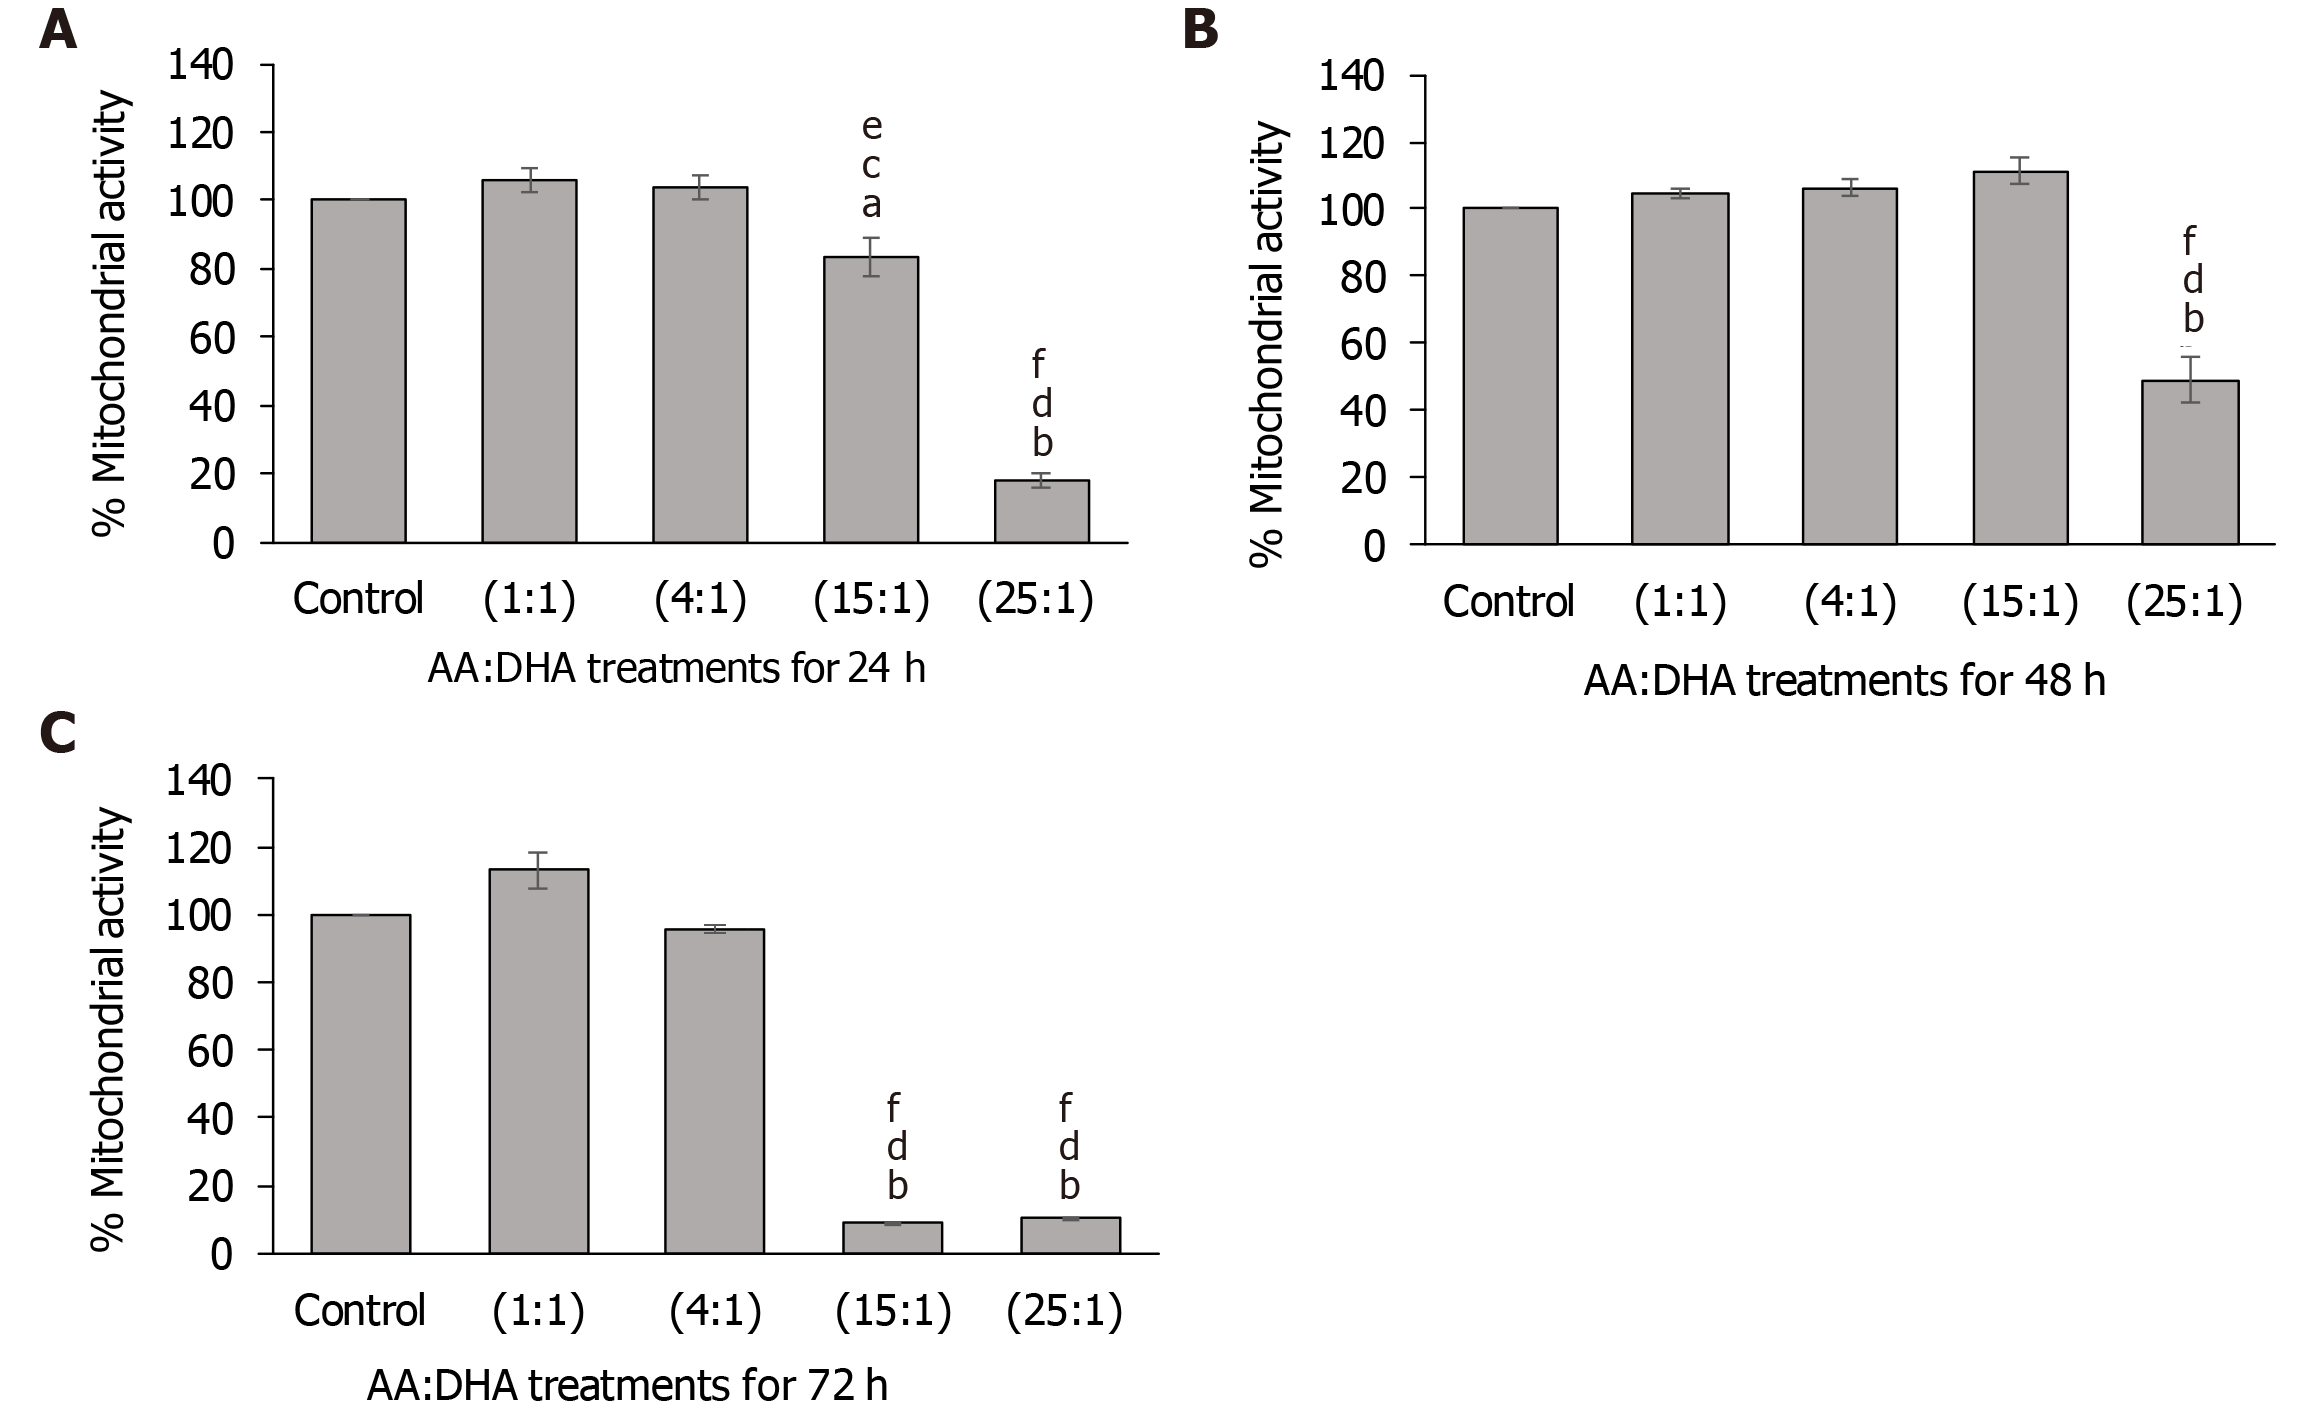
Figure 1 Effect of arachidonic acid: docosahexaenoic acid ratios on mitochondrial activity.
A-C: VL17-A cells were treated with different ratios of arachidonic acid: docosahexaenoic acid and mitochondrial activity was assessed after 24 h (A), 48 h (B) and 72 h (C). aP < 0.05 and bP < 0.01 compared to control; cP < 0.05 and dP < 0.01 compared to 1:1 ratio; eP < 0.05 and fP < 0.01 compared to 4:1 ratio. Data is presented as mean ± SE (n = 3). AA: Arachidonic acid; DHA: Docosahexaenoic acid.
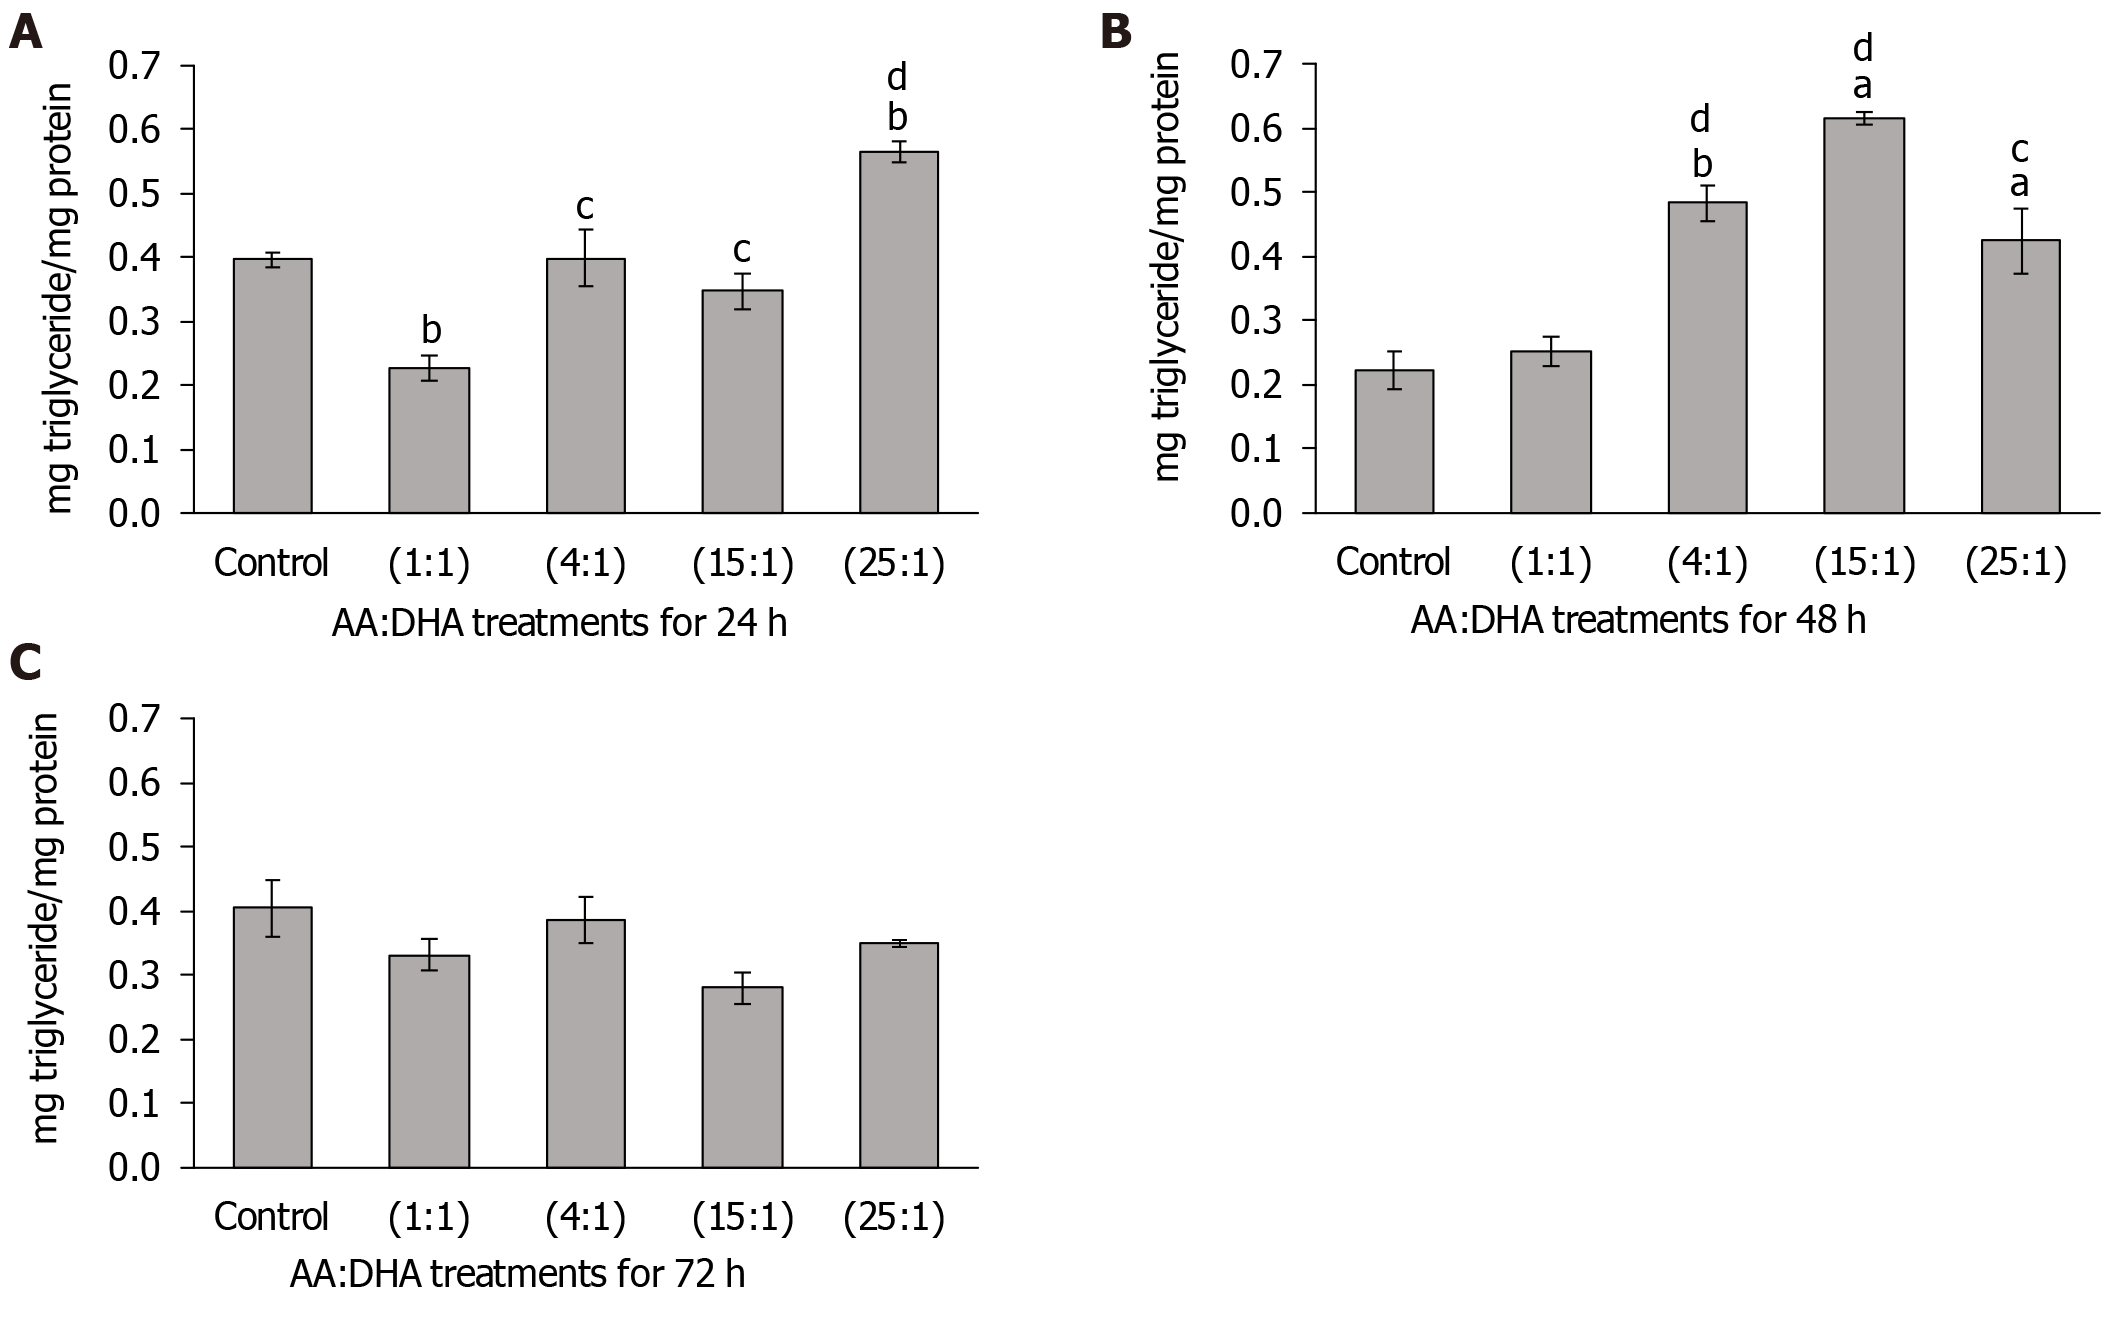
Figure 2 Effect of arachidonic acid: docosahexaenoic acid ratios on intracellular triglyceride accumulation.
A-C: VL17-A cells were treated with different ratios of arachidonic acid: docosahexaenoic acid for 24 h (A), 48 h (B) and 72 h (C). Intracellular triglyceride levels were measured and normalised to cellular protein content. aP < 0.05 and bP ≤ 0.01 compared to control; cP < 0.05 and dP ≤ 0.01 compared to 1:1 ratio. Data is presented as mean ± SE (n = 5). AA: Arachidonic acid; DHA: Docosahexaenoic acid.
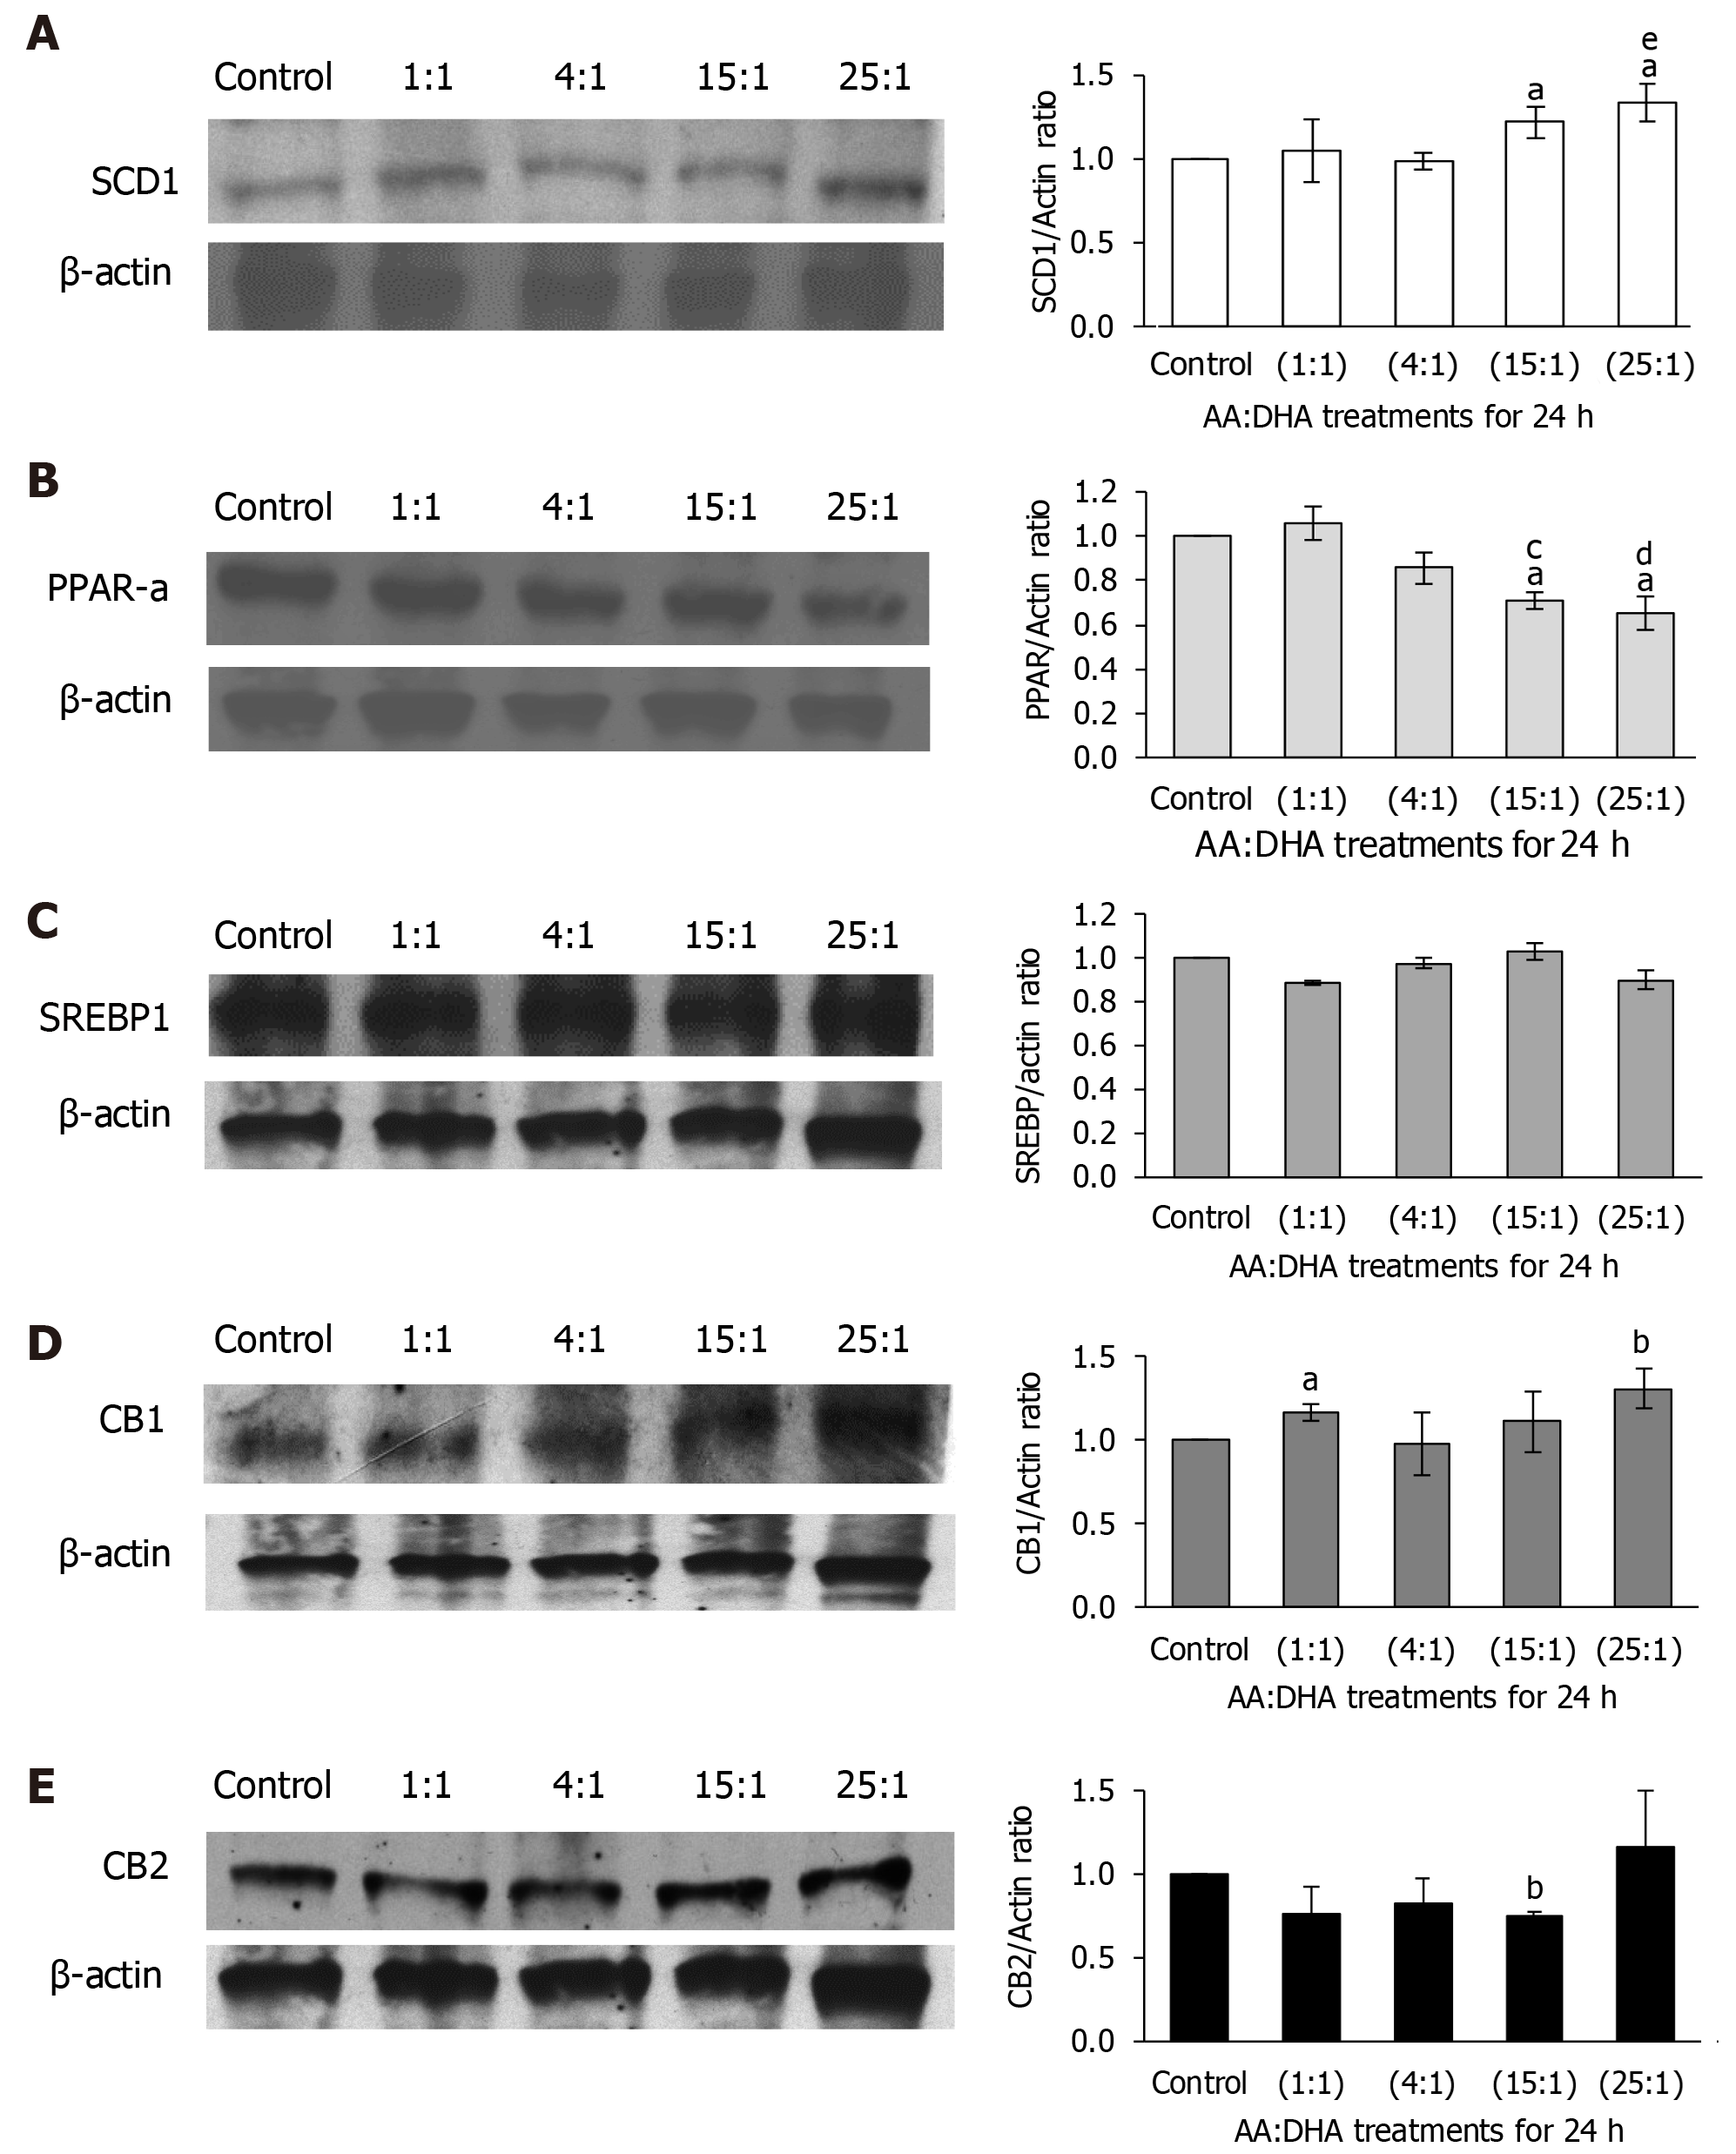
Figure 3 Effect of arachidonic acid: docosahexaenoic acid ratios on mechanistic mediators of lipid metabolism.
A-E: VL17-A cells were treated with different ratios of arachidonic acid: docosahexaenoic acid for 24 h. Following this, the expression of several proteins that modulate lipid metabolism were examined, namely, SCD1 (A), PPAR-α (B), SREBP1c (C), CB1 (D) and CB2 (E). aP ≤ 0.05 and bP ≤ 0.01 compared to control; cP < 0.05 and dP < 0.01 compared to 1:1 ratio; eP < 0.05 compared to 4:1 ratio. Data is presented as mean ± SE (n = 3-4). AA: Arachidonic acid; DHA: Docosahexaenoic acid.
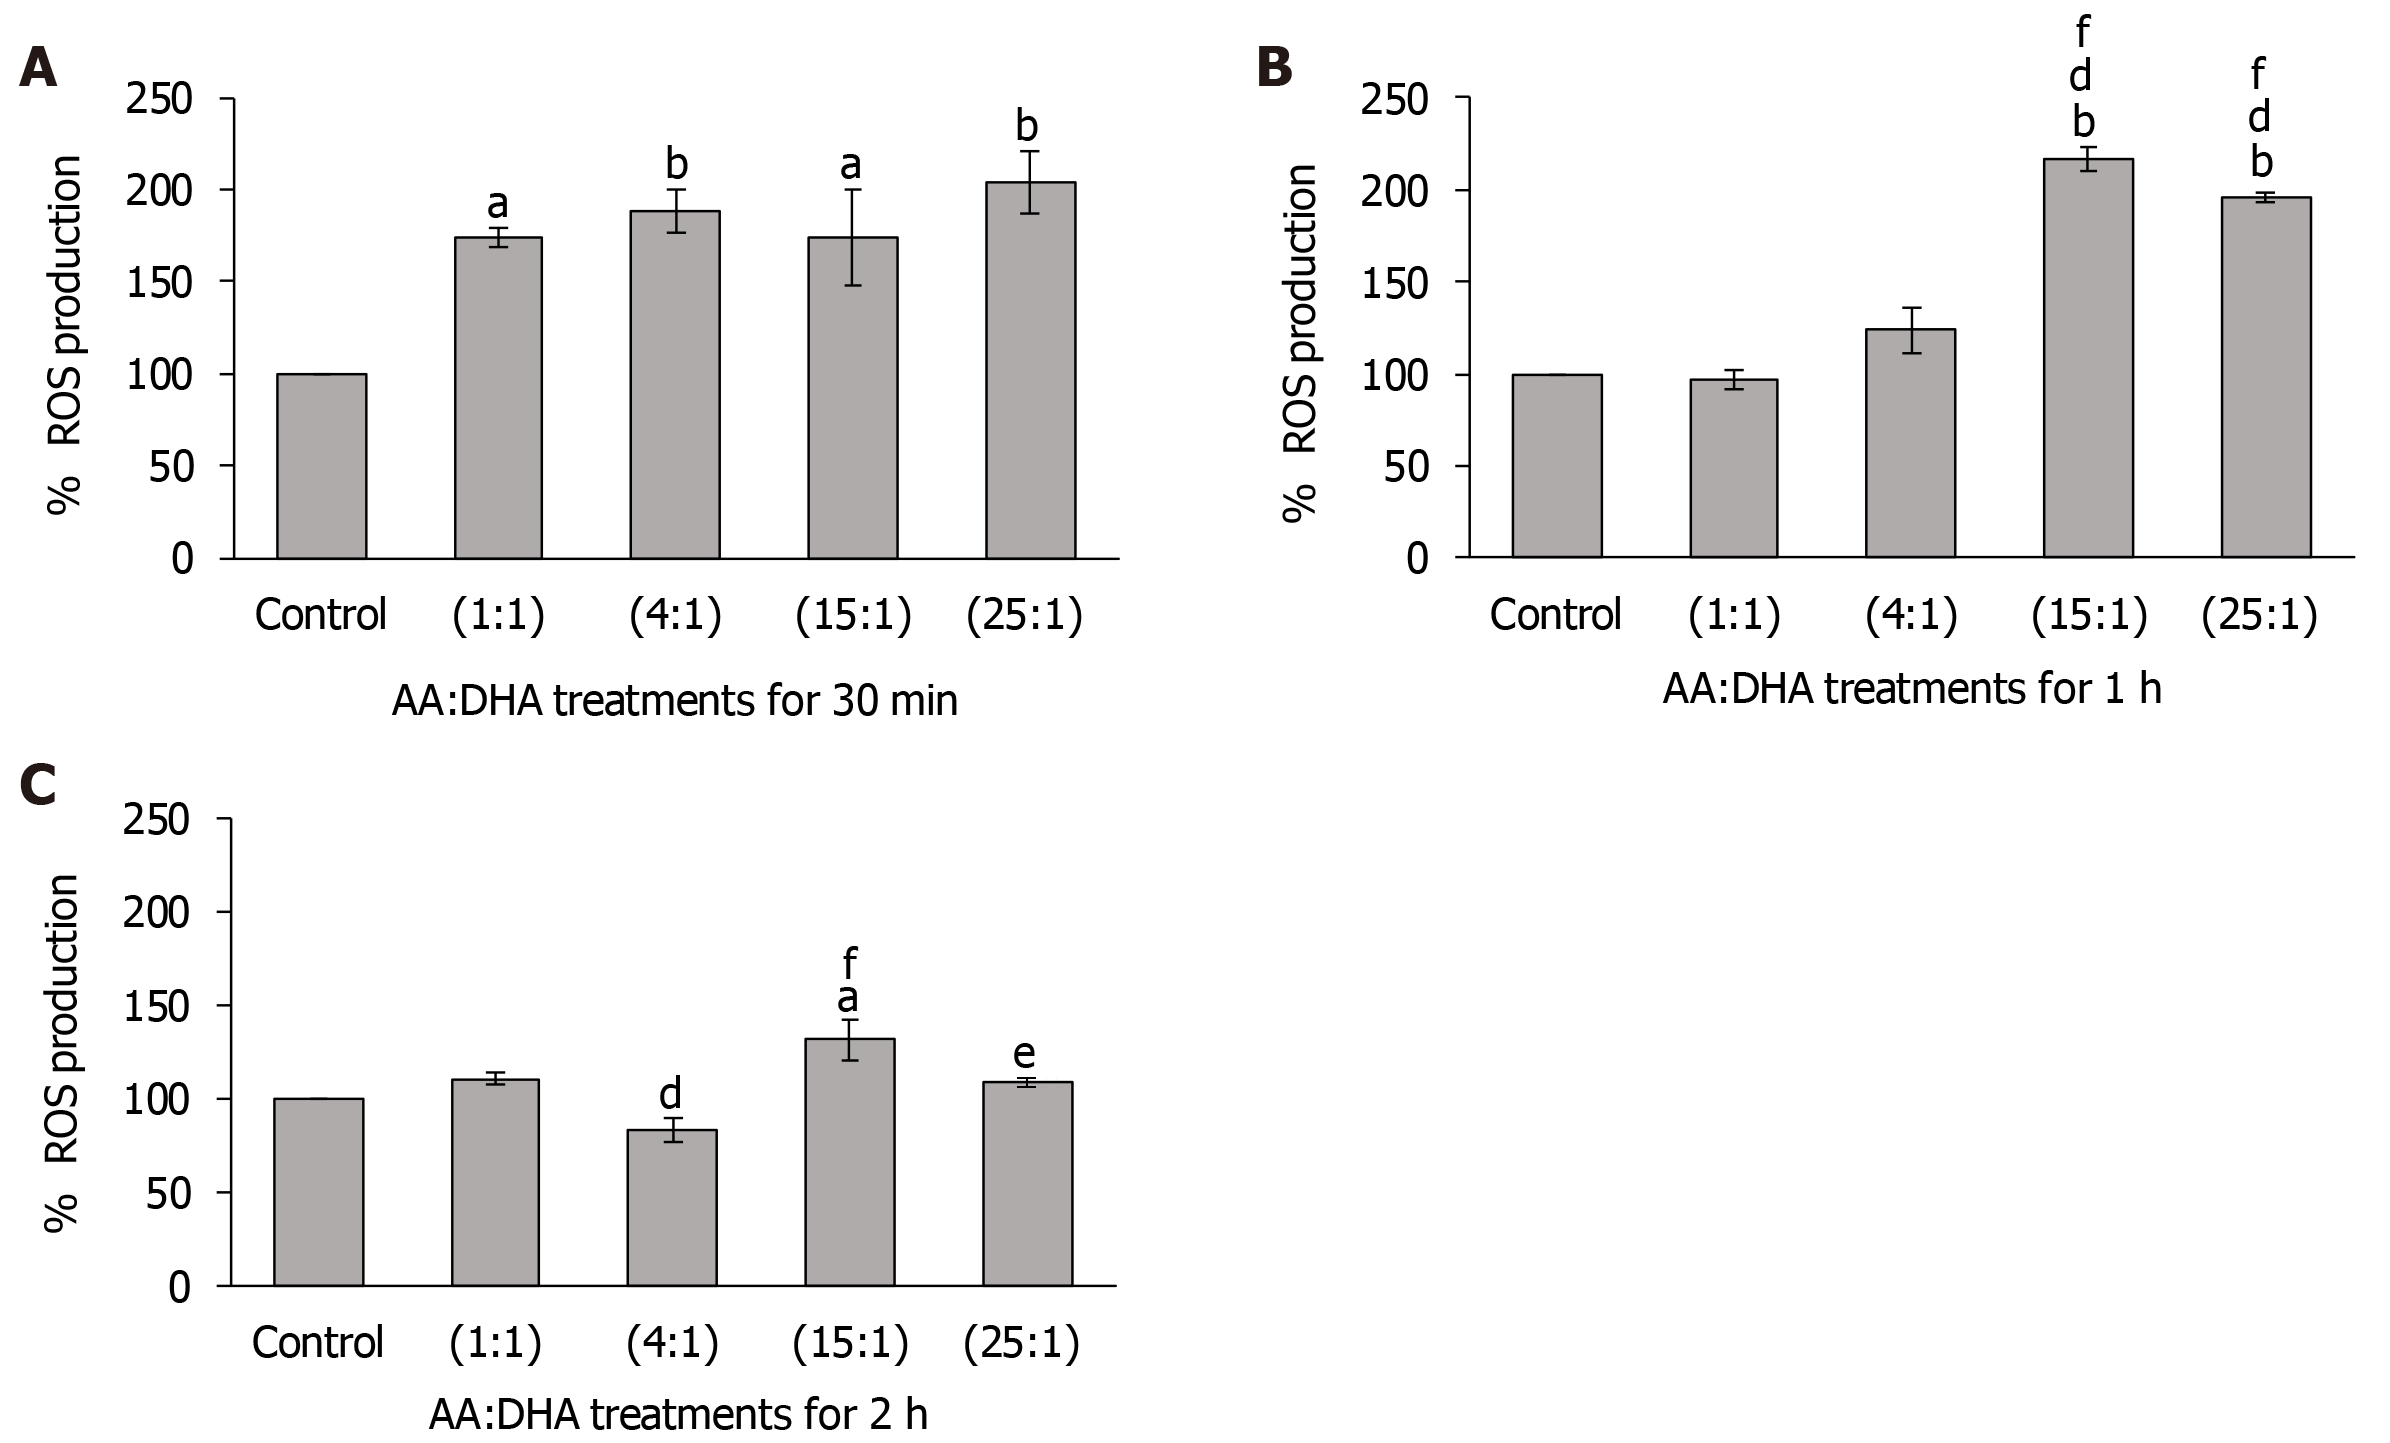
Figure 4 Effect of arachidonic acid: docosahexaenoic acid ratios on ROS production.
A-C: VL17-A cells were treated with different ratios of arachidonic acid: docosahexaenoic acid for 30 min (A), 1 h (B) and 2 h (C), and ROS levels were measured. aP < 0.05 and bP < 0.01 compared to control; dP < 0.01 compared to 1:1; eP < 0.05 and fP < 0.01 compared to 4:1 ratio. Data is presented as mean ± SE (n = 3). AA: Arachidonic acid; DHA: Docosahexaenoic acid.
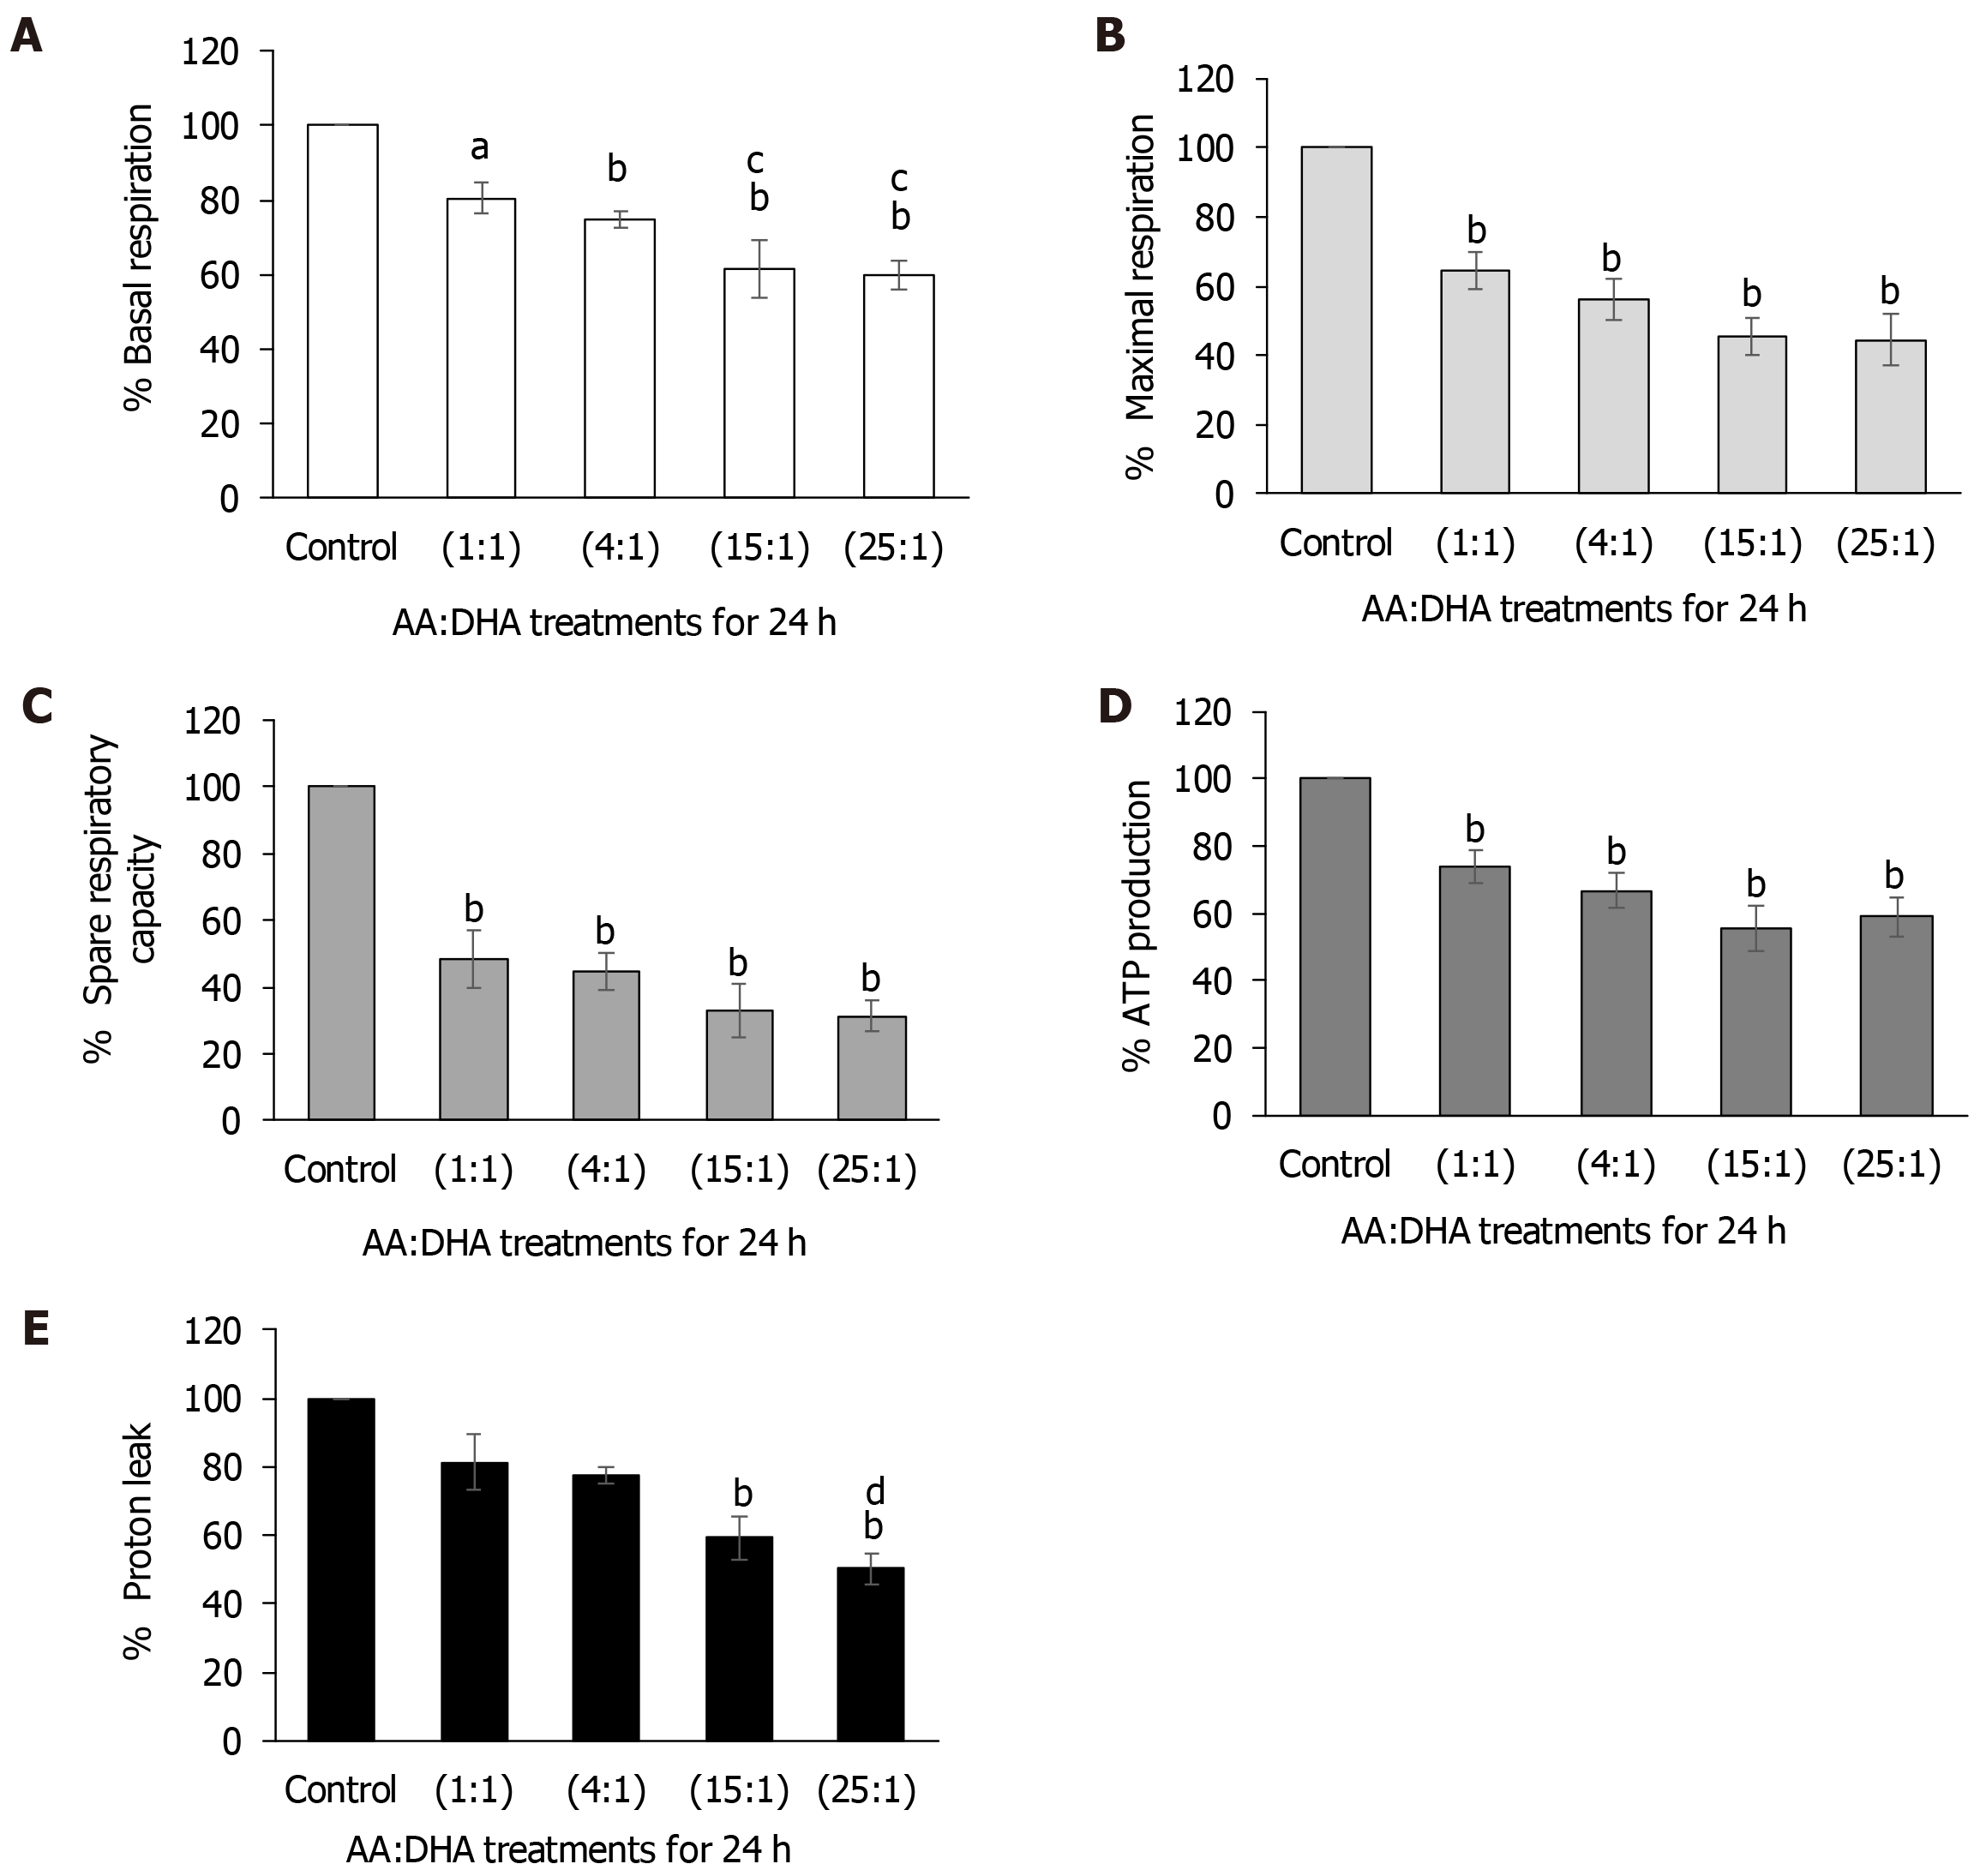
Figure 5 Effect of arachidonic acid: docosahexaenoic acid ratios on mitochondrial respiratory functions.
VL17-A cells were treated with different ratios of arachidonic acid: docosahexaenoic acid for 24 h and various parameters that determine the mitochondrial respiratory functions were examined. A: Elevation in AA:DHA ratios caused a gradual and significant decrease in basal respiration when compared to control. Similar results were observed when compared to treatment with 1:1 ratio, whereby basal respiration significantly reduced with 15:1 and 25:1 ratios; B: Maximal respiration decreased gradually with 1:1, 4:1, 15:1 and 25:1 ratios (by 35%, 44%, 54%, and 56%, respectively); C: Spare respiratory capacity showed a similar pattern of significant reductions (by 52%, 56%, 67%, and 68% over the increasing AA/DHA ratios; D: ATP production significantly reduced with elevation in AA:DHA 1:1, 4:1, 15:1, 25:1 ratios (by 25%, 33%, 44% and 41%, respectively); E: Proton leak decreased significantly with high omega ratio of 15:1 compared to control, and with 25:1 by 50% and 31%, when compared to control and 1:1 ratio, respectively. aP < 0.05 and bP < 0.01 compared to control; cP < 0.05 and dP < 0.01 compared to 1:1 ratio. Data is presented as mean ± SE (n = 4-5). AA: Arachidonic acid; DHA: Docosahexaenoic acid.
- Citation: Ghazali R, Mehta KJ, Bligh SA, Tewfik I, Clemens D, Patel VB. High omega arachidonic acid/docosahexaenoic acid ratio induces mitochondrial dysfunction and altered lipid metabolism in human hepatoma cells. World J Hepatol 2020; 12(3): 84-98
- URL: https://www.wjgnet.com/1948-5182/full/v12/i3/84.htm
- DOI: https://dx.doi.org/10.4254/wjh.v12.i3.84


