Copyright
©The Author(s) 2020.
World Journal of Hepatology. Feb 27, 2020; 12(2): 34-45
Published online Feb 27, 2020. doi: 10.4254/wjh.v12.i2.34
Published online Feb 27, 2020. doi: 10.4254/wjh.v12.i2.34
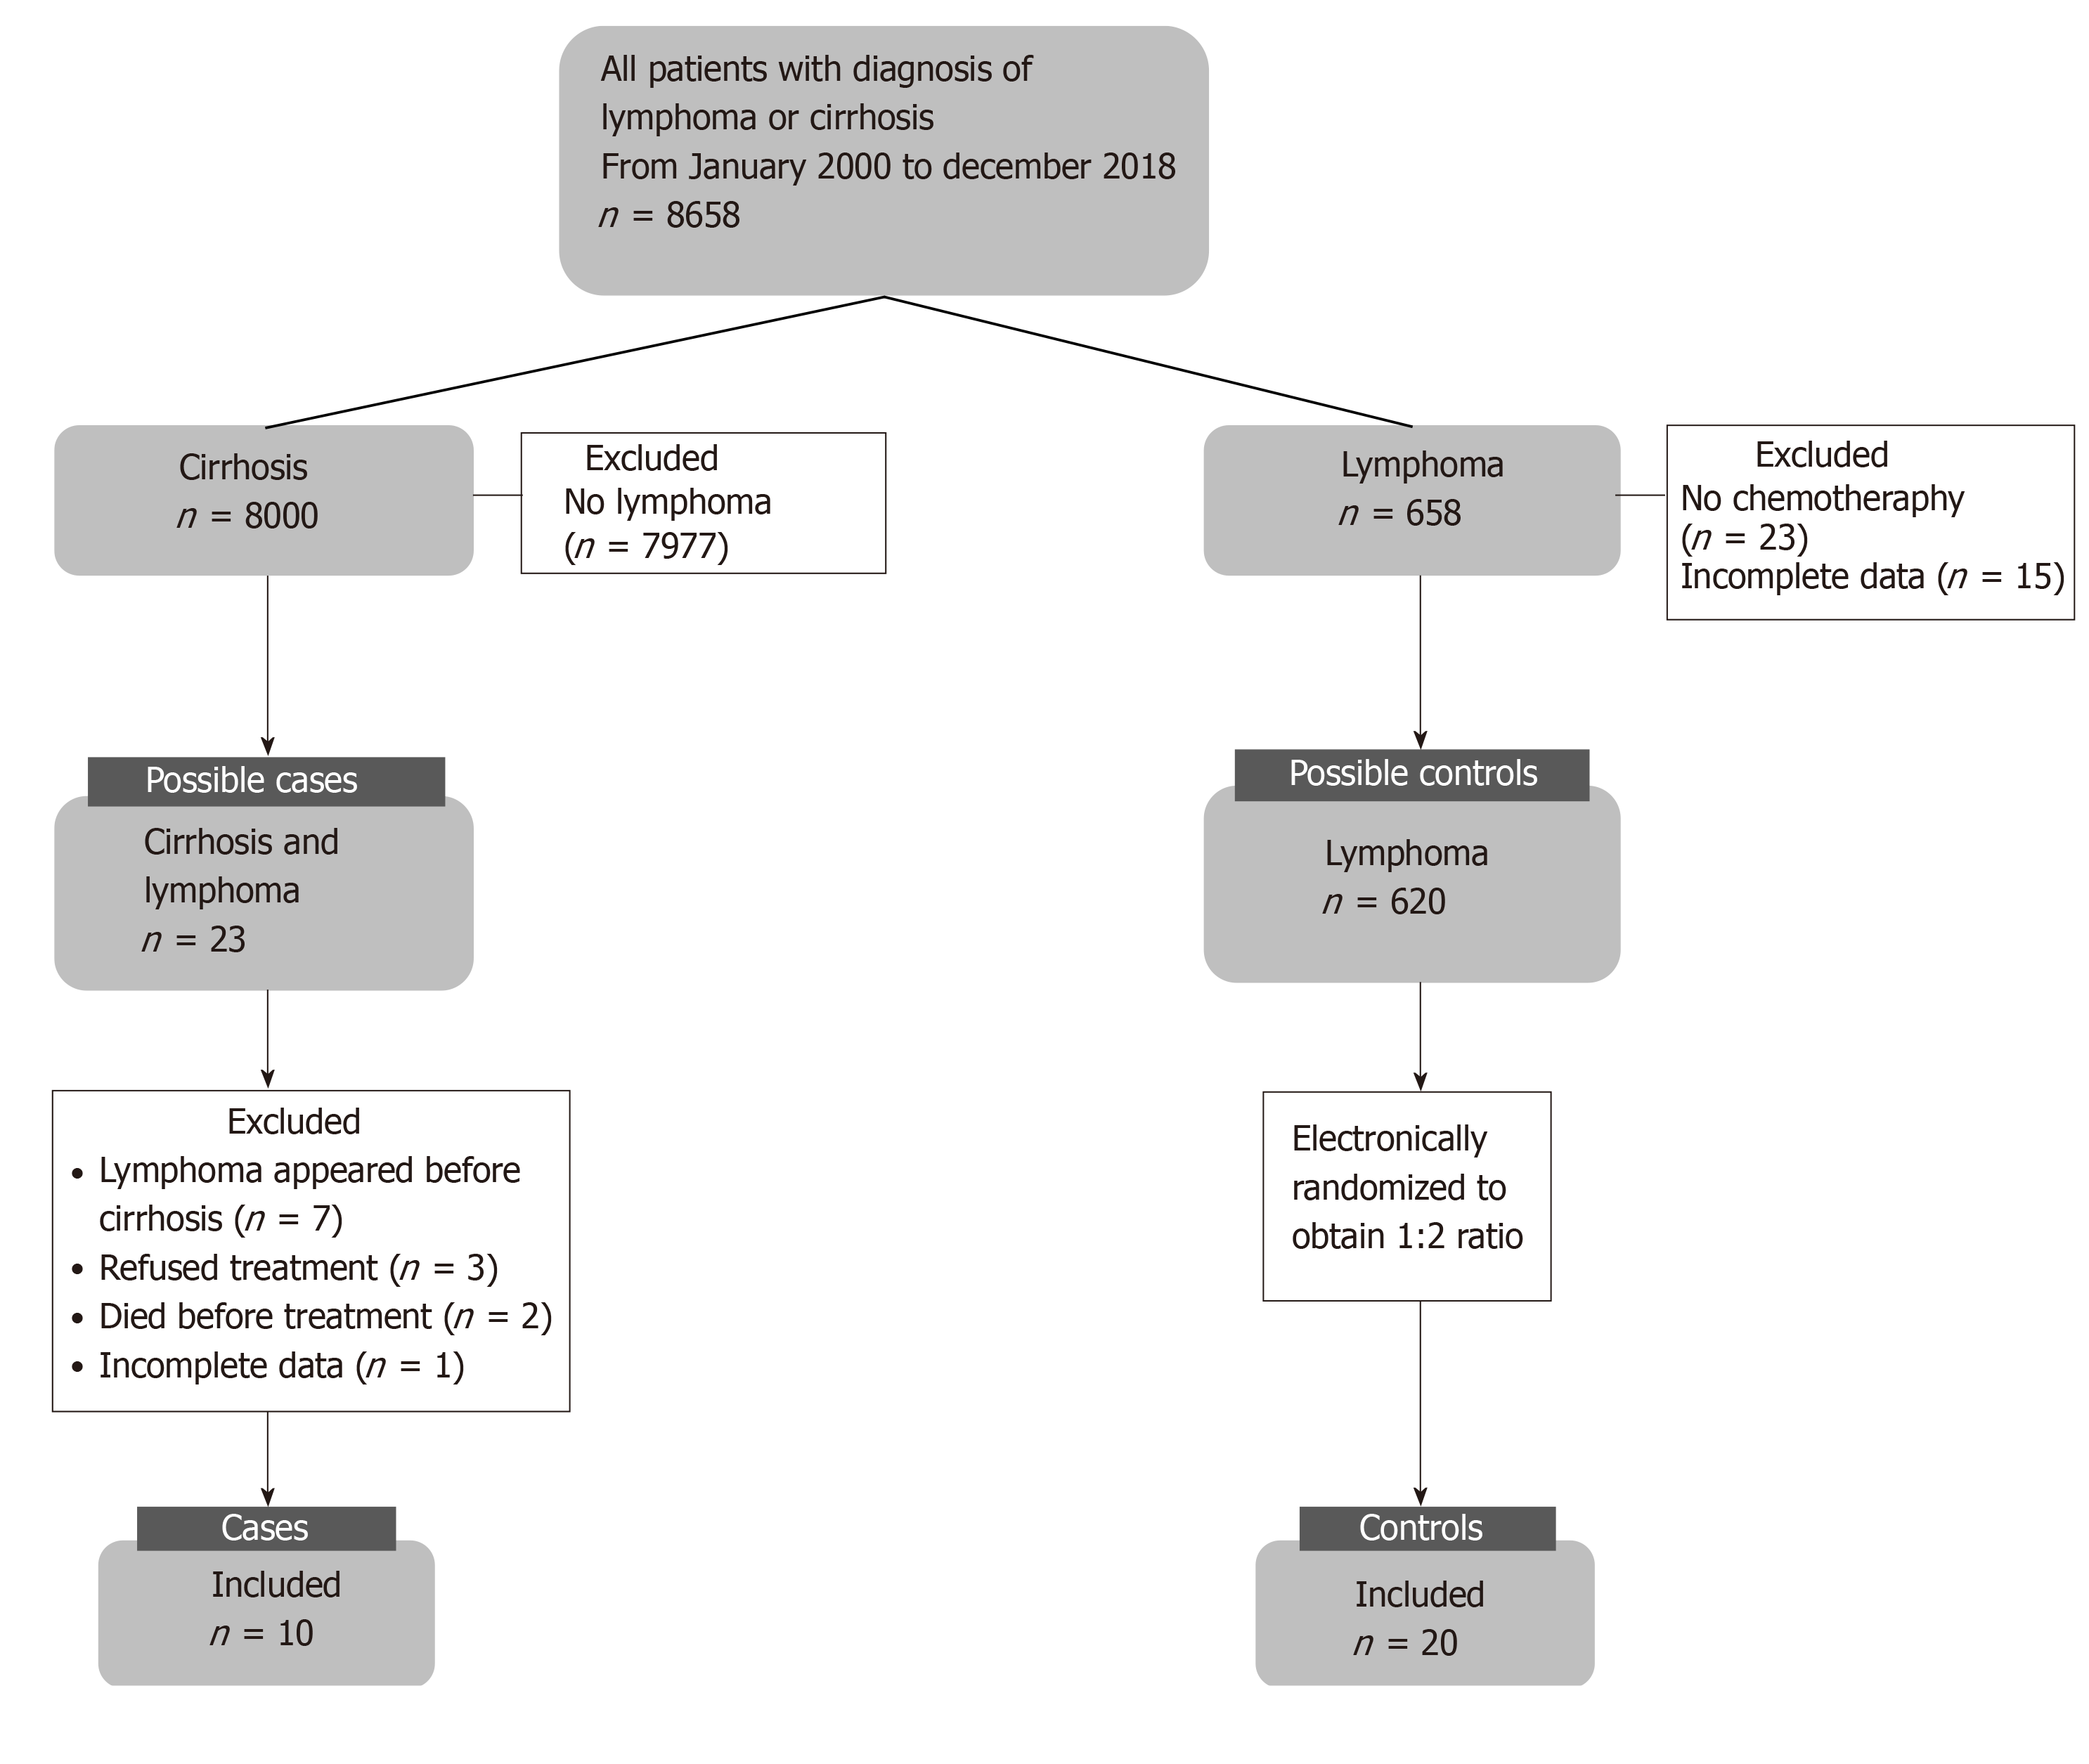
Figure 1 Flowchart for patient inclusion in the study.
Flowchart showing the inclusion criteria of patients in the control group (n = 20) and the case group (n = 10). We reviewed 8000 medical records of patients with cirrhosis, 23 of whom had a concomitant diagnosis of lymphoma and only 10 met the inclusion criteria for the study. Additionally, we reviewed 658 medical records of patients with lymphoma, of which 620 were possible control candidates, and only 20 were electronically randomized to maintain a 1:2 ratio of cases and controls.
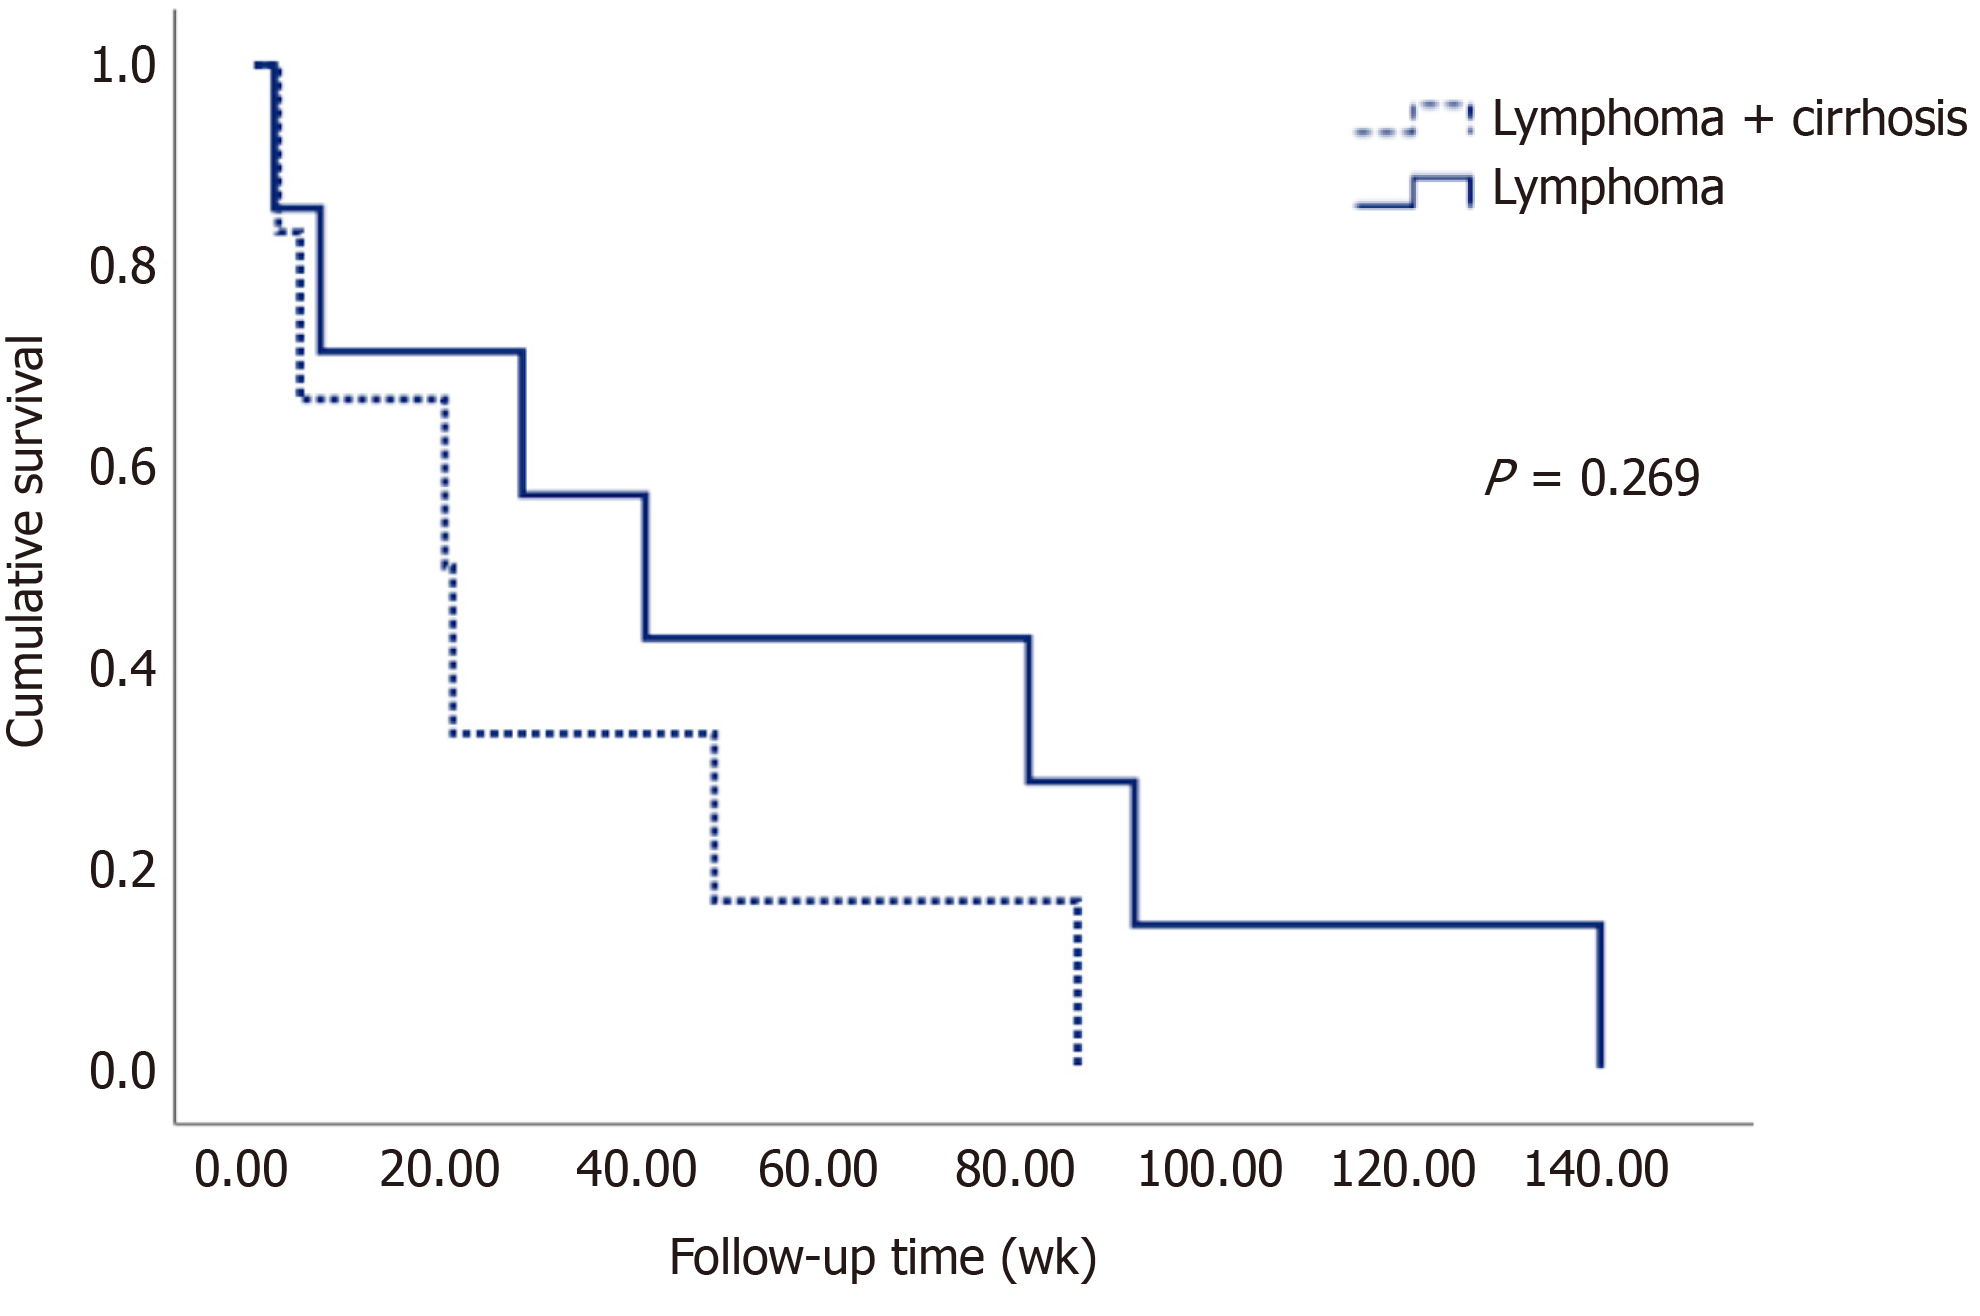
Figure 2 Kaplan-Meier survival curve.
Kaplan-Meier curve showing survival in both groups during 140 wk of follow-up.
- Citation: González-Regueiro JA, Ruiz-Margáin A, Cruz-Contreras M, Montaña-Duclaud AM, Cavazos-Gómez A, Demichelis-Gómez R, Macías-Rodríguez RU. Clinical characteristics and treatment outcomes in patients with liver cirrhosis and lymphoma. World Journal of Hepatology 2020; 12(2): 34-45
- URL: https://www.wjgnet.com/1948-5182/full/v12/i2/34.htm
- DOI: https://dx.doi.org/10.4254/wjh.v12.i2.34


