Copyright
©The Author(s) 2018.
World J Hepatol. Jan 27, 2018; 10(1): 22-33
Published online Jan 27, 2018. doi: 10.4254/wjh.v10.i1.22
Published online Jan 27, 2018. doi: 10.4254/wjh.v10.i1.22
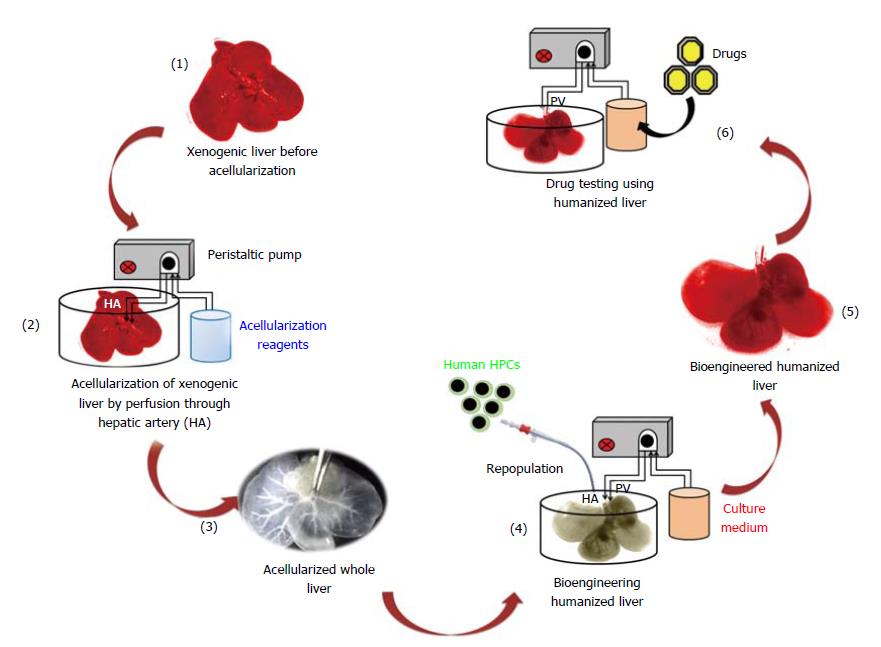
Figure 1 Schematic study plan.
Representation of bioengineering technology to generate humanized livers using acellularization and human HPCs repopulation strategy for the development of three-dimensional platform for drug testing.
Figure 2 Xenogenic liver before and after perfusion acellularization.
Macroscopic appearance (optical) of acellularized liver showing removal of hematopoietic, liver parenchyma and non-parenchyma cells while retaining the vascular tree. Histological comparison of native and acellularized liver. The expression and distribution of liver extracellular matrix proteins such as collagen type 1 was seen in the parenchymal space as well as around the blood vessels. Fibronectin staining demonstrated conserved meshwork in sinusoidal spaces and biliary ducts post-acellularization. Laminin staining showed intact vasculature throughout the liver scaffold (magnification: 10 ×).
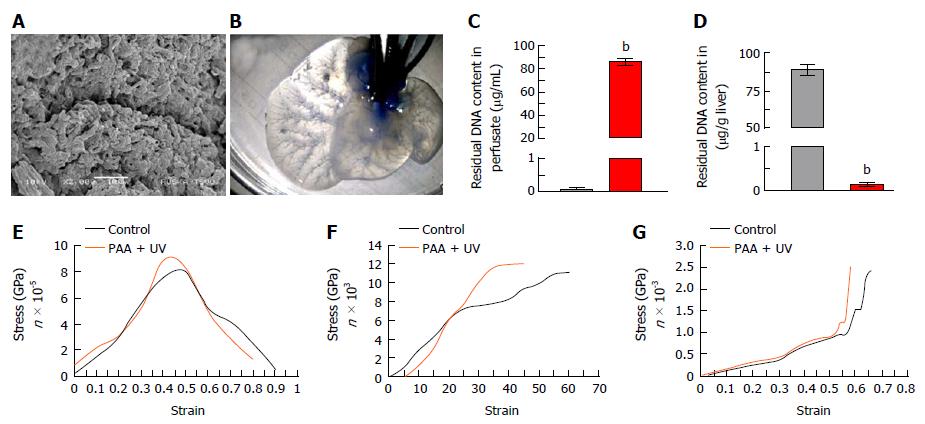
Figure 3 Characterization of acellularized liver scaffold.
A: Ultra-structural characterization of acellularized xenogenic liver showing acellularity in the scaffold with preserved three-dimensional microanatomy of the portal tract surrounded by lobular structures. The parenchymal spaces were found enriched with connective tissue fibres arranged with honeycomb-like structures which are an exceptionally preserved anatomy of connective tissues which structures the hepatocyte-free spaces; B: Methylene blue dye infusion showing intact vasculature post-acellularization; Residual DNA content in liver perfusate (C) and in liver tissues (D) before (black bar) and after acellularization (red bar) (bP < 0.0001); E: Mixed tensile strength; F: Mixed suture retention strength; G: Mixed comprehensive strength plots showing higher degree of retention of mechanical properties post-acellularization.
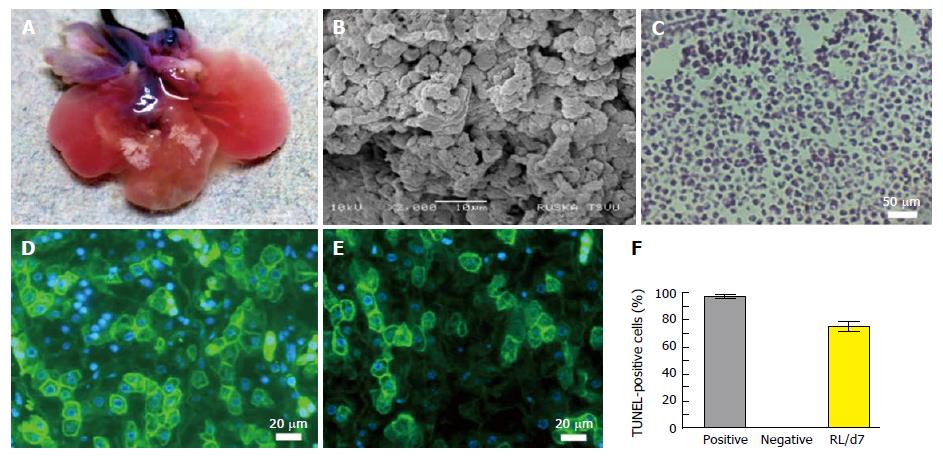
Figure 4 Characterization of humanized liver.
A: Optical image of humanized liver after 7 d of repopulation with human HPCs into a customized bioreactor; B: SEM image of humanized liver at day 7 showing cellular proliferation and natural arrangements; C: H and E staining of thin micro-section of humanized liver (Magnification: 10 ×); Albumin (D) and G6PC (E) immunofluorescence staining (green) representing the functional activity of repopulated human liver cells (Magnification: 20 ×); F: TUNEL staining of repopulated cells at day 7 (RL/d7) showed significantly high expression as compared with the negative control. SEM: Scanning electron microscopy.
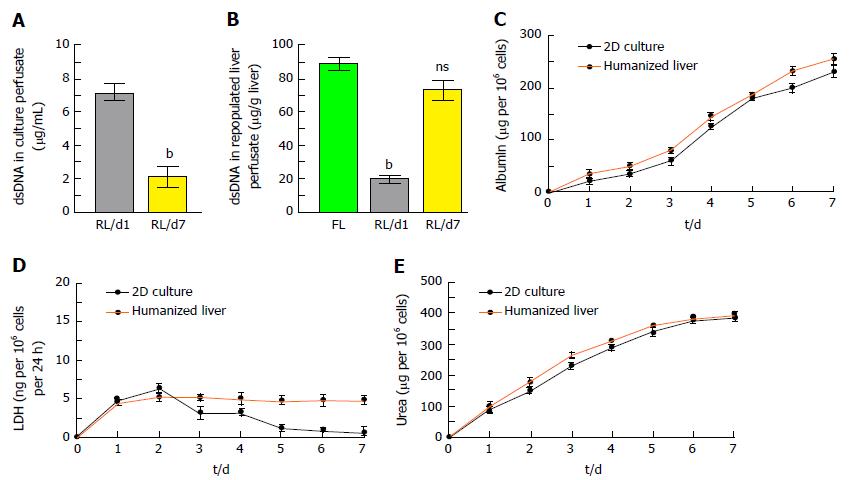
Figure 5 Functional assessment of humanized liver.
A and B: Quantification of double stranded DNA (dsDNA) in (A) liver perfusate showing reduction in quantity at day 7 whereas (B) in humanized liver post-repopulation showed reciprocal relationship which was significantly high (bP < 0.001) at day 7 as compared to day 1 and was almost similar to the fresh liver (FL); C-E: The rate of (C) albumin secretion (D) lactate dehydrogenase release and (E) urea synthesis in humanized livers at different time points showing improved response as compared to the conventional 2D-cultures.
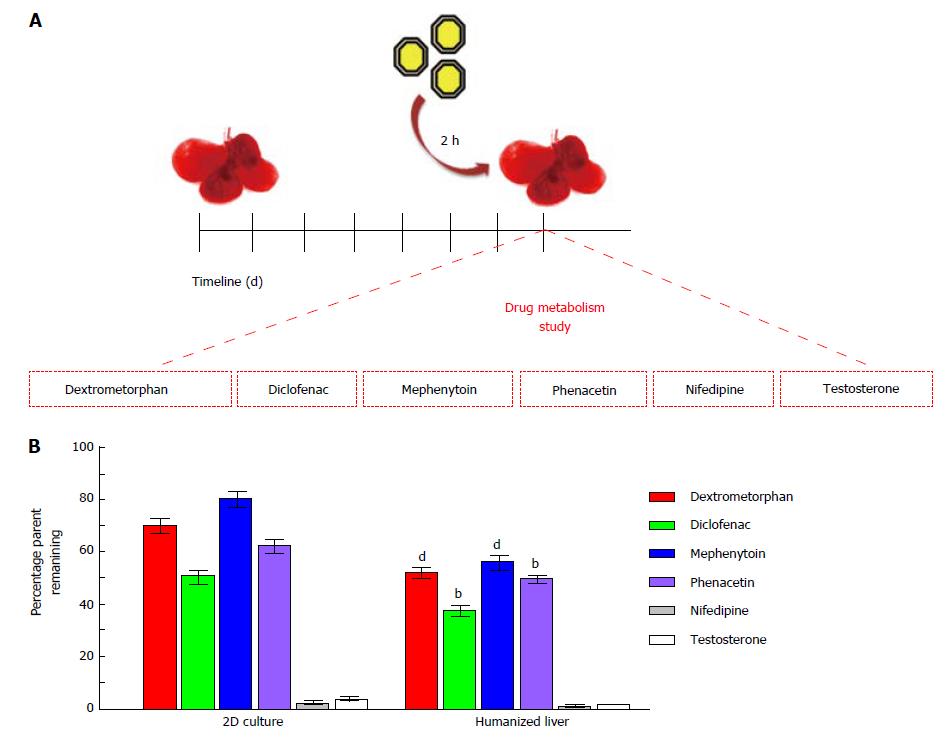
Figure 6 Drug metabolism studies using 3D humanized liver system.
A: Schematic representation showing the timeline of humanized liver development and drug metabolism study; B: Bar graphs showing the rate of cellular metabolism of six cytochrome P-450 probe substrates in humanized liver as compared to 2D-culture system (bP < 0.01, dP < 0.001).
- Citation: Vishwakarma SK, Bardia A, Lakkireddy C, Nagarapu R, Habeeb MA, Khan AA. Bioengineered humanized livers as better three-dimensional drug testing model system. World J Hepatol 2018; 10(1): 22-33
- URL: https://www.wjgnet.com/1948-5182/full/v10/i1/22.htm
- DOI: https://dx.doi.org/10.4254/wjh.v10.i1.22


