Published online Apr 15, 2003. doi: 10.3748/wjg.v9.i4.836
Revised: November 26, 2002
Accepted: December 3, 2002
Published online: April 15, 2003
AIM: To explore the pathophysiologibasis for the fact that patients with digestive tract symptoms do not necessarily have gastric mucosal pathology and those without clinical symptoms do not necessarily have no gastric mucosal pathology.
METHODS: The ultrastructure, trace elements, cAMP, DNA, SOD and LPO in the gastric mucosa and its epithelial cells of 188 patients without organic lesions of heart, lung, liver, gallbladder, pancreas, kidney or intestine and basically histopathological normal persons (F) were detected synchronously by SEM, TEM, EDAX, Image analysis system RIA and 3H-TdR Lymphocyte Transfer Test.
RESULTS: The content of Zn, Cu, cAMP and 3H-TdR LCT in gastric mucosa and the content of Zn, Cu, DNA and LPO in gastric mucosa epithelial nuclei of each group were shown as belows: Normal control (4.1 ± 1.0, 5.2 ± 0.8, 15.9 ± 1.5, 1079.7 ± 227.4, 7.6 ± 0.4, 58.4 ± 0.3, 12.6 ± 2.7, 2.6 ± 0.6); CSG without symptoms group (3.7 ± 1.2, 5.1 ± 1.8, 15.6 ± 0.9, 924.5 ± 234.9, 7.8 ± 0.3, 58.6 ± 0.4, 13.0 ± 3.1, 2.9 ± 0.4); CAG without symptoms group (3.3 ± 1.0, 4.8 ± 0.9, 14.9 ± 0.7, 887.7 ± 243.6, 7.8 ± 0.3, 58.7 ± 0.3, 14.3 ± 2.8, 3.1 ± 0.4); F type with symptoms group (3.5 ± 1.4, 4.5 ± 1.0, 15.7 ± 1.4, 932.1 ± 2449.3, 7.9 ± 0.4, 58.7 ± 0.5, 13.5 ± 4.6, 2.9 ± 0.7); CSG with symptoms group (2.8 ± 1.9, 4.0 ± 1.5, 14.2 ± 1.8, 867.3 ± 240.5, 8.1 ± 0.5, 58.9 ± 0.5, 15.2 ± 3.2, 4.2 ± 0.7); CAG with symptoms group (2.0 ± 1.8, 3.4 ± 1.5, 13.4 ± 1.8, 800.9 ± 221.8, 8.6 ± 0.4, 59.3 ± 0.5, 16.5 ± 3.1, 4.5 ± 0.6). The contents of Zn, Cu in mitochonondria and SOD in gastric mucosa of each group were shown as belows: Normal control group (9.2 ± 0.5, 58.3 ± 0.3, 170.5 ± 6.1), CSG without symptoms group (8.9 ± 0.5, 58.2 ± 0.3, 167.2 ± 5.3), CAG without symptoms group (8.8 ± 0.4, 57.5 ± 0.2, 166.1 ± 4.2); F type with symptoms group (8.9 ± 0.5, 58.0 ± 0.3, 167.9 ± 5.7), CSG with symptoms group (8.6 ± 0.5, 57.8 ± 0.3, 163.3 ± 5.6); CAG with symptoms group (8.3 ± 0.4, 57.5 ± 0.3, 161.2 ± 4.3). There were significant differences in these cases, P < 0.05-0.001. There were synchronous changes of gastric mucosa epithelial cellular ultrastructure. The “background lesions” (focal atrophic gastritis, focal intestinal metaplasia, micro-ulcer) in nonfocal gastric mucosa of all groups had significant differences (P < 0.05-0.001).
CONCLUSION: Disease with symptoms, disease without symptoms, nondisease with symptoms occur on the basis of the quantitative changes of gastric mucosa epithelial cellular ultrastructure and related bioactive substances.
- Citation: Yin GY, Zhang WN, He XF, Chen Y, Shen XJ. Study on the classification of chronic gastritis at molecular biological level. World J Gastroenterol 2003; 9(4): 836-842
- URL: https://www.wjgnet.com/1007-9327/full/v9/i4/836.htm
- DOI: https://dx.doi.org/10.3748/wjg.v9.i4.836
After undergoing gastroscopy with mucosal biopsy, patients with digestive traet symptoms and volunteer blood donors without any clinical symptoms were found to be of two types: those with gastric mucosa pathological changes, and others without evident pathology . In order to explore the pathophysiological basis, we detected synchronously the epithelial cell ultrastracture, trace element, cAMP, DNA, gastric mucosa SOD, serum LPO and 3H-TdRLCT by means of histopathology, SEM, TEM with EDAX, image analysis technique, RIA and chemiluminescence method. The results were reported as follows.
188 patients with digestive tract symptoms, had been ruled out from organic lesions of heart, lung, liver, gallbladder, pancreas, kidney or intestine by physical examination, fluoroscopy of chest, GI x-ray examination, type ultrasonography, blood biochemistry, gastroscopy with histopathological examination. According to diagnostic criteria of “the standards for the classification of chronic gastritis, gastroscopy antrophic gastritis”, 68 cases were diagnosed as CSG (43 males, 25 females, average age 43, average course of disease 4a); 64 cases as CAG (37 males, 27 females, average age 47, average course of disease 6a.); 56 cases as having basically normal gastric mucosa (F group) (22 males, 34 females, average age 39, average course of disease 2a). Among 42 volunteer blood donors without any clinical symptoms, through gastroscopy and histopathological biopsy, 18 cases were diagnosed as CSG (13 males, 5 females, average age 39), 9 cases as CAG (7 males, 2 females, average age 41); 15 cases as having basically normal gastric mucosa (6 males, 9 females, average age 37) thus also referred to as normal control group (NC group).
Daring gastroscopy, three pieces of gastric mucosa were taken from the focal, nonfocal areas of antral region of stomach and body of stomach for histopathological examination, SEM, TEM, the determination of cAMP and SOD. Blood specimens were taken to determine LPO and 3H-TdRLCT. For the study of gastric mucosa ultrastructure and determination of its trace elements, 501B SEM with 9100/60 EDAX were used ttaking three pieces of specimens from each patient and determine the weight percentage (WT%)[1-4] of each element between the elements of gastric mucosa. Radioimmuno-assay was adopted to detect gastric mucosa cAMP content (pmol/g)[5], blood 3H-TdRLCT (Bq/L)[5]. For the observation of gastric mucosa epithelial cellular ultrastructure and the determination of its trace elements, EM 430 TEM with 9100/60 EDAX[1-4] were used. The three pieces of mucosa specimens of every patient were magnified in unison by five magnifying powers (3600, 7200, 14000, 19000, 29000) to randomly take pictures of the panoramagram, local area and organelle and to determine the atomic number percentage (AT%) of each nuclear and mitochondrial element between the trace elements. 50 nuclei and 50 mitochondria of each patient were determined, with average WT% of each element taken as its actual WT%. For the determination of DNA in gastric mucosa epithelial nuclei, IBAS 2000 image analysis technique was used to determine IOD with gastric mucosa cell smear after. Feulgen staining, taken as the relative content of nuclear DNA[4]. Chemiluminescence method was adopted to determine the activity of SOD (u/g) in gastric mucosa[5]. Thiobarbituric acid development process was adopted to determine serum LPO (umol/L)[5].
χ2 and t test.
In NC group and F group, there were extremely small number of mononuclear cells and lymphocytes in lamina propria of gastric mucosa, there was no abnormality in gastric gland. Therefore their gastric mucosa were defined as relatively normal. In CG gastric mucosa, in there were various degrees of infiltration of lymphocyte, plasmocyte, eosinophil and neutropil in lamina propria, there were various degrees of degeneration necrosis, erosion and atrophy in mucosa epithelial cells. Glands decreased due to destruction and some glands had cystic dilatation. As for the inflammatory cell infiltration degree in gastric mucosa and the decrease degree of original glands (< 1/3 low-grade, > 1/3 < 2/3 middle-degree, > 2/3 heavy-grade). There was greater significant difference in CSG without symptom (CSG-woS) group, CAG without symptom (CAG-woS) group, CSG with symptom (CSG-wS) group. CAG with smptom (CAG-wS) group than in HC group and F group (P< 0.05-0.001). There was significant difference between the first four groups (P< 0.05-0.001, Table 1).
| Group | n | Degree of inflammatory cell infiltration | Degree decrease of glands propria | ||||
| < 1/3 | > 1/3 < 2/3 | > 2/3 | < 1/3 | 1/3 < 2/3 | > 2/3 | ||
| NC | 15 | ||||||
| CSG-woS | 18 | 11 (61.1) | 6 (33.3) | 1 (5.6) | 1 (5.6) | ||
| CAG-woS | 9 | 5 (55.6) | 3 (33.3) | 1 (11.1) | 5 (55.6)d | 3 (33.3) | |
| F-TwS | 56 | ||||||
| CSG-wS | 68 | 26 (38.2)c | 32 (47.1) | 10 (14.7) | |||
| CAG-Ws | 64 | 19 (29.7)df | 21 (32.8) | 24 (37.5)df | 23 (35.9)d | 23 (35.9) | 18 (28.1) |
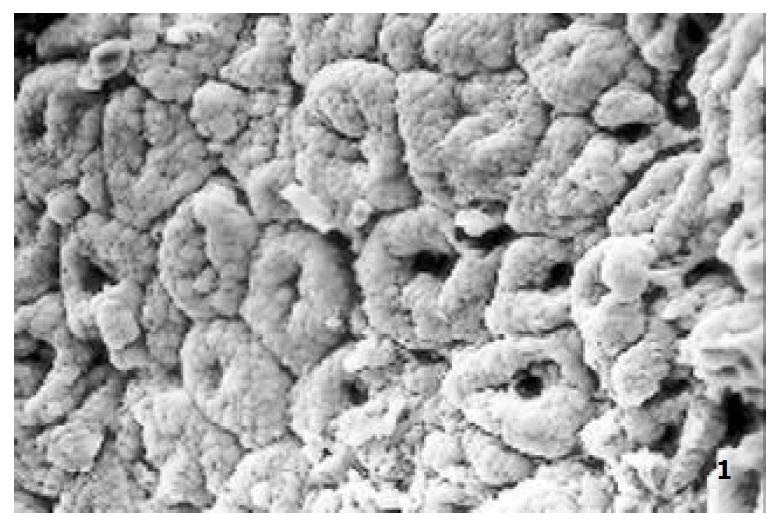
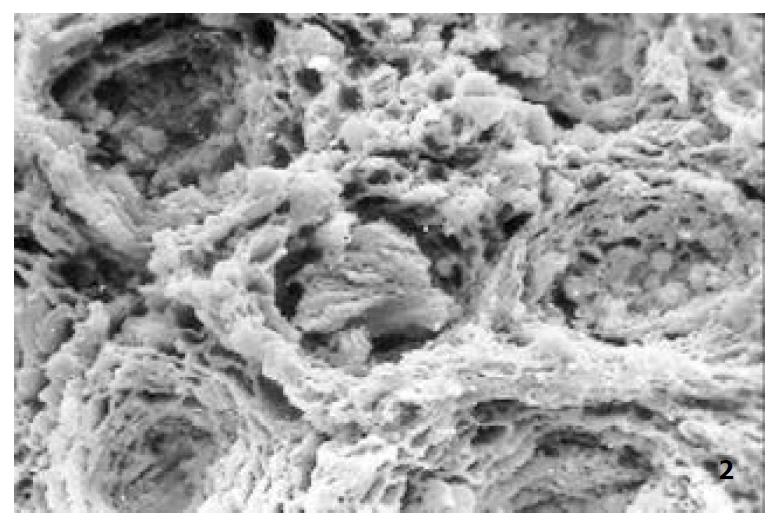
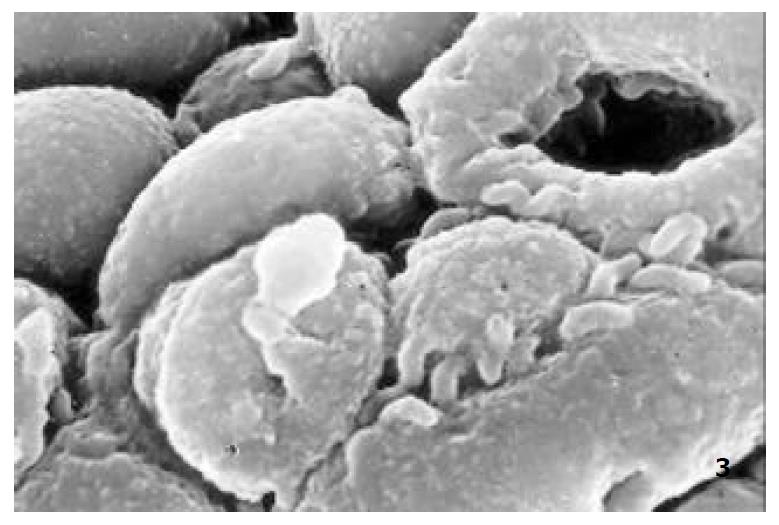
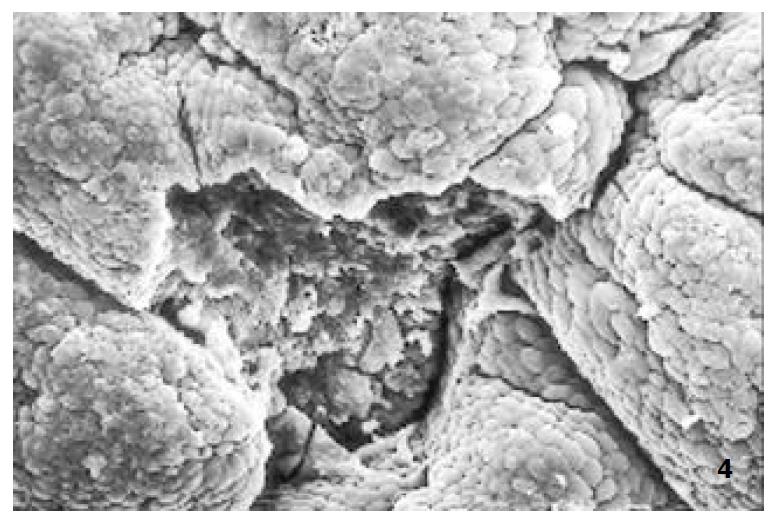
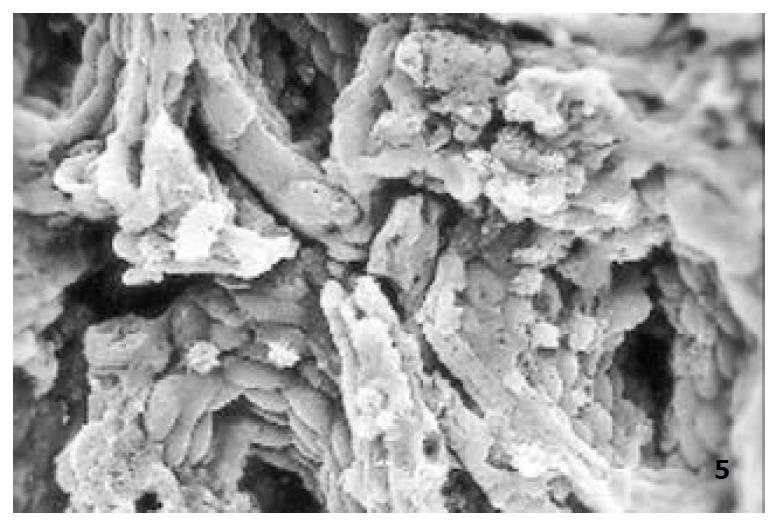
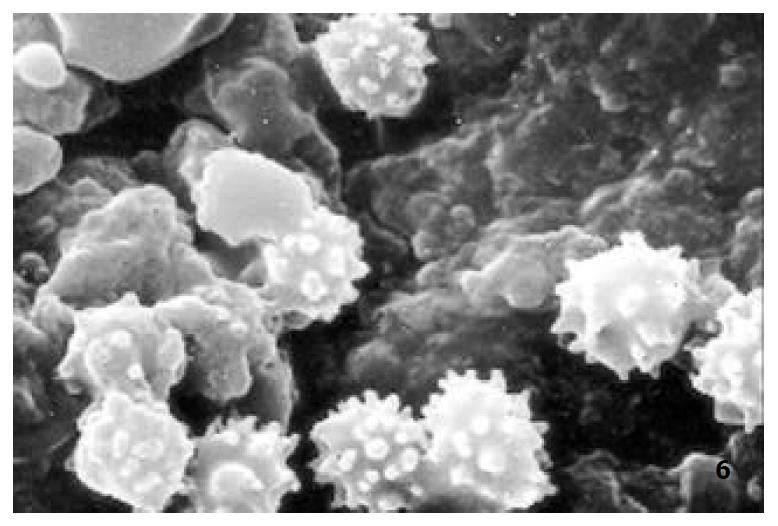
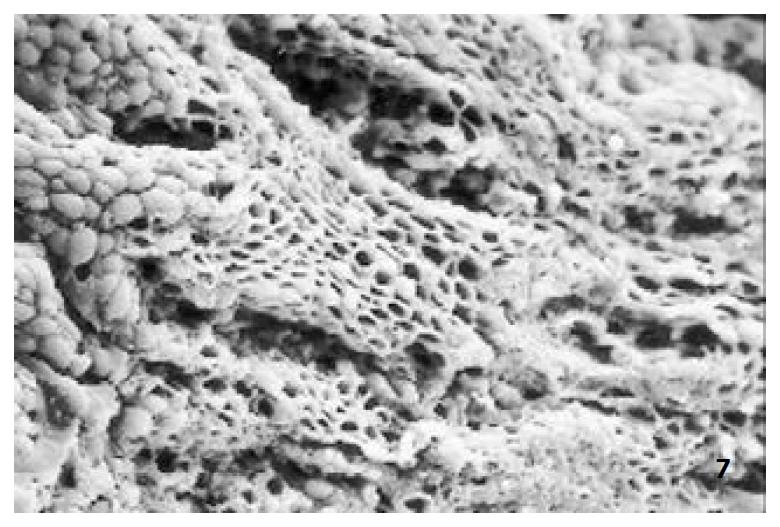
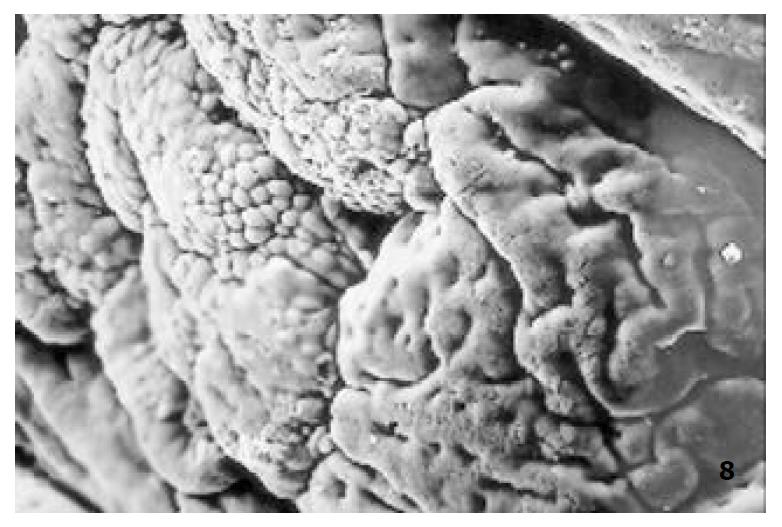
The relatively normal gastric mucosa had clear surface, which was divided by crisscross small groves into many lesser gastric areas, assuming convolution shape, in which there were many gastric pits (the mouths of gastric glands). The gastric pits were shaped like craters and their concaver walls had round or oval epithelial cells of almost the same size (Figure 1). When magnified, the surfaces of cells were found to be rough and uneven, with short and thin microvilli as well as many semiciroular cumuli, several micro processus and small fossae. The fossae were marks left by cumuli after rupture and excretion of mucus. The crater periphery projections were shaped like dykes. The gastric antrum mucosa were rough, apparently folded, the small craters were mostly groves of different lengths with deep bottoms. In low power observation, as far as gastric mucosa of chronic gastritis was concerned, the crisscross groves of the focal mucosa are shallow, the convolution structures were smooth and even, craters were deformed and of different sizes at different heights and ill-distributed; the dykes form projections that are undulating, of different width (Figure 2). In high power observation, the focal gastric mucosa had scattering denatured, diabrotic and necrotic exfoliated epithelial cells, on it’s surfaces S-shape helicobacter pylori were found (Figure 3). Massive epithelial cells were diabrotic, anabrotic and exfoliated forming micro ulcers. The ulcers spread from their centers, with adjacent cells crushed and destructed, in irregular shapes and arrangement. The epithelial cells of the crater walls were atrophic and denatured of different sizes and derangement (Figure 4, Figure 5), and the cells became diabrotic and necrotic and had inflammatory cell infiltration (Figure 6). The glands propria of the serious cases were shaped like grid framework structure (Figure 7). The surfaces of the epithelial cells of IM gastric mucosa were covered with a thick coating, villi were invisible, and the intercellular boundaries were not clear (Figure 8). The hollowed crateriform cells were round or polygon cavities, with ejected mucus at mouths scattering like tiny white dots. In nonfocal gastric mucosa, focal atrophic inflammatory changes, IM cell population, micro ulcers and helicobacter pylori (can be found also), they were generally referred to as “background lesion”.
Comparing CSG-woS group, CAG-woS group, CSG-wS group and CAG-wS group, there were significant differences in background lesion of nonfocal gastric antrum mucosa (P< 0.05-0.001). The incidence rate of background lesion of nonfocal gastric mucosa is especially high in CAG-wS group (Table 2).
| Focal lesions | CSG-woS (n = 18) | CAG-woS (n = 9) | CSG-wS (n = 68) | CAG-Ws (n = 64) | ||||
| Gastric antrum | Gastric body | Gastric antrum | Gastric body | Gastric antrum | Gastric body | Gastric antrum | Gastric body | |
| Atrophic | 1 (5.6) | 0 (0.0) | 1 (11.1)a | 0 (0.0) | 21 (30.9)bd | 11 (16.2) | 47 (73.4)bdj | 27 (42.2)j |
| inflammatory lesion | ||||||||
| IM | 4 (22.2) | 1 (5.6) | 5 (55.6)b | 2 (22.2)b | 27 (39.7)bc | 5 (7.4)d | 59 (92.2)bdj | 13 (20.3)b |
| Micro ulcer | 1 (5.6) | 1 (5.6) | 3 (33.3)b | 1 (11.1)a | 11 (16.2) | 2 (2.9)c | 28 (43.8)bdj | 9 (14.1)aj |
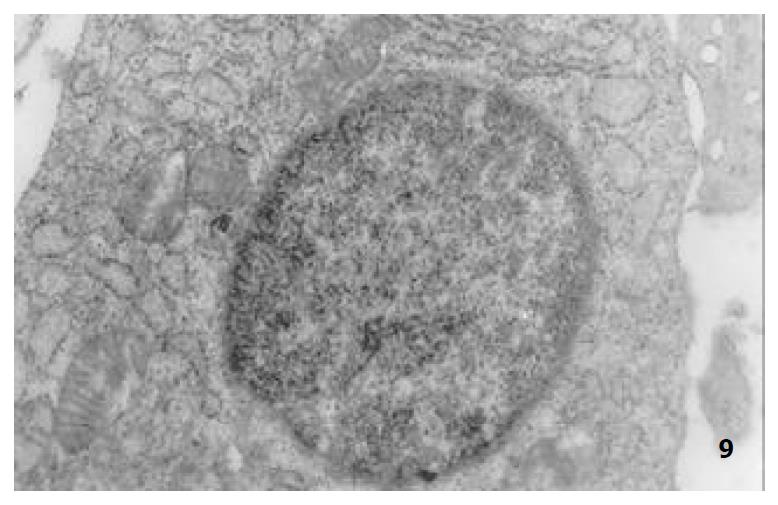
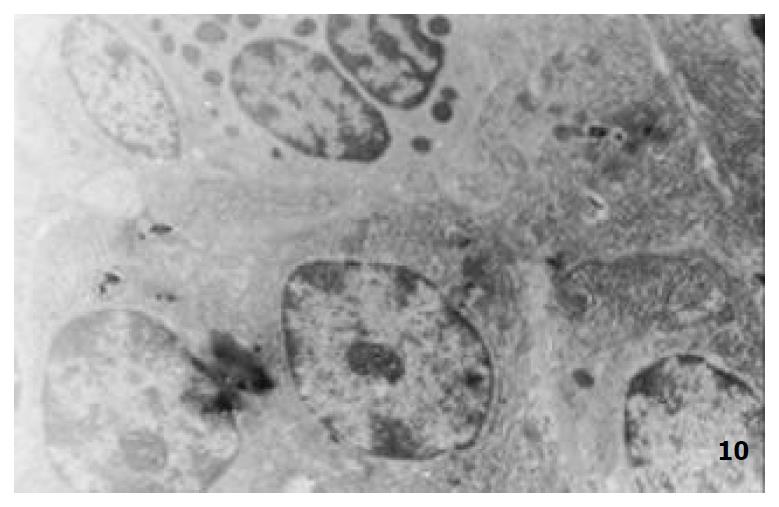
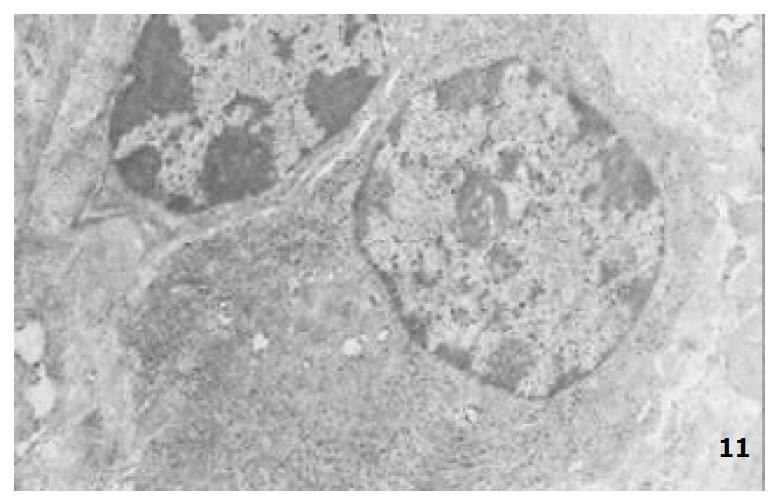
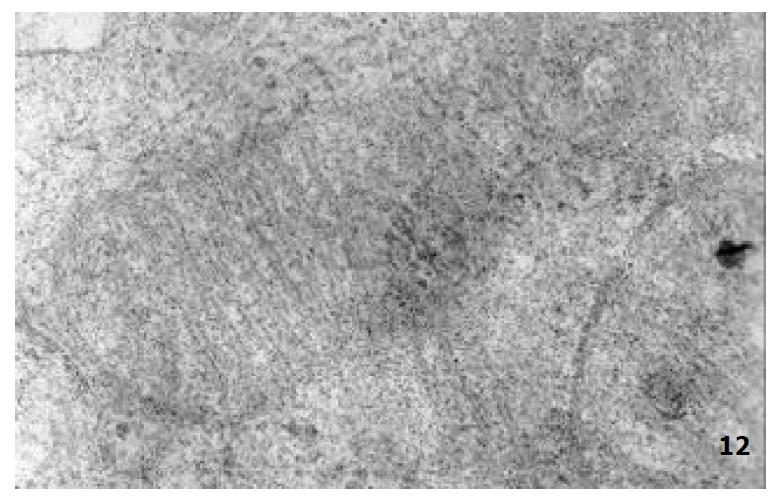
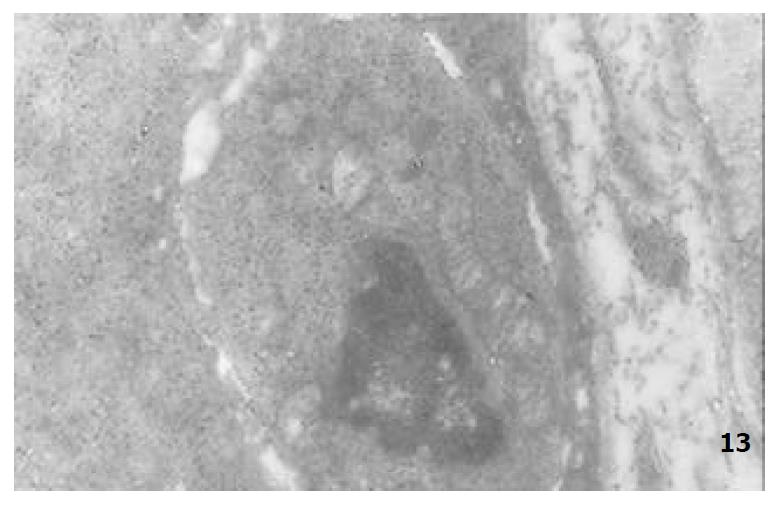
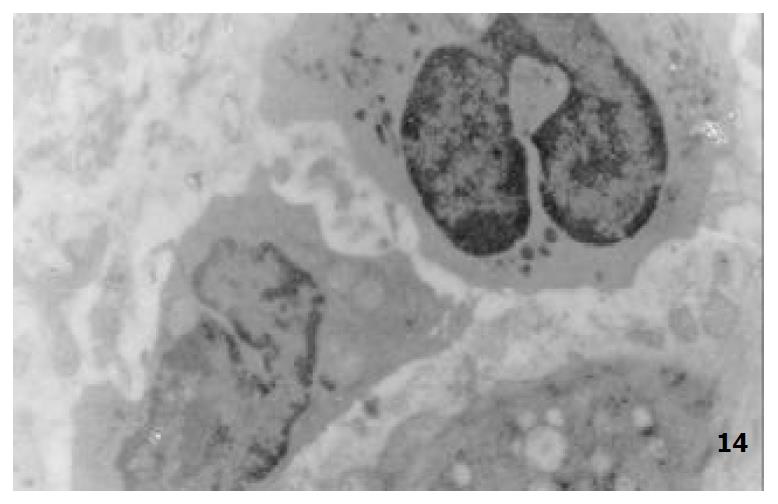
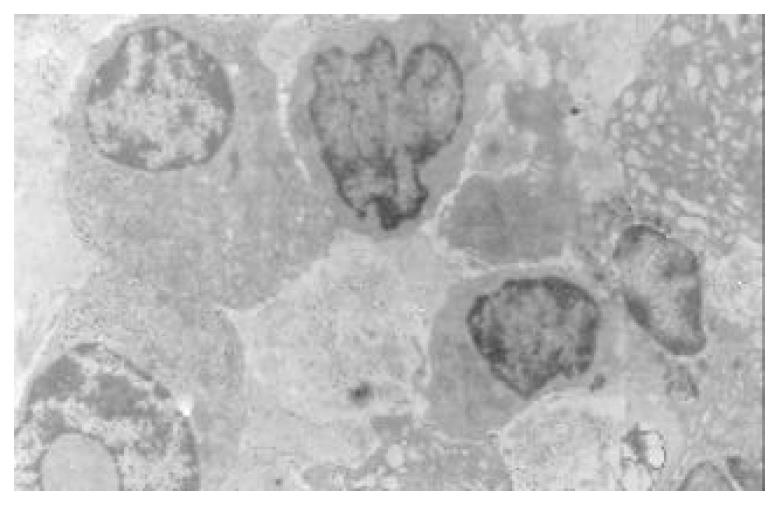
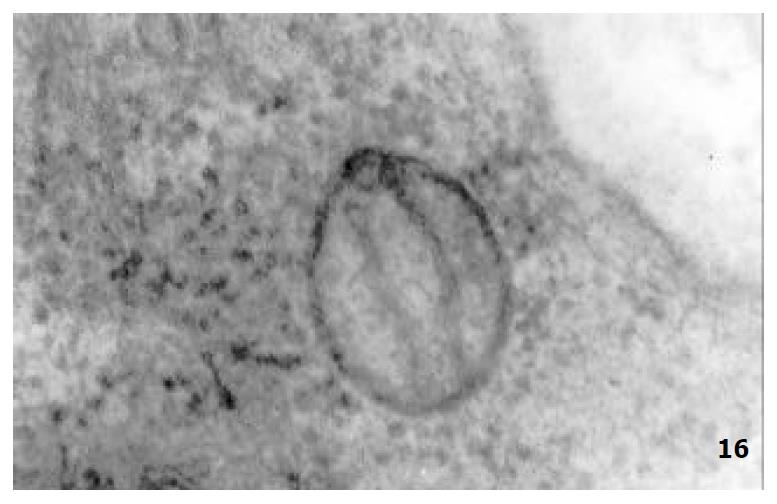
The mucous cells on epithelial cell surface of relatively normal gastric mucosa were columanar epithelial cells covering endogastric surfaces and inside wall of gastric pits. Their free surfaces had short microvilli and muclei were relatively big, at the bottoms of the cells. In cytoplasm were mucous granules of various sizes, a great deal of RERs and scattered mitochondria. The mucous neck cells were distributed over the necks of gastric glands, round or crescent shape. In the upper part of cytoplasmic nuclei, there were a great deal of secretory granules, developed Golgi’s bodies, a few RERs and scattered mitochondria. On the tops of cells were a few short thick micro villi. Chief cells were distributed over the bodies and bottoms of gastric glands and their nuclei were round. In cytoplasms there are many parallel RERs, a great deal of secretory granules, well-developed Golgi’s bodies and scattered mitochondria (Figure 9). The parietal cells were big and conic in shape and their conical tops turned towards gland cavities. The nuclei were in the centers of the cells. The cytosols are filled with vesicular smooth RERs (secreting hydrochloric acid), intracellular canaliculi (conveying hydrochloric acid) and many mitochondria. The endocrine cells lay between chief cells and parietal cells. They were small and their nuclei are round, at the bottoms of cellular matrixes. In cytoplasms, there are great deal of spherical endocrine granules, RERs, and a few mitochoncdria, Golgi’s bodies lie nearby nuclei (Figure 10). The normal gastric mucosa epithelial cell nuclei were round or oval; the nuclei envelopes are slightly bending; lobulated nuclei were few; the nucleocyotoplasmic ratio was less than 1; the nuclei chromatins were scattered, associated with nucleoli or distributed around the nuclei. The light bright zones between heterochromatins in the nucleoli were euchromatins; the nucleoli had high electron density without capsules (Figure 11). The normal epithelial cell mitochondria of gastric mucosa were round or oval, scattered around nuclei. The mitochondria consist of outer membrane, inner membrane, outer ventricle, inner ventricle and cristae. Crista, the inward folded inner membrane, was a hollow canal leading to outer ventricle. Some mitochondrial cristae lead directly to cytoplasms. Cristas were generally in tabular arrangement, parall to each other and vertical to mitochondrial long axes (Figure 12). The free surfaces of epithelial cells of CG gastric mucosa have dropped off micro villi. The intercellular space expands and cell conjuctions decrease; mitochondria decrease, become swollen or cristae breake and had vacuolar degeneration (Figure 13). RERs dilate and were in circular arrangement. The Golgi’s bodies became atrophic and had lost their typical structures; the cytoplasmic secretory granules decreased ; nuclei expand or shrink; parietal cell intracytoplasmic canaliculi dilate and micro villi become short and thin or even disappear. The karyoplasmic ratio of the cells with undifferenciated nuclei and IM cells of CG gastric mucosa epithelial cells were greater than 1 and there is increase in nuclear lobulation (Figure 14), interchromatic granules, peri-chromatic granular density and euchromatins. The nucleoli were hypertrophic and lie close to nuclear margins (referred to as nucleolar margination). The obsolescent epithelial nuclei shrink and the nucleocyto-plasmic ratio was still less. The hetero chromatins lie densely around nuclei; the electron density was low in the center of nuclei and nuclei were loop in shape (referred to as chromatic margination) (Figure 15). The shrinked nuclei were denticular, in which the electron density was moderately homogeneous and chromatins were not found (referred to as chromatic homogenization). As for the above changes, there was significant difference between NC group, CSG-woS group, CAG-woS group, F-wS group, CSG-wS group and CAG-wS group (P < 0.05-0.001, Table 3). There were mitochondrial swelling, hypertrophy, pyknosis, hyaline degeneration as well as vacuolar degeneration in epithelial cells of CG gastric mucosa. Deformed mitochondria were in C-shape or U-shape. There were zigzag, longitudinal, sparse, pyknosis and deranged cristae (Figure 16). There was an decrease in the number of mitochondria and their cristae. In the above changes, there Is significant difference between NC group. CSG-woS group. CAG-woS group. F-wS group CSG-wS group and CAG-wS group (P < 0.05-0.001, Table 4).
| Group | n | Appeararce | Chromatin | Nucleoli | |||
| Nucleoplasmic ratio > 1 | Nuclear lobulation | margination or homogeneity | Perinuclear concentration | hypertrophy or margination | looping | ||
| NC | 15 | 1 (6.7) | 1 (6.7) | ||||
| CSG-woS | 18 | 1 ( 5.6) | 4 (22.2)b | 1 (5.6) | 1 (5.6) | 1 (5.6) | |
| CAG-woS | 9 | 2 (22.2)d | 2 (22.2) | 7 (77.8)bd | 3 (33.3)bd | 2 (22.2)d | 4 (44.4)d |
| F-TwS | 56 | 3 (5.4)df | 3 (5.4)f | 1 (1.8)f | |||
| CSG-wS | 68 | 5 ( 5.7)f | 2 (2.9)f | 7 (10.3)cf | 5 (7.4)f | 2 (2.9)f | 2 (2.9)f |
| CAG-Ws | 64 | 20 (31.3)dj | 9 (29.7)j | 33 (51.6)bdhj | 29 (45.3)dfhj | 27 (42.2)dfhj | 14 (21.9)dgi |
| Group | n | Number | Swelling & overgrowth (%) | Matrix-discoloration (%) | Vacuolar degencration (%) | Pyknosis (%) | Crista number | Crista fragmentation & derangement (%) |
| NC | 15 | 86.5 ± 27.3 | 3.4 ± 1.6 | 3.0 ± 1.1 | 2.9 ± 1.9 | 1.1 ± 0.8 | 12.8 ± 3.2 | 2.2 ± 1.1 |
| CSG-woS | 18 | 85.3 ± 22.2 | 3.9 ± 1.1 | 3.9 ± 2.2 | 3.2 ± 1.2 | 1.4 ± 0.9 | 11.4 ± 2.4 | 3.1 ± 1.3 |
| CAG-woS | 9 | 83.8 ± 17.3 | 4.4 ± 2.4 | 4.3 ± 2.9 | 3.3 ± 1.1 | 1.7 ± 0.8 | 11.4 ± 2.1 | 3.2 ± 1.2 |
| F-TwS | 56 | 83.1 ± 22.8 | 5.4 ± 2.9bd | 4.4 ± 2.4 | 2.9 ± 1.8 | 1.2 ± 0.7 | 11.2 ± 2.3 | 3.9 ± 1.2bc |
| CSG-wS | 68 | 65.4 ± 21.1bdfh | 7.2 ± 3.8bdfg | 7.9 ± 5.0bdfh | 6.4 ± 4.5bdfh | 1.9 ± 0.9bch | 8.2 ± 3.2bdfh | 5.8 ± 3.1bdfh |
| CAG-wS | 64 | 52.2 ± 20.8bdfhj | 10.9 ± 4.5bdfhj | 11.7 ± 8.6bdfhj | 11.6 ± 7.7bdfhj | 3.7 ± 1.1bdfhj | 6.9 ± 3.5bdfhji | 8.9 ± 3.7bdfhj |
Under the direct vision of SEM with EDAX probe that automatically detected the samples within 0.1-0.01 mm2 range all the elements under 12 in atomic number and automatically calculates the weight percentage (WT%) of each element in the element series. 15 points were fixed in the three pieces of mucosa from every patient to carry out 15 detections and in every detection, 21 elements were detected to get their respective average WT% as its actual WT%. Zn and Cu were taken as index. The gastric mucosa Zn, Cu, cAMP, SOD and 3H-TdRLCT decrease progressively in the sequence of NC group CSG-woS group, CAG-woS group, F-wS group. CSG-wS group and CAG-wS group (P < 0.05-0.001, Table 5).
| Group | n | Gastric mucosa | Blood 3H-TdRLCT (Bq/L) | |||
| Zn (WT%) | Cu (WT%) | cAMP (Pmol/g) | SOD (u/g) | |||
| NC | 15 | 4.1 ± 1.0 | 5.2 ± 0.8 | 15.9 ± 1.5 | 170.5 ± 6.1 | 1079.7 ± 227.4 |
| CSG-woS | 18 | 3.7 ± 1.2 | 5.1 ± 1.8 | 15.6 ± 0.9 | 167.2 ± 5.3 | 924.5 ± 234.9 |
| CAG-woS | 9 | 3.3 ± 1.0 | 4.8 ± 0.9 | 14.9 ± 0.7a | 166.1 ± 4.2a | 887.7 ± 243.6 |
| F-TwS | 56 | 3.5 ± 1.4a | 4.5 ± 1.0a | 15.7 ± 1.4e | 167.9 ± 5.7 | 932.1 ± 2449.3a |
| CSG-wS | 68 | 2.8 ± 1.9bcg | 4.0 ± 1.5aceg | 14.2 ± 1.8bdeh | 163.3 ± 5.6bdh | 867.3 ± 240.5bc |
| CAG-wS | 64 | 2.0 ± 1.8bdfhi | 3.4 ± 1.5bdfhj | 13.4 ± 1.8bdfhi | 161.2 ± 4.3bdfhi | 800.9 ± 221.8bdi |
The quantity of nuclei DNA, Zn, Cu and serum LPO increased progressively in the sequence of NC group, CSG-woS group, CAG-woS group, F-wS group, CSG-wS group, CAG-wS group. While mitochondrial Zn, Cu, decreased progressively in the same sequence and there were significant differences between these groups (P < 0.05-0.001, Table 6).
| Group | n | Nuclei | Mitochondria | Serum | |||
| Zn (AT%) | Cu (AT%) | DNA (IOD) | Zn (AT%) | Cu (AT%) | LPO (umol/L) | ||
| NC | 15 | 7.6 ± 0.4 | 58.4 ± 0.3 | 12.6 ± 2.7 | 9.2 ± 0.5 | 58.3 ± 0.3 | 2.6 ± 0.6 |
| CSG-woS | 18 | 7.8 ± 0.3 | 58.6 ± 0.4 | 13.0 ± 3.1 | 8.9 ± 0.5 | 58.2 ± 0.3 | 2.9 ± 0.4 |
| CAG-woS | 9 | 7.8 ± 0.3a | 58.7 ± 0.3a | 14.3 ± 2.8 | 8.8 ± 0.4a | 57.5 ± 0.2bd | 3.1 ± 0.4 |
| F-TwS | 56 | 7.9 ± 0.4a | 58.7 ± 0.5a | 13.5 ± 4.6 | 8.9 ± 0.5a | 58.0 ± 0.3af | 2.9 ± 0.7 |
| CSG-wS | 68 | 8.1 ± 0.5bdfh | 58.9 ± 0.5bdh | 15.2 ± 3.2bcg | 8.6 ± 0.5bh | 57.8 ± 0.3bdfh | 4.2 ± 0.7bdfh |
| CAG-Ws | 64 | 8.6 ± 0.4bdfhj | 59.3 ± 0.5bdfhj | 16.5 ± 3.1bdehi | 8.3 ± 0.4bdfhj | 57.5 ± 0.3bdhj | 4.5 ± 0.6bdfhi |
Compared with NC group, 188 patients with digestive tract symptoms without other orangic disease and 27 patients without any clinical symptoms have a tendency of decreasing of quality in the submicrostructure of gastric mucosa epithelial cells -mitochonclria. The incidence rate of karyoplasmic ratio > 1, mucleari lobulation, chromatin peripheral granule densification, hypertrophy of nucleoli, mitochondrial degeneration, and quantitive changes of nucleolar DNA, Zn, Cu and LPO incread progressively in the sequence of NC group. CSG-woS group, CAG-woS group, F-wS group, CSG-wS group and CAG- wS group. While gastric mucosa Zn, Cu, cAMP, SOD and mitochondrial Zn, Cu and the number of mitochondria and crista decread progressively in the same sequence.
When gastric mucosa is damaged by noxious substances or ischemia, the metabolism of Zn, Cu becomes disordered with the body and thus enzyme system is disturbed. In human body, Zn is the important component and activator of over a hundred varieties of enzymes such as carbonic anhydrase, DNA polymerase, peptase, phosphatase, peroxide dismutase etc. By regulating the activity of these enzymes, it participates and regulates the metabolism of sugars, lipids, proteins, nuclei acid and vitamins, contends for mercaptan to inhibit free radical reaction. Cu participates the composition of over 30 kinds of proteins and enzymes in the body, regulates the protein metabolism and influences cellular respiration and division. When the level of Zn and Cu in the body declines, the synthesis and activity of SOD will be inhibited. Because of NADPH oxidation reduction circulation and the catalytic function of xanthine oxidase, a great deal of oxygen free radicals will be produced, far beyond the clearing ability of SOD. The excessive accumulated oxygen free radicals react in peroxidation with unsaturated fatty acid of inner and outer mitochondrial membranes and produce LPO, therefore serum LPO level will rise. The inner and outer mitochondrial membranes will accordingly be damaged, resulting in the decrease and derangement of mitochondrial cristae, the change of the ratio of mitochondrial ventricle diameter to cavity diameter and eventfully the retrograde affection, the decrease of ATP production, inadequate energy supply, which in turn cause debility, structural atrophy, decrease of gastric acid secretion and even cytonecrosis. The participation of Zn and Cu dependence enzymes is essential in nuclear protein synthetic metabolism (including DNA duplication) and mitochondrial energy metabolism. When nuclear took in more Zn and Cu, the protein synthsis was brisk, nuclei division and hyperplasia were accelerated, which increased the chance of gene mutation. As the second messenger substance, cAMP regulate some vital activities in the body. Once the quantity of cyclic nucleoside phosphate in nuclei changes abnormally, pathological state will occur. The quantitive changes of cAMP result in the changes of cellular metabolism, immunity and vegetative functions. The decrease of cyclic nucleoside phosphate, especially cAMP in the body results in the inhibition of sympathetic nerve (including purinergic nerve) function, and relative hyperfunction of parasympathetic nerve function. As a result, digestive tract symptoms occur such as abdominal distention, loose stool, involuntary drooling, poor appetite, pale enlarged tongue with tooth marks. Through influencing lymphocyte metabolism, the quantitive changes of Zn and cAMP in turn influence cell respiration, differentiation and inhibit lymphocyte transformation[4,6-13] and cause decline of 3H-TdRLCT level. As a result: (1) When gastric mucosa Zn, Cu and blood 3H-TdRLCT are nearly equal to that of NC group and gastric mucosa cAMP was markedly lower than that of HC group, clinical phenomena as CSG-woS and CAG-woS will occur; (2) When gastric mucosa Zn, Cu and 3H-TdRLCT were markedly lower than that of NC group and gastric mucosa cAMP is nearly equal to that of NC group, the phenomenon of F type with symptoms (non -disease with symptoms) will occur; (3) When the levels of gastric mucosa Zn, Cu, cAMP and 3H-TdRLCT were all markedly lower than those of NC group, the clinical phenomena such as CSG-wS and CAG-wS will occur. The occurrences of these clinical phenomena were consistent with the change of gastric mucosa ultrastructure and histopathology, forming the pathophysiological basis in the classification of chronic gastritis. Thus it can be seen that changes of gastric mucosa epithelial cell ultrastructures and the quantitive changes of their bioactive substances are the pathophysiological bases that determines the classification of chronic gastritis with different classification has respective clinical symptoms.
Edited by Xu JY
| 1. | Yin GY, Zhang WN, He XF, Chen Y, Shen XJ. Detection of ultra-structural changes and contents DNA, Zn, Cu and LPO in subgroups of chronic gastritis. Shijie Huaren Xiaohua Zazhi. 2002;10:663-667. |
| 2. | Yin GY, Zhang WN, Shen XJ, Chen Y, He XF. Ultrastructural and molecular diological changes of chronic gastritis and gastric cancer: a comparative study. Shijie Huaren Xiaohua Zazhi. 2002;10:668-672. |
| 3. | Yin GY, Zhang WN, He XF, Chen Y, Shen XJ. Alterations of ultrastructures, trace elements, cAMP and cytoimmunity in subgroups of chronic gastritis. Shijie Huaren Xiaohua Zazhi. 2002;10:673-676. |
| 4. | Yin G, Zhang W, He X. [Histocytopathological study on gastric mucosa of spleen deficiency syndrome]. Zhongguo Zhongxiyi Jiehe Zazhi. 1999;19:660-663. [PubMed] |
| 5. | Yin GY, Xu FC, Zhang WN, Li GC, He XF, Chen Y, Shen XJ. The effect of weikangfu on cytopathology of gastric mucosa tissue when treating gastric precancerosis lesion of patients with spleen defi-ciency syndromes. Zhongguo Zhongxiyi Jiehe Zazhi. 2000;6:241-243. |
| 6. | Yin GY, Zhang WN, Xu FC, He XF, Chen Y, Shen XJ. Effect of Weikangfu chongji on ultrastructure of precancerosis gastric mucosa of patients with spleen deficiency Syndromes. Zhongguo Zhongxiyi Jiehe Zazhi. 2000;20:667-670. |
| 7. | Yin GY, Zhang WN, Xu FC, Chen Y, He XF, Li GC, Shen XJ. Study on the modern pathophysiologic basis of the syndrome classification of spleen deficiency with chronic gastritis and of (treatment) verification of clinical syndromes and prescriptions. Jiangsu Yiyao Zazhi. 2001;27:46-47. |
| 8. | Yin GY, He XF, Yin YF, Du YQ, Jiao JH. Study on mitochondrial ultrastructure, trace elements and correlative factors of gastric mucosa in patients with spleen deficiency syndrome. Zhongguo Zhongxiyi Jiehe Zazhi. 1996;15:719-723. |
| 9. | Yin GY, Zhang WN, Xu FC, He XF, Chen Y, Shen XJ. Effect of weikangfu chongji on epithelial cellular ultrastructure of precancerotic gastric mucosa of patients with spleen deficiency syndrome. Jiangsu Yiyao Zazhi. 2000;26:514-517. |
| 10. | Yin GY, Zhang WN, Xu FC, He XF, Chen Y, Li GC, Shen XJ. Effect of weikangfu on Zn, Cu and DNA in precancerosis gastric mucosa epithelial nuclei and mitochondria of patients with spleen deficiency syndromes. Zhongguo Zhongxiyi Jiehe Zazhi. 2000;8:221-224. |
| 11. | Yin GY, Zhang WN, Shen XJ, Chen Y, He XF. Ultrastructure and molecular biological changes of chronic gastritis, gastric cancer and gastric precancerous lesions: a comparative study. World J Gastroenterol. 2003;9:851-857. [PubMed] |
| 12. | Yin GY, He XF, Zhang WN, Chen Y. Relationship between the classification of spleen deficiency and the quantitative changes of bio-active substances in mitochondria of gastric mucosa epithelical cell nuclei. Zhongguo Zhongxiyi Jiehe Zazhi. 1999;7:145-148. |
| 13. | Yin GY, Zhang WN, Li GC, Huang JR, Chen Y, He XF, Shen XJ. Therapeutic effect of weikangfu on gastric precancerosis disordddeer with spleen deficiency syndrome and its effect of gastric mucosal zinc, copper, cyclic adenosine monophosphate, superoxide dismutase,lipid peroxide and 3H-TdR lymphocyte conversion test. Zhongguo Zhongxiyi Jiehe Zazhi. 2000;20:176-179. |


