Published online Jun 15, 1999. doi: 10.3748/wjg.v5.i3.235
Revised: February 12, 1999
Accepted: February 23, 1999
Published online: June 15, 1999
AIM: To study the possibility of matrix-assisted laser desorption/ionization time of flight mass spectrometry (MALDI-TOF MS) for controlling the quality of recombinant proteins.
METHODS: By using MALDI-TOF MS, the molecular weights and purity of recombinant bioactive proteins were analyzed.
RESULTS: The molecular weights and purity were obtained in nine recombinant bioactive proteins, including interleukin 2, tumor necrosis factor α, granulocyte-macrophage colony stimulating factor, interferon α2b, interferon α1, erythropoietin, calmodulin and its fragment, and neuronal nitric oxide synthase were obtained. MALDI-TOF MS was also used to assay specific proteins in the mixtures and to characterize the erythropoietin tryptic digests.
CONLUSION: The results showed that MALDI-TOF MS can be employed for the effective quality control of recombinant proteins.
- Citation: Zhou GH, Luo GA, Sun GQ, Cao YC, Zhu MS. Study on the quality of recombinant proteins using matrix-assisted laser desorption ionization time of flight mass spectrometry. World J Gastroenterol 1999; 5(3): 235-240
- URL: https://www.wjgnet.com/1007-9327/full/v5/i3/235.htm
- DOI: https://dx.doi.org/10.3748/wjg.v5.i3.235
Since Hillenkamp et al[1] first introduced matrix-assisted laser desorption/ionization time of flight mass spectrometry (MALDI-TOF MS) to analyze proteins with molecular masses greater than Mr 10000, MALDI-TOF MS has been widely used to study different classes of biomolecules such as proteins, oligonucleotides, polysaccharides and polymers[2-5]. Compared to the traditional techniques, such as sodium dodecyl sulfate polyacrylamide gel electrophoresis (SDS-PAGE), MALDI-TOF MS has several advantages in the determination of protein molecular weight (Mr), peptide mapping, and purity.
In the present report, MALDI-TOF MS was used to accurately determine the Mr and purity of nine biological samples including recombinant bioactive proteins, such as: interleukin-2 (IL-2), interferon-alpha 2b (IFNα2b), interferon-alpha 1 (IFNα1), erythropoietin (EPO), granulocyte-macrophage-colony stimulating factor (GM-CSF), tumor necrosis factor alpha (TNFα), calmodulin (CaM) and its fragment, and neuronal nitric oxide synthase (nNOS). In addition, the protein mixtures and EPO peptide mapping were characterized by the technique.
Chemicals 3,5-dimethoxy-4-hydroxycinnamic acid (Sinapinic acid), 2,5-dihydroxybenzoic acid (DHB) and acetonitrile were produced by Sigma (St, Louis, USA). Trifluoroacetic acid (TFA) was from Merk-Schuchardt. Ammonium hydrogencarbonate, acetic acid and ethanol were produced by Nanjing Chemical Reagent Plant (Nanjing, China). All water used in the experiment was ultra high quality produced by a Milli-Q Plus Ultra Pure Water System.
Proteins Horse heart myoglobin, carbonic anhydrase B, β-lactoglobulin, bovine serum albumin and trypsin were obtained from Sigma (St, Louis, USA). IL-2 (E.coli), IFNα1 (Silkworm cell), GM-CSF (E.coli ), IFN α2b ( E.coli), EPO (CHO), nNOS, and CaM and its fragments were supplied by the East China Institute for Medicine and Biotechnology (Nanjing, China).
Tryptic digestion of EPO Approximately 200 µg EPO protein was lyophilized and dissolved in 200 µL 1% ammonium bicarbonate (pH 8.5). Trypsin protease was added to the solution which was incubated at 37 °C for 16h in a substrate: enzyme ratio of 50:1 (w:w). The digestion was quenched by storing the sample at -70 °C. The sample was lyophilized and reconstituted in 50 µL 10% acetic acid before use.
MALDI-TOF MS Analyses were performed on a Finnigan Laser MAT 2000 time-of-flight mass spectrometer (Finnigan MAT, Hemel Hempstead, Herts, UK). The system used a nitrogen laser (337 nm, 2 ns pulse) to des orb ions from the sample specimen . The desorbed ions were accelerated to 20kV into a free long tube. The time recorded for a molecule to travel the length of the tube to a detector was proportional to the mass of the ion, which was its molecular weight. All spectra were obtained using the positive-ion mode. Standard stainless-steel targets (with a sample application area of about 3.14 mm2) obtained from the manufacturer were employed for all analyses. The lasermat software allowed the user to irradiate one of the four possible target regions or quadrants of about 0.02 mm2. The spectra in this study were calibrated using instrumental calibration, based on the parameters determined from analysis of a number of standard proteins and peptides.
Sample preparation for MALDI-TOF MS determination The samples of each protein were prepared to 0.8 g/L-1.0 g/L in dilute TFA (0.05%. 0.09 mol/L sinapinic acid in acetonitrileethanol-water(60:4:36, v/v/v) was used as protein matrix and 0.1 mol/L 2,5-dihydroxybenzoic (DHB) in formic acid-water (9:1, v/v) was used as peptide matrix. The matrix solution was kept in the dark and prepared fresh every few days.
The samples for mass spectrometric analysis were mixed with the matrix in an Eppendorf tube. Typically, 5 µL of sample solution was added to a tube containing 10 µL of matrix solution. The solution was stirred in a vortex mixer, and then approximately 0. 5 µL of sample solution was applied to the target and followed by drying at room temperature and atmospheric pressure. For some protein samples in which the buffer contained salts at high concentrations, the dried sample/matrix preparation on the target was washed by depositing a droplet of cold distilled water for a few seconds on the sample spot surface to dissolve excess salt crystals, and followed by removing the droplet.
Nonglycosylated proteins The Mrs of recombinant proteins, IL-2, TNFα, GM-CSF, TNFα-2b, CaM fragments and nNOS expressed in E.coli were determined using MALDI-TOF MS. Table 1 shows the number of amino a cids, theoretical Mr, measured Mr and relative determination error for these nonglycoproteins.
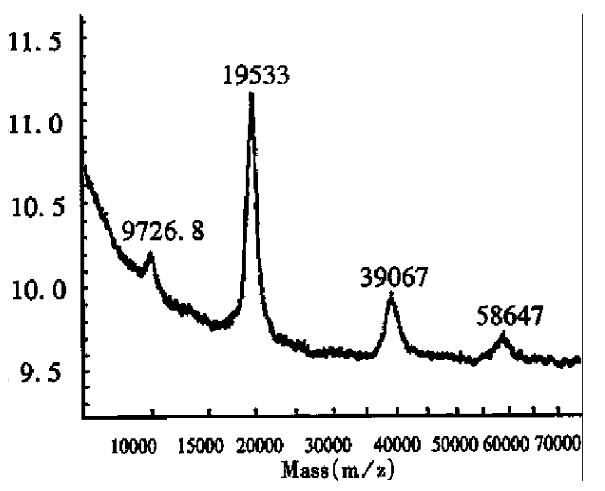
As Table 1 shows, the Mr relative error of the protein GM-CSF was 5.56%, which was much higher than the systematic error of the instrument. In addition, the peak in the GM-CSF mass spectrum was very sharp, indicating that the product was very pure. However, the results of Edman sequencing showed that there were 8 additional amino acids, MMKSDNSH, at the NH-2-terminus. The relative error was 0.12% when the 8 amino acids were added to the regular GM-CSF amino acid sequence. The relative errors of interleukin-2 and interferon α2b were approximately 0.8%. The increased mass was approximately equal to the Mr of an amino acid, which may have been added during the modifications, such as phosphorylation and cystinylation. The details were not achieved in the present report. An asymmetric single charged peak was observed in the interferon α2b mass spectrum (Figure 1), with an unresolved impurity peak on the left side that could be seen when the mass spectrum was amplified partially. This may be caused by partially removing N terminal methionine residue in the interferon α2b.
Glycosylated proteins Proteins expressed in mammal cells are generally glycosylated. Because of the microheterogeneity of the carbohydrates, the final product is a complicated heterogeneous mixture. In some cases, the functions of the biomolecules depend on the carbohydrate components[11,12]. For example, recombinant human erythropoietin will lose its in vivo bioactivity wi thout sialic acid residues[13,14]. Thus, it is very important to characterize the carbohydrate parts in glycoproteins[15,16]. In this article, MALDI-TOF MS was used to determine Mr and carbohydrate percentages of erythropoietin (EPO) and interferon α1 (Table 2).
| Protein | Number of amino acids | Measured Mr | Carbohydrate content (%) |
| EPO | 166 | 28707 | 35.6 |
| IFNα1 | 166 | 20465 | 5.2 |
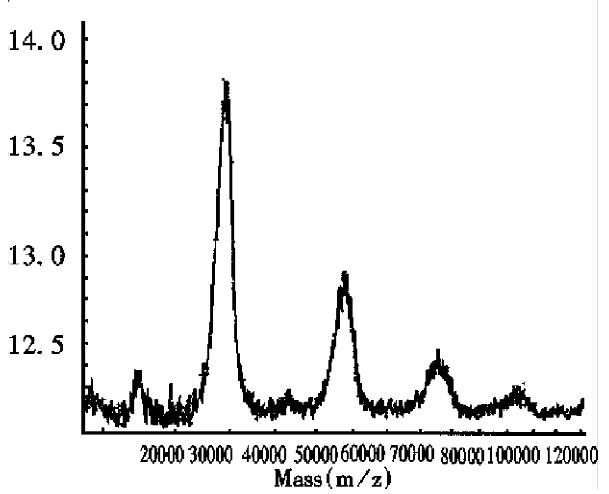
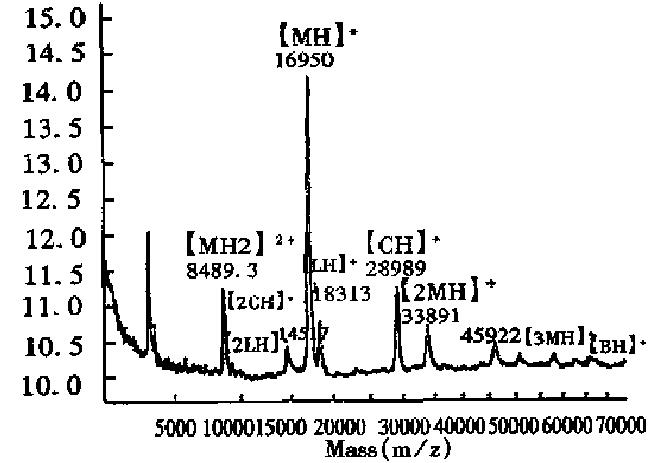
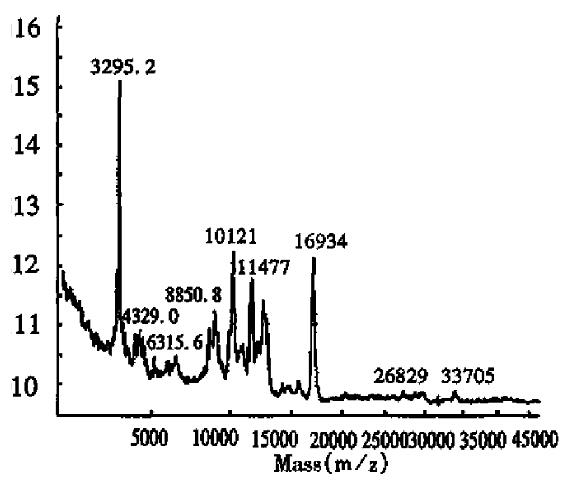
As can be seen in Figure 2, the half-intensity-width of EPO was much larger, indicating that EPO was a heterogeneous protein. The carbohydrate percentage was so high that electrospray mass spectrometry could not be employed to determine the heterogeneity. The Mr obtained using MALDI-TOF MS was 28707, while the Mr obtained using the traditional SDS-PAGE technique was about 34000. The mass difference of 5293 suggested that SDS-PAGE could measure the apparent Mr of the glycoprotein with high carbohydrate content. Since the results of SDS-PAGE for the molecular weight were related to the gel concentration, the determination procedure was difficult to control. The degree of glycosylation for biomolecules expressed in silkworm cells was generally lower, with only 5.2% carbohydrates found in recombinant protein interferon α1 by MALDI-TOF MS, which was consistent with theoretical calculations.The TOF mass spectra for EPO and IFNα1 showed that the half-intensity-widths were 8000 and 3000, respectively, much wider than that of nonglycoproteins in Table 1, Figure 3 and Figure 4. Ordinarily the half-intensity-widths are produced by isotopes, and are no more than 500[17]. Therefore, half-intensity-widths of 500 in singly charged MS peaks may be employed as a simple criterion to evaluate the heterogeneity of glycoproteins. The MS peak width will increase as glycoprotein becomes more heterogeneous.
Mixture composed of known standard proteins Methods used to analyze each component in multi-protein mixtures with out tedious separation are of great value. The advantage of MALDI-TOF MS in multicomponent characterization is the ability to simultaneously determine the Mr of each ingredient during one scan. However, singly charged oligomers with multiply charged monomers and multiply charged oligomers would complicate the mass spectra. Peaks could be specified only according to their Mr and the number of charges.
Figure 5 shows the MALDI-TOF mass spectrum for mixed proteins composed of myogl obin from horse heart, carbonic anhydrase B, β-lactoglobin and bovine serum albumin. Both molecular ion and the multiply charged monomers or oligomers were observed. The Mr measurement accuracy for the four proteins was 0.0%, 0.04%, 0.12%, and 0.18%, respectively.
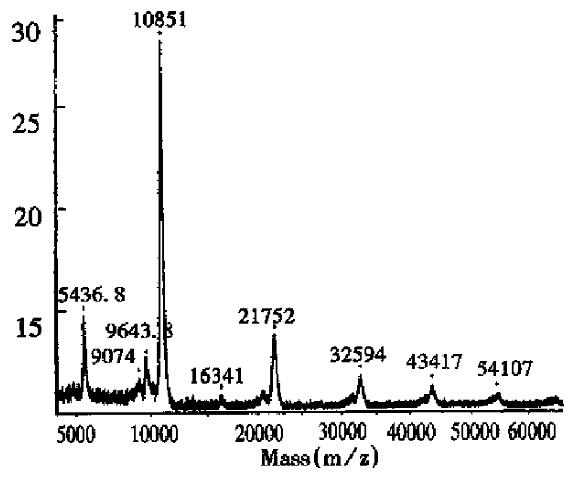
Determination of a specific protein in mixtures The mass spectrum of E.coli expressed products containing calmodulin in Figure 3, showed a protein mixture containing a protein with an observed Mr of 16934, together with a doubly charged monomer and a singly charged dimer, indicating that the mixture contained calmodulin with a theoretical Mr of approximately 17000. In addition, the spectrum showed that there was very little singly charged dimer, because calmodulin seldom formed dimers.
Measurement of the purity of expressed products and the relative content of impurities Since MALDI-TOF MS can give the Mr of all components in a mixture, the relative purity of the expressed product, along with the Mr of the impurity and its abundance, can be obtained from the mass spectrum. Figure 4 shows the mass spectrum of calmodulin fragment expressed in E.coli had small amounts of impurities with Mr of 9643.8 and 9074.0. In addition, few impurities were observed in the recombinant proteins, IL-2, TNFα, GM-CSF, IFNα2b, nNOS, IFNα1 and EPO.
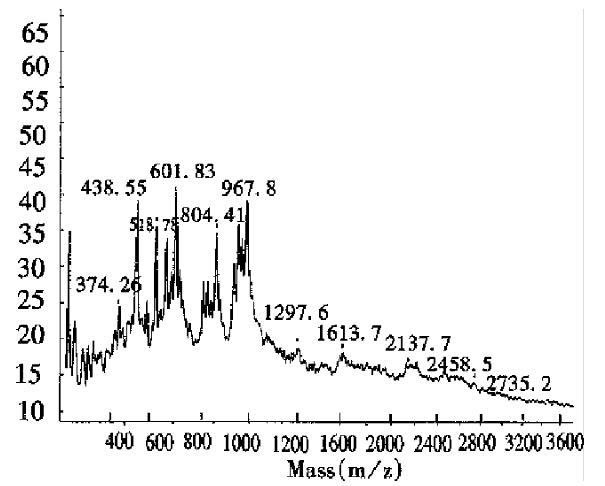
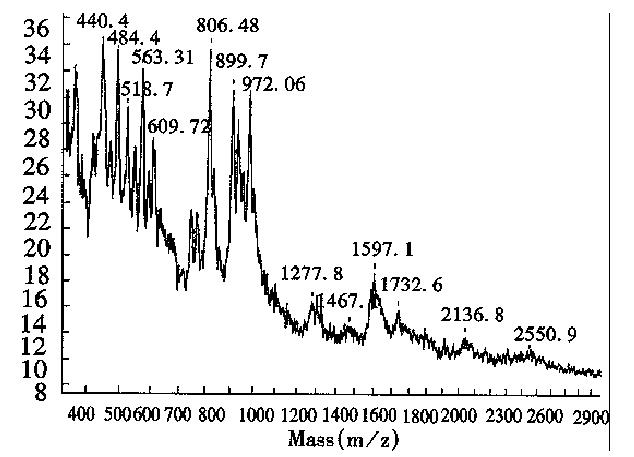
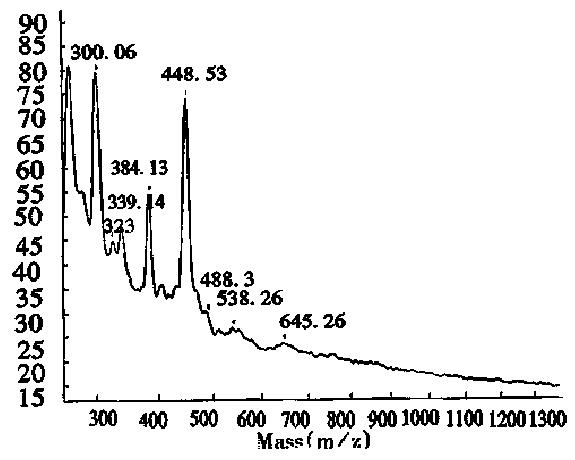
The MALDI-TOF peptide mapping strategy has been used successfully to analyze proteins in enzymatic digests and has thus been applied to verify the primary structure of some proteins[18]. As a technique, it offers a number of advantages over conventional peptide mapping with HPLC since it reduces the actual analysis time and also provides a means of assigning peptide fragments from their respective Mr. Peptide mapping is the “fingerprint” of the protein, so it can be employed to rapidly identify the correctness of the primary structure of protein during expression or purification[19]. This report introduces the peptide map of recombinant human erythropoietin by MALDI-TOF MS. Protease trypsin can theoretically digest the erythropoietin into 21 peptide fragments, including three glycopeptide fragments and two disulfide bonds (one between fragments T1 and T20, and another inside T5). The proteolytic digests were subjected directly to MALDI-TOF MS analysis without any prior purification. Figure 6 shows the mass spectrum of the tryptic digest with 13 peaks corresponding to peptide fragments. The observed mass values of the digests were consistent with the theoretical mass values as calculated from the amino acid sequence of rhEPO (Table 3). The mass value of 1612.7 indicated the formation of a disulfide bond between T1 nor T20, which was verified by the fact that neither T1 nor T20 was observed. Peptide mixtures generated by enzymatic digestion do not always allow for complete evaluation of peptide fragments by MALDI-TOF MS. As can be seen in Table 3, about 76.5% of the entire amino acid sequence was confirmed. In the lower mass range (below m/z 400), analyte molecule s could not be identified since the matrix peaks overlap with the signals from the analytes. In addition, the three glycosylated peptides were also not observed, because EPO was heterogeneous and the MS sensitivity to carbohydrates was much lower than that of peptides. Several matrices, including 2,5-dihydroxy benzoic acid (DHB), 2-aminobenzoic acid and α-cyano-4-hydroxycinnamic acid, were tested to obtain the best resolution and sensitivity in the mass spectrum measurement. The results in Figures 6, 7 and 8, show that the best matrix was DHB, which produced large analytical signals with good resolution. The 2-aminobenzoic acid matrix gave signals with lower sensitivity and poorer resolution, but it was better than the α-cyano-4-hydroxycinnamic acid matrix that is more suitable for “big” proteins rather than “small” peptides. The matrix concentration also affects the mass resolution and analyte signals. For example, with saturated DHB solution employed as the matrix, only two main peaks with mass values of about 480 and 2550 were obtained, possibly due to poor crystallization over the entire sample area in the target.
| rhEPO peptide | Position | Calculated mass value | Observed mass value | Relative error (%) |
| T1 | 1-4 | 439.5 | 440.5 | 0.23 |
| T3 | 11-14 | 515.6 | 517.8 | 0.39 |
| T4 | 15-20 | 735.9 | 735.5 | -0.05 |
| T5 | 21-45 | glycopeptide | ||
| T6 | 46-52 | 927.1 | 928.4 | 0.14 |
| T7 | 53 | 174.2 | ||
| T8 | 54-76 | 2525.3 | 2525.5 | 0.01 |
| T9 | 77-97 | glycopeptide | ||
| T10 | 98-103 | 601.7 | 600.8 | -0.15 |
| T11 | 104-110 | 802.5 | 803.4 | 0.11 |
| T12 | 111-116 | 586.3 | 585.5 | -0.14 |
| T13 | 117-131 | glycopeptide | ||
| T14 | 132-139 | 923.0 | 923.5 | 0.05 |
| T15 | 140 | 146.2 | ||
| T16 | 141-143 | 434.5 | * | |
| T17 | 144-150 | 898.0 | 899.1 | 0.12 |
| T18 | 151-152 | 203.2 | ||
| T19 | 153-154 | 259.3 | ||
| T21 | 163-166 | 447.4 | * | |
| T2-S-S-T20 | 1615.8 | 1612.7 | -0.19 |
In general, the choice of MALDI-TOF matrix is very critical to the homogeneous crystallization and the homogeneous embedding of the analyte molecules in the matrix. In addition, the matrix is responsible for the high mass resolution and high analyte signals.
The present investigations clearly show that MALDI-TOF MS is a powerful tool for measuring protein molecular weight, identifying unknown components in mixtures, determining purity and the relative content of impurities, and characterizing peptide mapping. The MALDI-TOF analysis validated that SDS-PAGE is unreliable in determining the Mr of glycoproteins. Since the broad MS peaks reflect the carbohydrate heterogeneity, half-intensity widths, MALDI-TOF MS peaks are recommended as a criterion to evaluate the heterogeneity of glycoproteins. The advantages of MALDI-TOF MS were described in this paper, such as its accuracy, small voluem sample consumption and rapid response. It is suggested that this technique should be the first choice when studying the quality of scarce or precious samplesduring the early stages in the development of engineered proteins.
Edited by Xian-Lin Wang
| 1. | Karas M, Hillenkamp F. Laser desorption ionization of proteins with molecular masses exceeding 10,000 daltons. Anal Chem. 1988;60:2299-2301. [RCA] [PubMed] [DOI] [Full Text] [Cited by in Crossref: 4452] [Cited by in RCA: 3520] [Article Influence: 92.6] [Reference Citation Analysis (0)] |
| 2. | Papac DI, Wong A, Jones AJ. Analysis of acidic oligosaccharides and glycopeptides by matrix-assisted laser desorption/ionization time-of-flight mass spectrometry. Anal Chem. 1996;68:3215-3223. [PubMed] |
| 3. | Karas M, Bahr U, Strupat K, Hillenkamp F. Matrix dependence of metastable fragmentation of glycoproteins in MALDI TOF mass spectrometry. Anal Chem. 1995;67:675-679. [RCA] [DOI] [Full Text] [Cited by in Crossref: 144] [Cited by in RCA: 121] [Article Influence: 5.0] [Reference Citation Analysis (0)] |
| 4. | Feistner GJ, Faull KF, Barofsky DF, Roepstorff P. Mass spectro-metric peptide and protein charting. J Mass Spectr. 1995;30:519-530. [DOI] [Full Text] |
| 5. | Harmon BJ, Gu X, Wang DI. Rapid monitoring of site-specific glycosylation microheterogeneity of recombinant human interferon-gamma. Anal Chem. 1996;68:1465-1473. [PubMed] |
| 6. | Russell DH, Edmondson RD. High-resolution mass spectrometry and accurate mass measurements with emphasis on the character-ization of peptides and proteins by matrix-assisted laser desorp-tion/ionization time - of - flight mass spectrometry. J Mass Spectrom. 1997;32:263-276. [DOI] [Full Text] |
| 7. | Powell AK, Harvey DJ. Stabilization of sialic acids in N-linked oligosaccharides and gangliosides for analysis by positive ion matrix-assisted laser desorption/ionization mass spectrometry. Rapid Commun Mass Spectrom. 1996;10:1027-1032. [PubMed] [DOI] [Full Text] |
| 8. | Rosinke B, Strupat K, Hillenkamp F, Rosenbusch J, Dencher N, Krüger U, Galla HJ. Matrix-assisted laser desorption/ion-ization mass spectrometry (MALDI-MS) of membrane pro-teins and non-covalent complexes. J Mass Spectrom. 1995;30:1462-1468. |
| 9. | Tang X, Sadeghi M, Olumee Z, Vertes A, Braatz JA, McIlwain LK, Dreifuss PA. Detection and quantitation of beta-2-microglobulin glycosylated end products in human serum by matrix-assisted laser desorption/ionization mass spectrometry. Anal Chem. 1996;68:3740-3745. [RCA] [PubMed] [DOI] [Full Text] [Cited by in Crossref: 25] [Cited by in RCA: 22] [Article Influence: 0.7] [Reference Citation Analysis (0)] |
| 10. | Edmondson RD, Russell DH. Evaluation of matrix-assisted laser desorption ionization-time-of-flight mass measurement accuracy by using delayed extraction. J Am Soc Mass Spectrom. 1996;7:995-1001. [RCA] [PubMed] [DOI] [Full Text] [Cited by in Crossref: 82] [Cited by in RCA: 72] [Article Influence: 2.4] [Reference Citation Analysis (0)] |
| 11. | Wasley LC, Timony G, Murtha P, Stoudemire J, Dorner AJ, Caro J, Krieger M, Kaufman RJ. The importance of N- and O-linked oligosaccharides for the biosynthesis and in vitro and in vivo biologic activities of erythropoietin. Blood. 1991;77:2624-2632. [PubMed] |
| 12. | Yamaguchi K, Akai K, Kawanishi G, Ueda M, Masuda S, Sasaki R. Effects of site-directed removal of N-glycosylation sites in human erythropoietin on its production and biological properties. J Biol Chem. 1991;266:20434-20439. [PubMed] |
| 13. | Higuchi M, Oh-eda M, Kuboniwa H, Tomonoh K, Shimonaka Y, Ochi N. Role of sugar chains in the expression of the biological activity of human erythropoietin. J Biol Chem. 1992;267:7703-7709. [PubMed] |
| 14. | Takeuchi M, Takasaki S, Shimada M, Kobata A. Role of sugar chains in the in vitro biological activity of human erythropoietin produced in recombinant Chinese hamster ovary cells. J Biol Chem. 1990;265:12127-12130. [PubMed] |
| 15. | Narhi LO, Arakawa T, Aoki KH, Elmore R, Rohde MF, Boone T, Strickland TW. The effect of carbohydrate on the structure and stability of erythropoietin. J Biol Chem. 1991;266:23022-23026. [PubMed] |
| 16. | Lai PH, Everett R, Wang FF, Arakawa T, Goldwasser E. Structural characterization of human erythropoietin. J Biol Chem. 1986;261:3116-3121. [PubMed] |
| 17. | Depaous AM, Advani JV, Sharma BG. Characterization of eryth-ropoietin dimerization. J Pharmac Sci. 1995;84:1281-1284. |
| 18. | Apffel A, Chakel J, Udiavar S, Hancock WS, Souders C, Pungor E. Application of capillary electrophoresis, high-performance liquid chromatography, on-line electrospray mass spectrometry and matrix-assisted laser desorption ionization--time of flight mass spectrometry to the characterization of single-chain plasminogen activator. J Chromatogr A. 1995;717:41-60. [RCA] [PubMed] [DOI] [Full Text] [Cited by in Crossref: 26] [Cited by in RCA: 22] [Article Influence: 0.7] [Reference Citation Analysis (0)] |


