Published online Jan 21, 2025. doi: 10.3748/wjg.v31.i3.102283
Revised: November 19, 2024
Accepted: December 3, 2024
Published online: January 21, 2025
Processing time: 67 Days and 11.4 Hours
Mucosal healing (MH) is the major therapeutic target for Crohn's disease (CD). As the most commonly involved intestinal segment, small bowel (SB) assessment is crucial for CD patients. Yet, it poses a significant challenge due to its limited accessibility through conventional endoscopic methods.
To establish a noninvasive radiomic model based on computed tomography enterography (CTE) for MH assessment in SBCD patients.
Seventy-three patients diagnosed with SBCD were included and divided into a training cohort (n = 55) and a test cohort (n = 18). Radiomic features were obtained from CTE images to establish a radiomic model. Patient demographics were analysed to establish a clinical model. A radiomic-clinical nomogram was constructed by combining significant clinical and radiomic features. The diagnostic efficacy and clinical benefit were evaluated via receiver operating characteristic (ROC) curve analysis and decision curve analysis (DCA), re
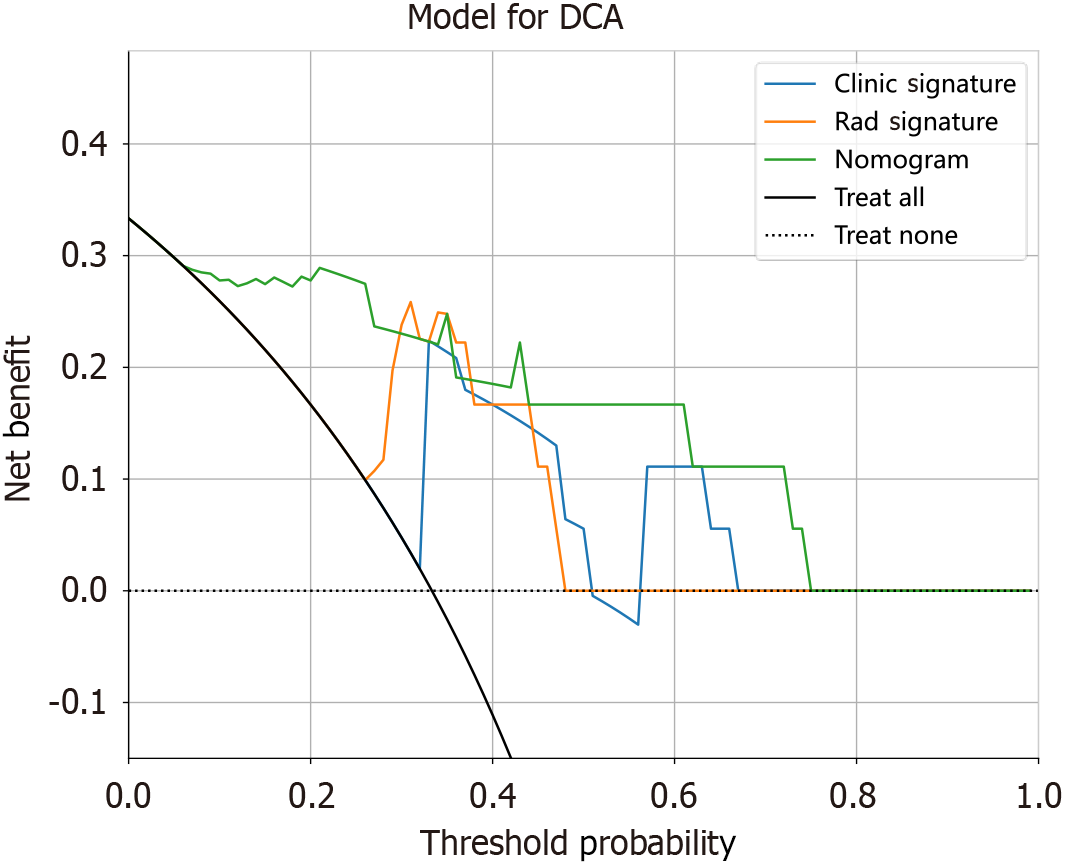
Of the 73 patients enrolled, 25 patients achieved MH. The radiomic-clinical nomogram had an area under the ROC curve of 0.961 (95% confidence interval: 0.886-1.000) in the training cohort and 0.958 (0.877-1.000) in the test cohort and provided superior clinical benefit to either the clinical or radiomic models alone, as demonstrated by DCA.
These results indicate that the CTE-based radiomic-clinical nomogram is a promising imaging biomarker for MH and serves as a potential noninvasive alternative to enteroscopy for MH assessment in SBCD patients.
Core Tip: Mucosal healing (MH) of small bowel (SB) in Crohn's disease (CD) is difficult to assess due to its limited accessibility through conventional endoscopic methods. Radiomics is a novel tool and has a good performance in disease diagnosis and efficacy evaluation. Here, we developed a computed tomography enterography-based radiomic-clinical nomogram to assess MH for SBCD patients with an area under the receiver operating characteristic curve of 0.961 in the training cohort and 0.958 in the test cohort, highlighting the potential of radiomics as an imaging biomarker and a noninvasive alternative to enteroscopy for MH assessment in SBCD.
- Citation: Ding H, Fang YY, Fan WJ, Zhang CY, Wang SF, Hu J, Han W, Mei Q. Computed tomography enterography-based radiomics for assessing mucosal healing in patients with small bowel Crohn's disease. World J Gastroenterol 2025; 31(3): 102283
- URL: https://www.wjgnet.com/1007-9327/full/v31/i3/102283.htm
- DOI: https://dx.doi.org/10.3748/wjg.v31.i3.102283
Crohn’s disease (CD) is a chronic recurrent inflammatory disease that affects the whole gastrointestinal tract, spanning from the mouth to the anus[1,2]. Inflammation is typically transmural and can lead to strictures, fistulas, and abscesses[1]. The small bowel (SB) is the segment most frequently involved in CD[3]. It has been reported that 70% of CD patients exhibit SB lesions, and approximately 30% of patients have disease confined to the SB[4,5]. Moreover, deep SB lesions often indicate a poor prognosis[4]. Thus, evaluating SB involvement is highly important in CD management.
Computed tomography enterography (CTE) is a widely applicable and noninvasive imaging modality for assessing SB lesions in CD patients. CTE has high sensitivity and specificity in diagnosing CD and CD-related fistulas and stenosis[3]. Mucosal healing (MH) is considered the primary therapeutic goal in CD and is associated with decreased rates of relapse, hospitalization, and surgical resection[6,7]. Recent studies have shown that CTE-based radiomic model can be used to predict MH in CD patients treated with biologic agents[8,9]. However, these studies focused only on colonic CD and ileocolonic CD with SB lesions restricted to the terminal ileum, both of which can be assessed by colonoscopy. As a conventional examination method, colonoscopy has been widely used; thus, the clinical significance of these studies is quite limited.
Approximately 50% of CD patients have involvement of the proximal SB which is beyond the reach of conventional colonoscopy[10]. Enteroscopy, including double-balloon enteroscopy (DBE), plays a crucial role in assessing SB lesions but is often not accessible in clinical practice due to the cumbersome, invasive, and expensive procedure[11]. A simple, noninvasive, and reliable alternative method to enteroscopy is urgently needed. Here, we constructed a radiomic-clinical nomogram and assessed its effectiveness in differentiating MH from non-MH in patients with SBCD.
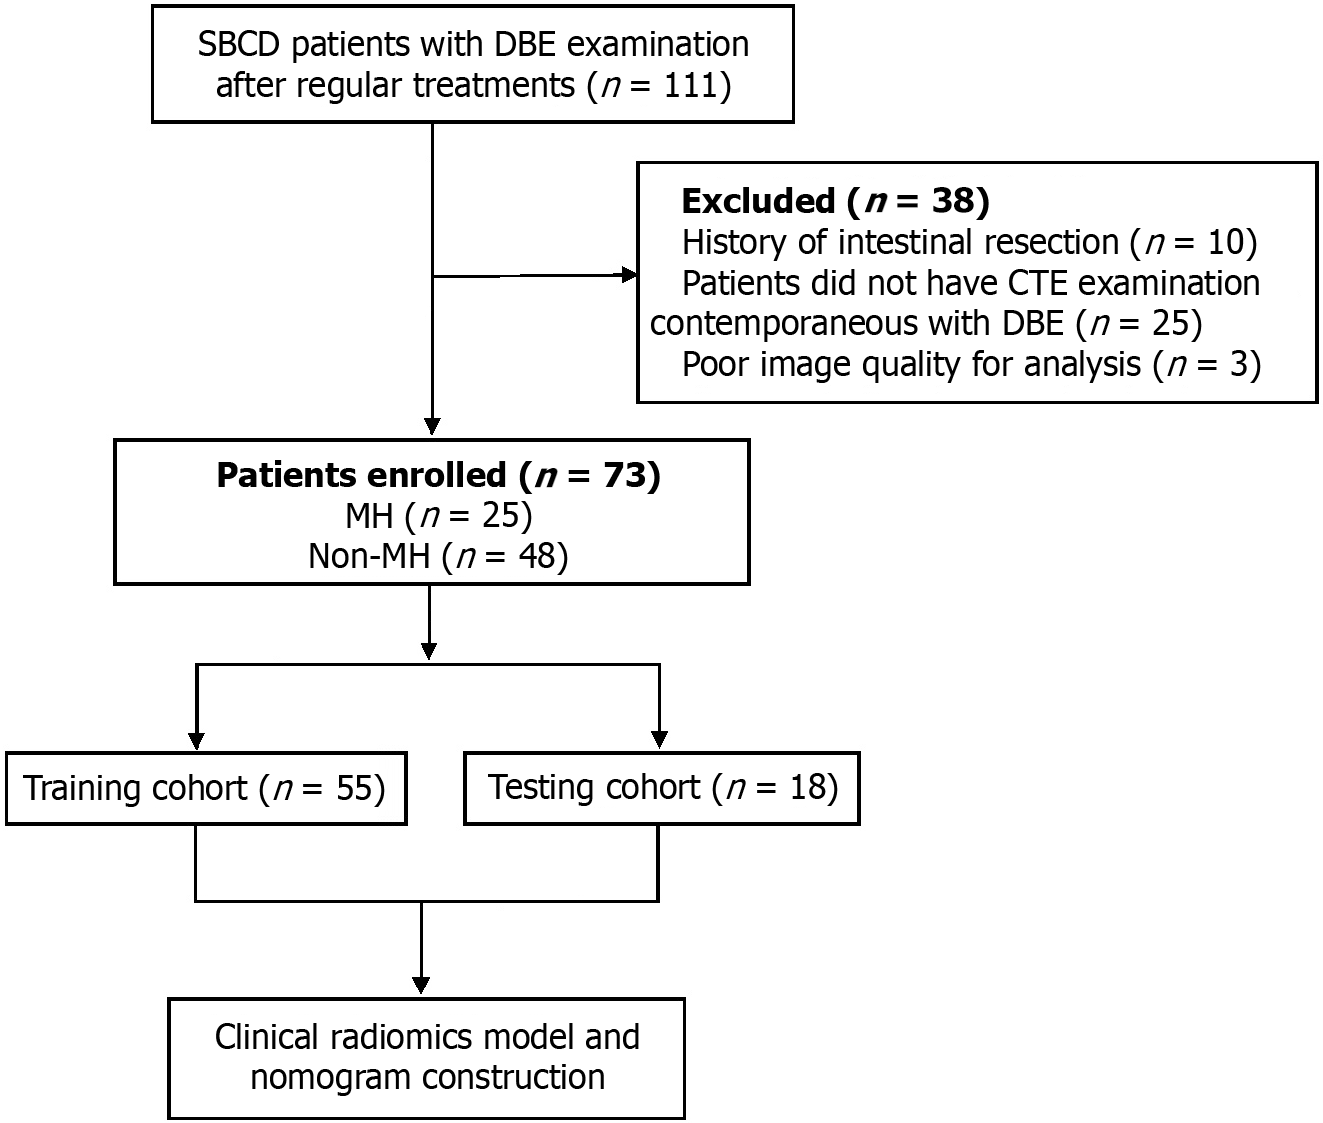
This retrospective study was approved by the Clinical Medical Research Ethics Committee of the hospital. Patients with a diagnosis of SBCD who underwent both CTE and DBE examinations in our hospital between October 2017 and October 2022 were enrolled. The study was conducted in accordance with the 1964 Declaration of Helsinki and subsequent amendments. SBCD patients who underwent DBE examination following standard treatments without active infectious diseases including perianal/celiac abscess and pseudomembranous enterocolitis were included. The exclusion criteria were as follows: (1) History of bowel resection; (2) Lack of CTE examination contemporaneous with DBE; and (3) Poor image quality. A total of 73 patients met the criteria and were randomly assigned to either the training cohort (n = 55) or the test cohort (n = 18). The flow chart of this study is displayed in Figure 1.
The diagnosis of CD was established on the basis of clinical, radiological, endoscopic, and histological data according to the European Crohn’s and Colitis Organization diagnostic criteria[12]. The data collected included age, sex, disease duration, location, behaviour, perianal involvement, treatment history (5-aminosalicylic acid, steroids, immunomodulators, and anti-tumour necrosis factor agents), smoking history, body mass index, clinical disease activity index, neutrophil-to-lymphocyte ratio (NLR), white blood cell count, haemoglobin (HB), haematocrit (HCT), albumin (ALB), C-reactive protein (CRP), and faecal calprotectin. All the data were available through the hospital information system.
DBE was conducted with Fujinon enteroscopes (Fujinon EN-580 T Inc, Saitama City, Japan). Antegrade DBE was performed after fasting for 6-8 hours. The patients were administered 2-4 L of polyethylene glycol solution for bowel preparation. The propulsion distance of each push-pull cycle was recorded to estimate the depth of insertion from either the ileocecal valve or the pylorus.
The modified simple endoscopic score for CD (mSES-CD) was used for endoscopic evaluations[13]. The SB was divided into three segments [the terminal ileum (≤ 10 cm from the ileocecal valve), the proximal ileum (10-300 cm from the ileocecal valve), and the jejunum]. The colon was divided into four segments (rectum, left colon, transverse colon, and right colon). The ulcer size, ulcerated surface, and affected surface were rated on a scale of 0 to 3 points, and the mSES-CD scores of each segment were calculated to obtain the total scores. MH was defined as an mSES-CD of 0[13].
All patients underwent standard bowel preparation prior to the examination. Patients were asked to fast overnight and then received 1.5-2 L of iso-osmotic mannitol solution orally 1 hour before the CT scan. CTE was conducted via a 64-layer multidetector (Revolution CT, GE Healthcare, Waukesha, WI, United States). Anisodamine hydrochloride (20 mg) was injected intravenously 10 minutes before CTE to reduce artefacts caused by intestinal peristalsis. The scanning parameters were as follows: Tube voltage 100-150 kV, tube current 150-300 mA, collimation 0.625 mm × 64 mm, pitch 1.375, and tube speed 0.35 s/c. The contrast medium (320 mg/mL) was given at a dosage of 1.5 mL/kg body weight and a peripheral venous flow rate of 3.0 mL/s. Saline was injected intravenously at a rate of 4 mL/s. CTE acquisition was performed for the late arterial and venous phases at 45 and 70 seconds, respectively.
CTE enteric phase images were used for segmentation. Image files were obtained in Digital Imaging and Communications in Medicine format. The inflammatory intestinal segments corresponding to endoscopy with obvious ulcers and intestinal segments with wall thickening/hyperenhancement or inflammatory penetrating complications (no abscess) were selected. The range of regions of interest (ROIs) specifically included the intestinal wall of the lesions, excluding the lumen, on CTE images[9]. The ROIs were manually delineated via the ITK-SNAP software (version 3.8) by a radiologist with 3 years of experience in abdominal CT diagnosis and verified independently by another radiologist with over 6 years of experience in abdominal CT diagnosis. The final ROIs were confirmed by both radiologists in consensus.
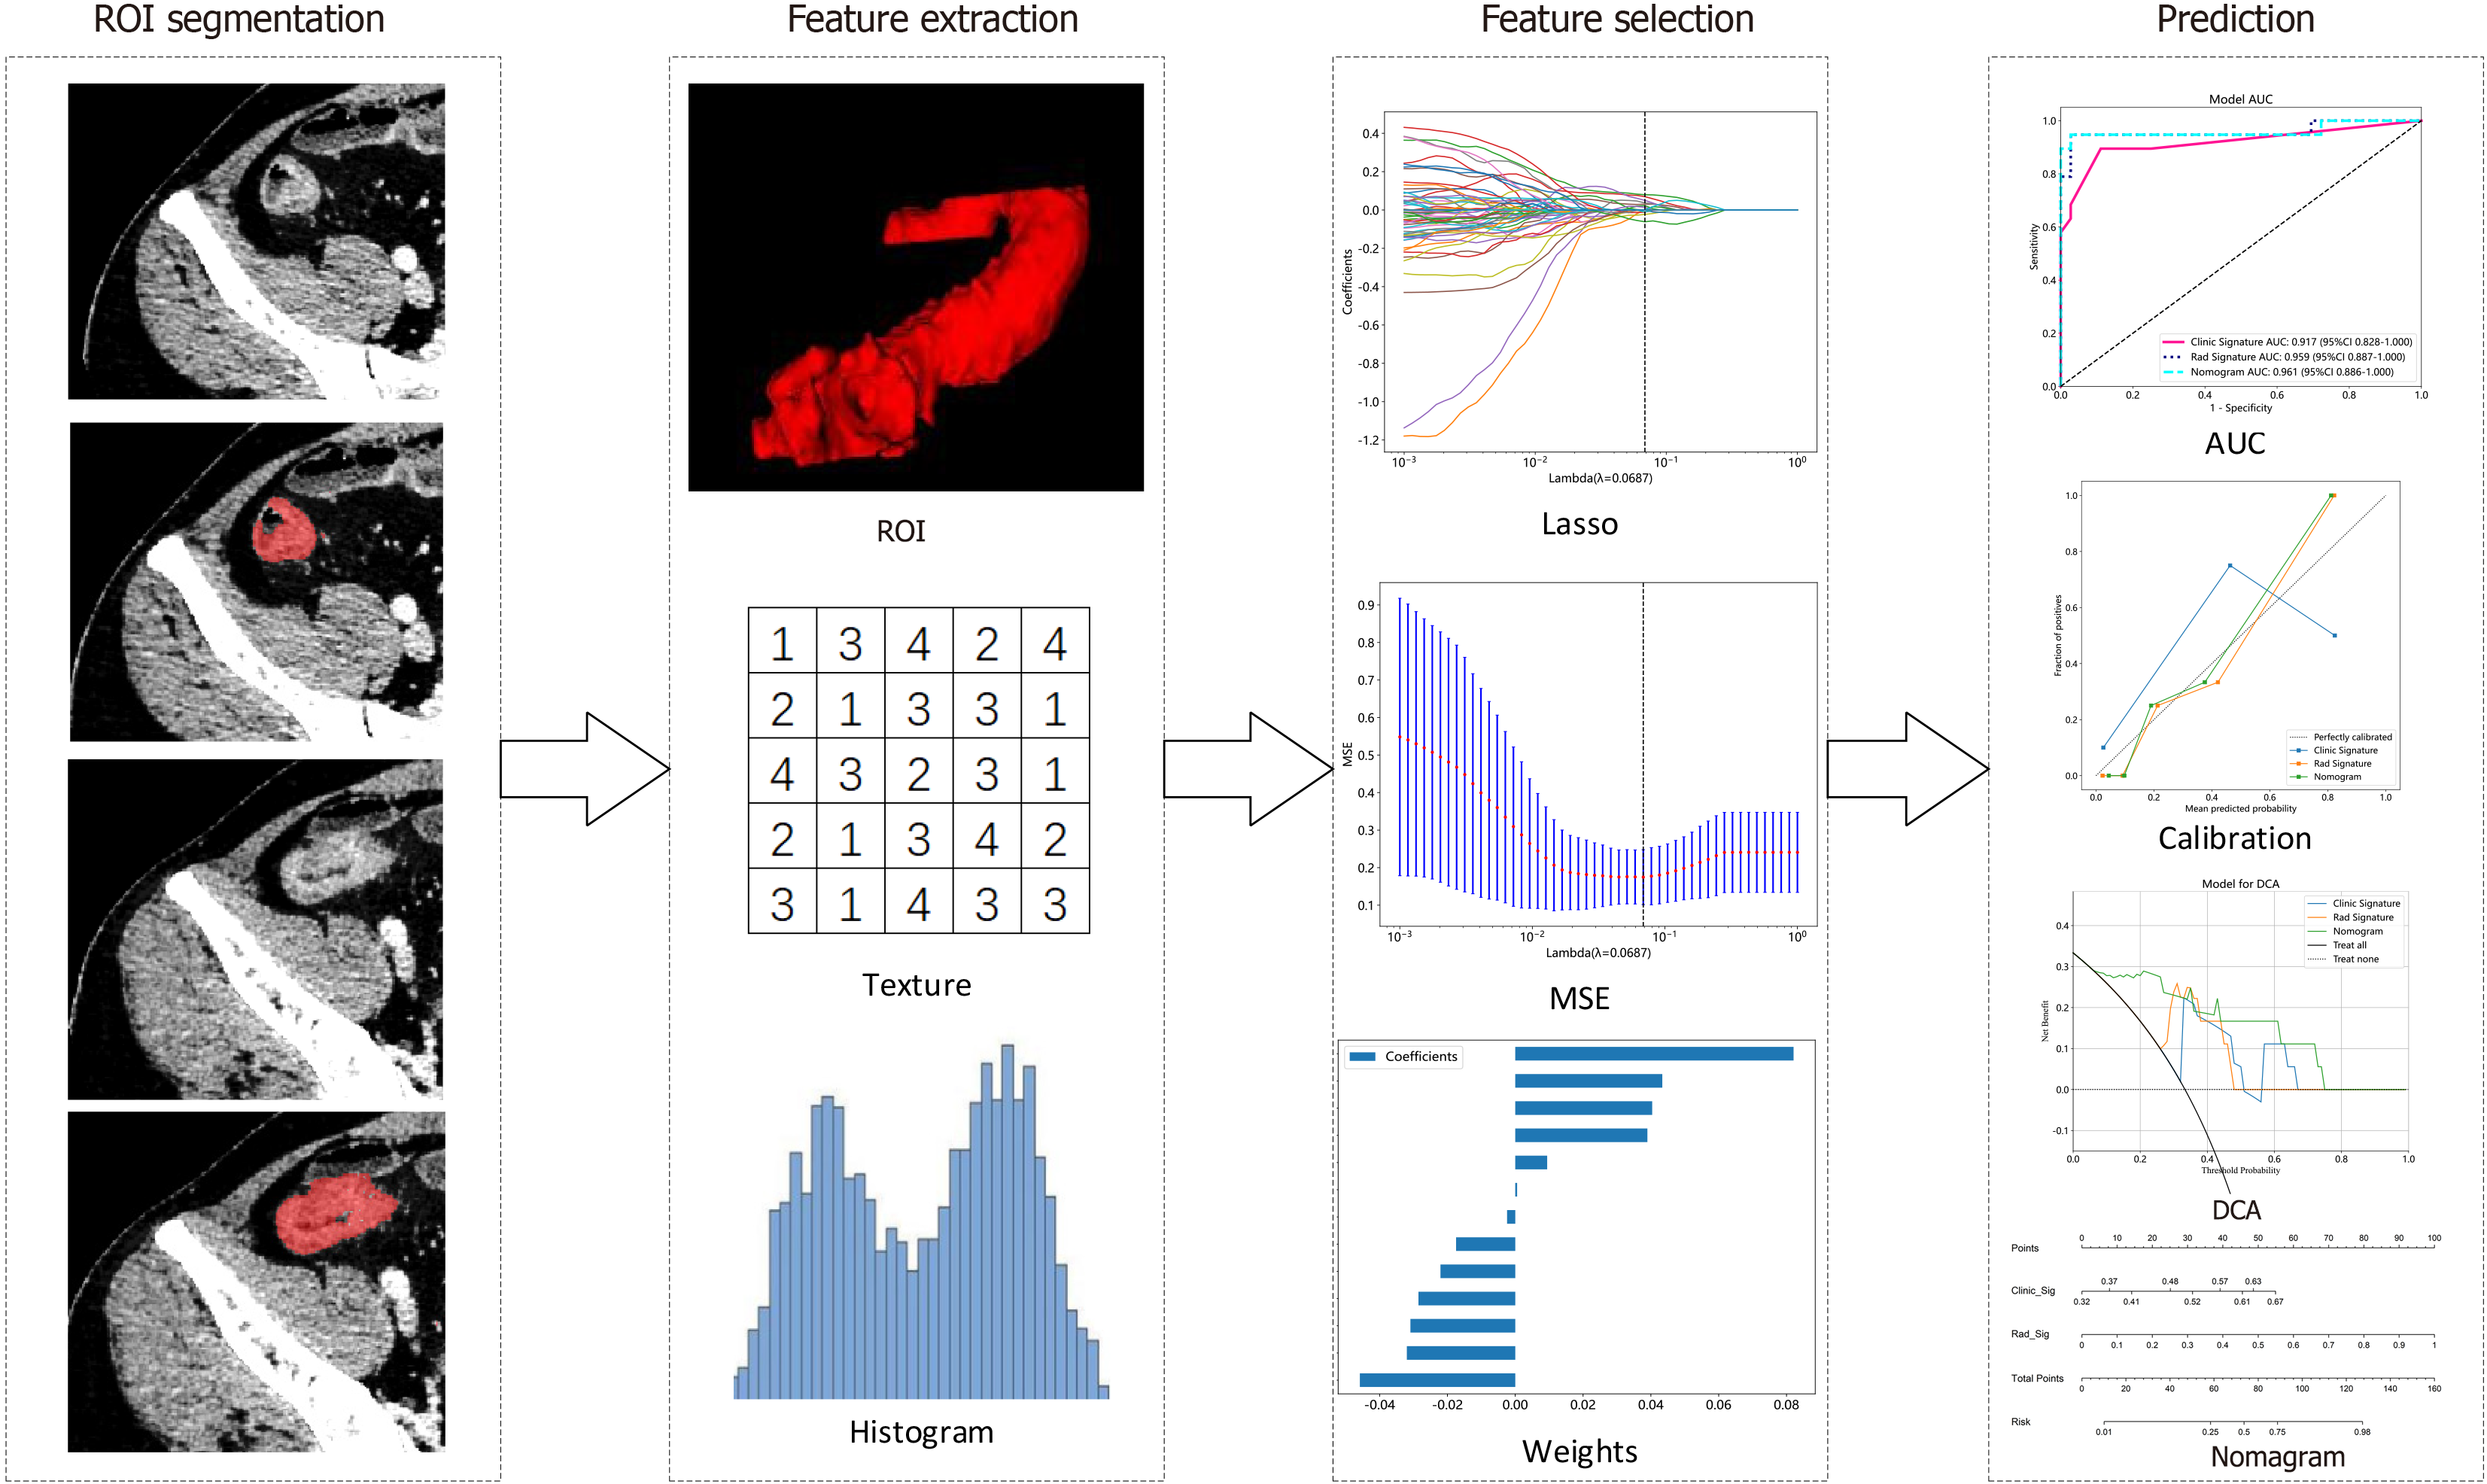
The PyRadiomics online platform (http://pyradiomics.readthedocs.io) was utilized for feature extraction. These features were divided into three groups: Geometry features, which describe the three-dimensional shape properties; intensity features, which describe the first-order statistical distribution of voxel intensities; and texture features, which describe the patterns or spatial distributions of the intensities. Texture features were extracted via the grey-level cooccurrence matrix, grey-level run length matrix, grey-level size zone matrix, and neighbourhood grey-tone difference matrix methods. These radiomic feature extraction algorithms were adopted from the Image Biomarker Standardization Initiative[14]. Feature correlations were assessed by using Spearman's rank correlation coefficient with retention criteria set at a correlation coefficient > 0.9. The least absolute shrinkage and selection operator regression model with 10-fold cross-validation was used for signature construction. Subsequently, machine learning models including logistic regression (LR), extremely randomized trees (ExtraTrees), support vector machine (SVM), extreme gradient boosting (XGBoost), and light gradient boosting machine (LightGBM) were trained using the final retained features to construct a risk model. The model with the highest average area under the receiver operating characteristic (ROC) curve (AUC) was chosen as the optimal radiomic model on the basis of a 4-fold cross-verification strategy. The radiomic score (Rad score) was then computed, and the detailed workflow of the radiomic analysis is illustrated in Figure 2.
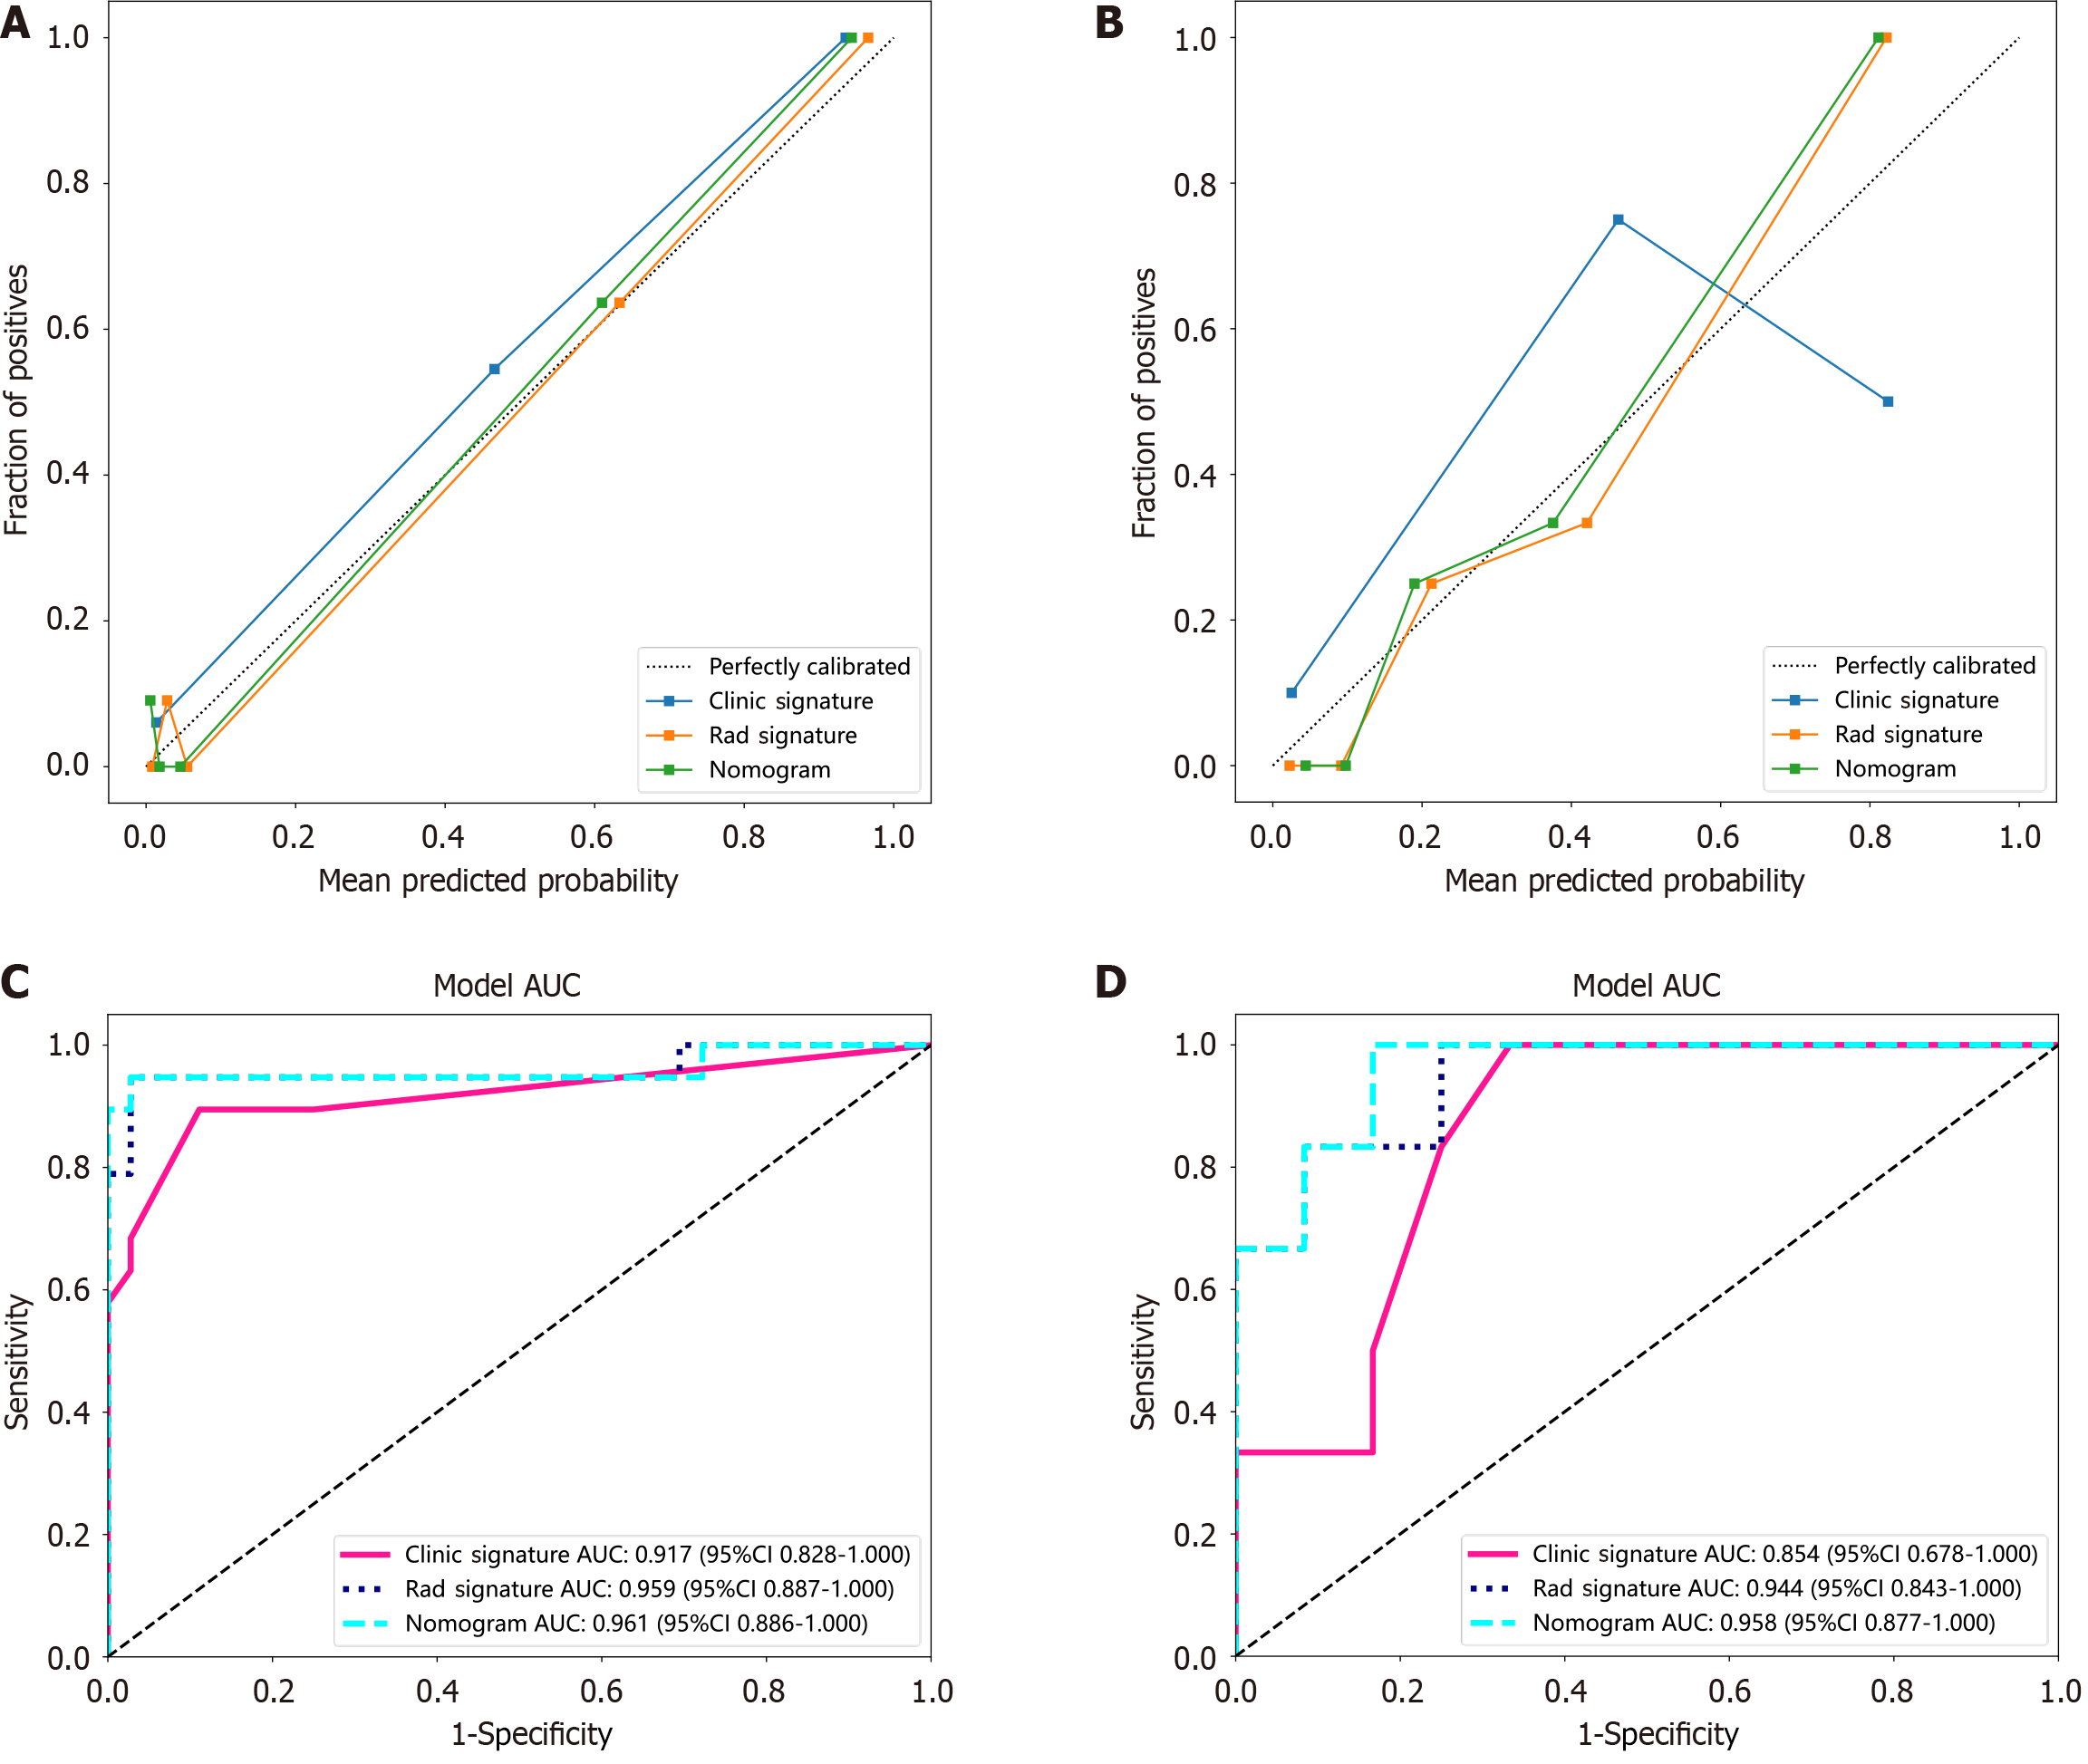
Patients’ clinical features were tested for statistical significance. The final retained features were included to construct a clinical model via machine learning algorithms (LR, SVM, ExtraTrees, XGBoost, and LightGBM). The fourfold cross-validation and test cohorts were set to be fixed for a fair comparison. A radiomic-clinical nomogram was then established by integrating both radiomic and clinical signatures. The diagnostic performance was evaluated through ROC curves. Hosmer-Lemeshow analytical fit was utilized to assess the calibration ability. Clinical utility was evaluated via decision curve analysis (DCA).
Normally distributed continuous variables (expressed as the means ± SD), nonnormally distributed continuous variables [expressed as medians (interquartile ranges)], and categorical variables (expressed as numbers or percentages) were compared via t-test, Mann-Whitney U test, and χ2 test, respectively. The diagnostic performance was analysed via ROC curves and expressed as the AUC. Quantitative comparisons of AUCs were made with the Delong test. SPSS 25.0 software was used for the statistical analyses, and a two-sided P value < 0.05 was considered statistically significant. The G*Power software (version 3.1.9.7) was used to calculate the sample size. A minimum of 58 patients were determined to be required (effect size d = 0.8, α error = 0.05, power = 0.8, ratio N2/N1 = 1.89). For the current sample size, we achieved a power of 79.45%, with an effect size of 0.8.
Seventy-three patients were included and randomly assigned to the training cohort (n = 55) or test cohort (n = 18). Patients with MH accounted for 34.55% (19/55) of those in the training cohort and 33.33% (6/18) of those in the test cohort. The details of the patients’ characteristics are summarized in Table 1. Age (P = 0.007), disease duration (P = 0.021), perianal involvement (P = 0.009), immunomodulator treatment history (P = 0.048), NLR (P = 0.006), HB (P = 0.004), HCT (P = 0.004), ALB (P = 0.006), CRP (P = 0.000), and calprotectin (P = 0.012) were statistically significant in the training cohort and were selected for clinical model construction. The clinical model achieved an average AUC of 0.917 [95% confidence interval (95%CI): 0.828-1.000)] in the training cohort and 0.854 (95%CI: 0.678-1.000) in the test cohort.
| Clinical characteristics | Training cohort (n = 55) | Test cohort (n = 18) | ||||
| MH | Non-MH | P value | MH | Non-MH | P value | |
| Age (year) | 27.32 ± 11.73 | 34.81 ± 10.93 | 0.007 | 31.67 ± 8.50 | 40.92 ± 13.91 | 0.158 |
| Gender, n (%) | 0.384 | 0.316 | ||||
| Male | 16 (84.21) | 25 (69.44) | 6 (100.00) | 8 (66.67) | ||
| Female | 3 (15.79) | 11 (30.56) | 0 (0.00) | 4 (33.33) | ||
| Disease duration, months | 27.11 (23.50) | 48.58 (43.50) | 0.021 | 25.67 (3.00) | 49.83 (37.00) | 0.11 |
| Montreal location, n (%) | 0.715 | 0.761 | ||||
| L1 | 13 (68.42) | 20 (55.56) | 4 (66.67) | 7 (58.33) | ||
| L3 | 4 (21.05) | 12 (33.33) | 2 (33.33) | 4 (33.33) | ||
| L1 + L4 | 1 (5.26) | 3 (8.33) | 0 (0.00) | 1 (8.33) | ||
| L3 + L4 | 1 (5.26) | 1 (2.78) | 0 (0.00) | 0 (0.00) | ||
| Montreal behavior, n (%) | 0.219 | 0.187 | ||||
| B1 | 15 (78.95) | 21 (58.33) | 4 (66.67) | 3 (25.00) | ||
| B2 | 4 (21.05) | 12 (33.33) | 1 (16.67) | 7 (58.33) | ||
| B3 | 0 (0.00) | 3 (8.33) | 1 (16.67) | 2 (16.67) | ||
| Perianal involvement, n (%) | 13 (68.42) | 10 (27.78) | 0.009 | 1 (16.67) | 3 (25.00) | 1.000 |
| Treatment history, n (%) | ||||||
| 5-aminosalicylic acid | 2 (10.53) | 5 (13.89) | 1.00 | 0 (0.00) | 0 (0.00) | 1.000 |
| Steroids | 4 (21.05) | 15 (41.67) | 0.218 | 2 (33.33) | 5 (41.67) | 1.000 |
| Immunomodulator | 4 (21.05) | 19 (52.78) | 0.048 | 2(33.33) | 5 (41.67) | 1.000 |
| Anti-TNF agent | 17 (89.47) | 27 (75.00) | 0.357 | 4 (66.67) | 9 (75.00) | 1.000 |
| Smoking history, n (%) | 3 (15.79) | 6 (16.67) | 1.000 | 3 (50.00) | 3 (25.00) | 0.596 |
| CDAI, mean (IQR) | 63.51 (31.09) | 92.84 (89.14) | 0.589 | 51.72 (35.21) | 82.96 (62.13) | 0.200 |
| BMI (mean ± SD) | 20.98 ± 3.28 | 21.15 ± 3.73 | 0.937 | 23.75 ± 5.06 | 20.60 ± 1.99 | 0.250 |
| WBC (× 109/L) | 5.69 ± 1.56 | 5.97 ± 1.92 | 0.586 | 5.50 ± 2.40 | 5.08 ± 1.64 | 0.779 |
| NLR | 1.67 ± 0.70 | 2.47 ± 1.11 | 0.006 | 1.93 ± 1.17 | 3.80 ± 5.71 | 0.335 |
| HB (g/L) | 139.58 ± 11.79 | 120.19 ± 27.90 | 0.004 | 136.83 ± 15.94 | 132.08 ± 23.51 | 0.664 |
| HCT (%) | 42.07 ± 3.50 | 37.12 ± 7.34 | 0.004 | 41.05 ± 4.81 | 39.61 ± 6.49 | 0.638 |
| ALB (g/L) | 42.55 ± 2.85 | 39.07 ± 4.75 | 0.006 | 42.60 ± 1.41 | 38.87 ± 5.24 | 0.068 |
| CRP (mg/dL) | 2.56 (1.44) | 9.86 (8.38) | 0.000 | 1.51 (0.24) | 9.00 (10.64) | 0.067 |
| CPT (μg/g) | 348.02 (455.37) | 513.29 (410.31) | 0.012 | 349.45 (374.54) | 677.13 (258.78) | 0.111 |
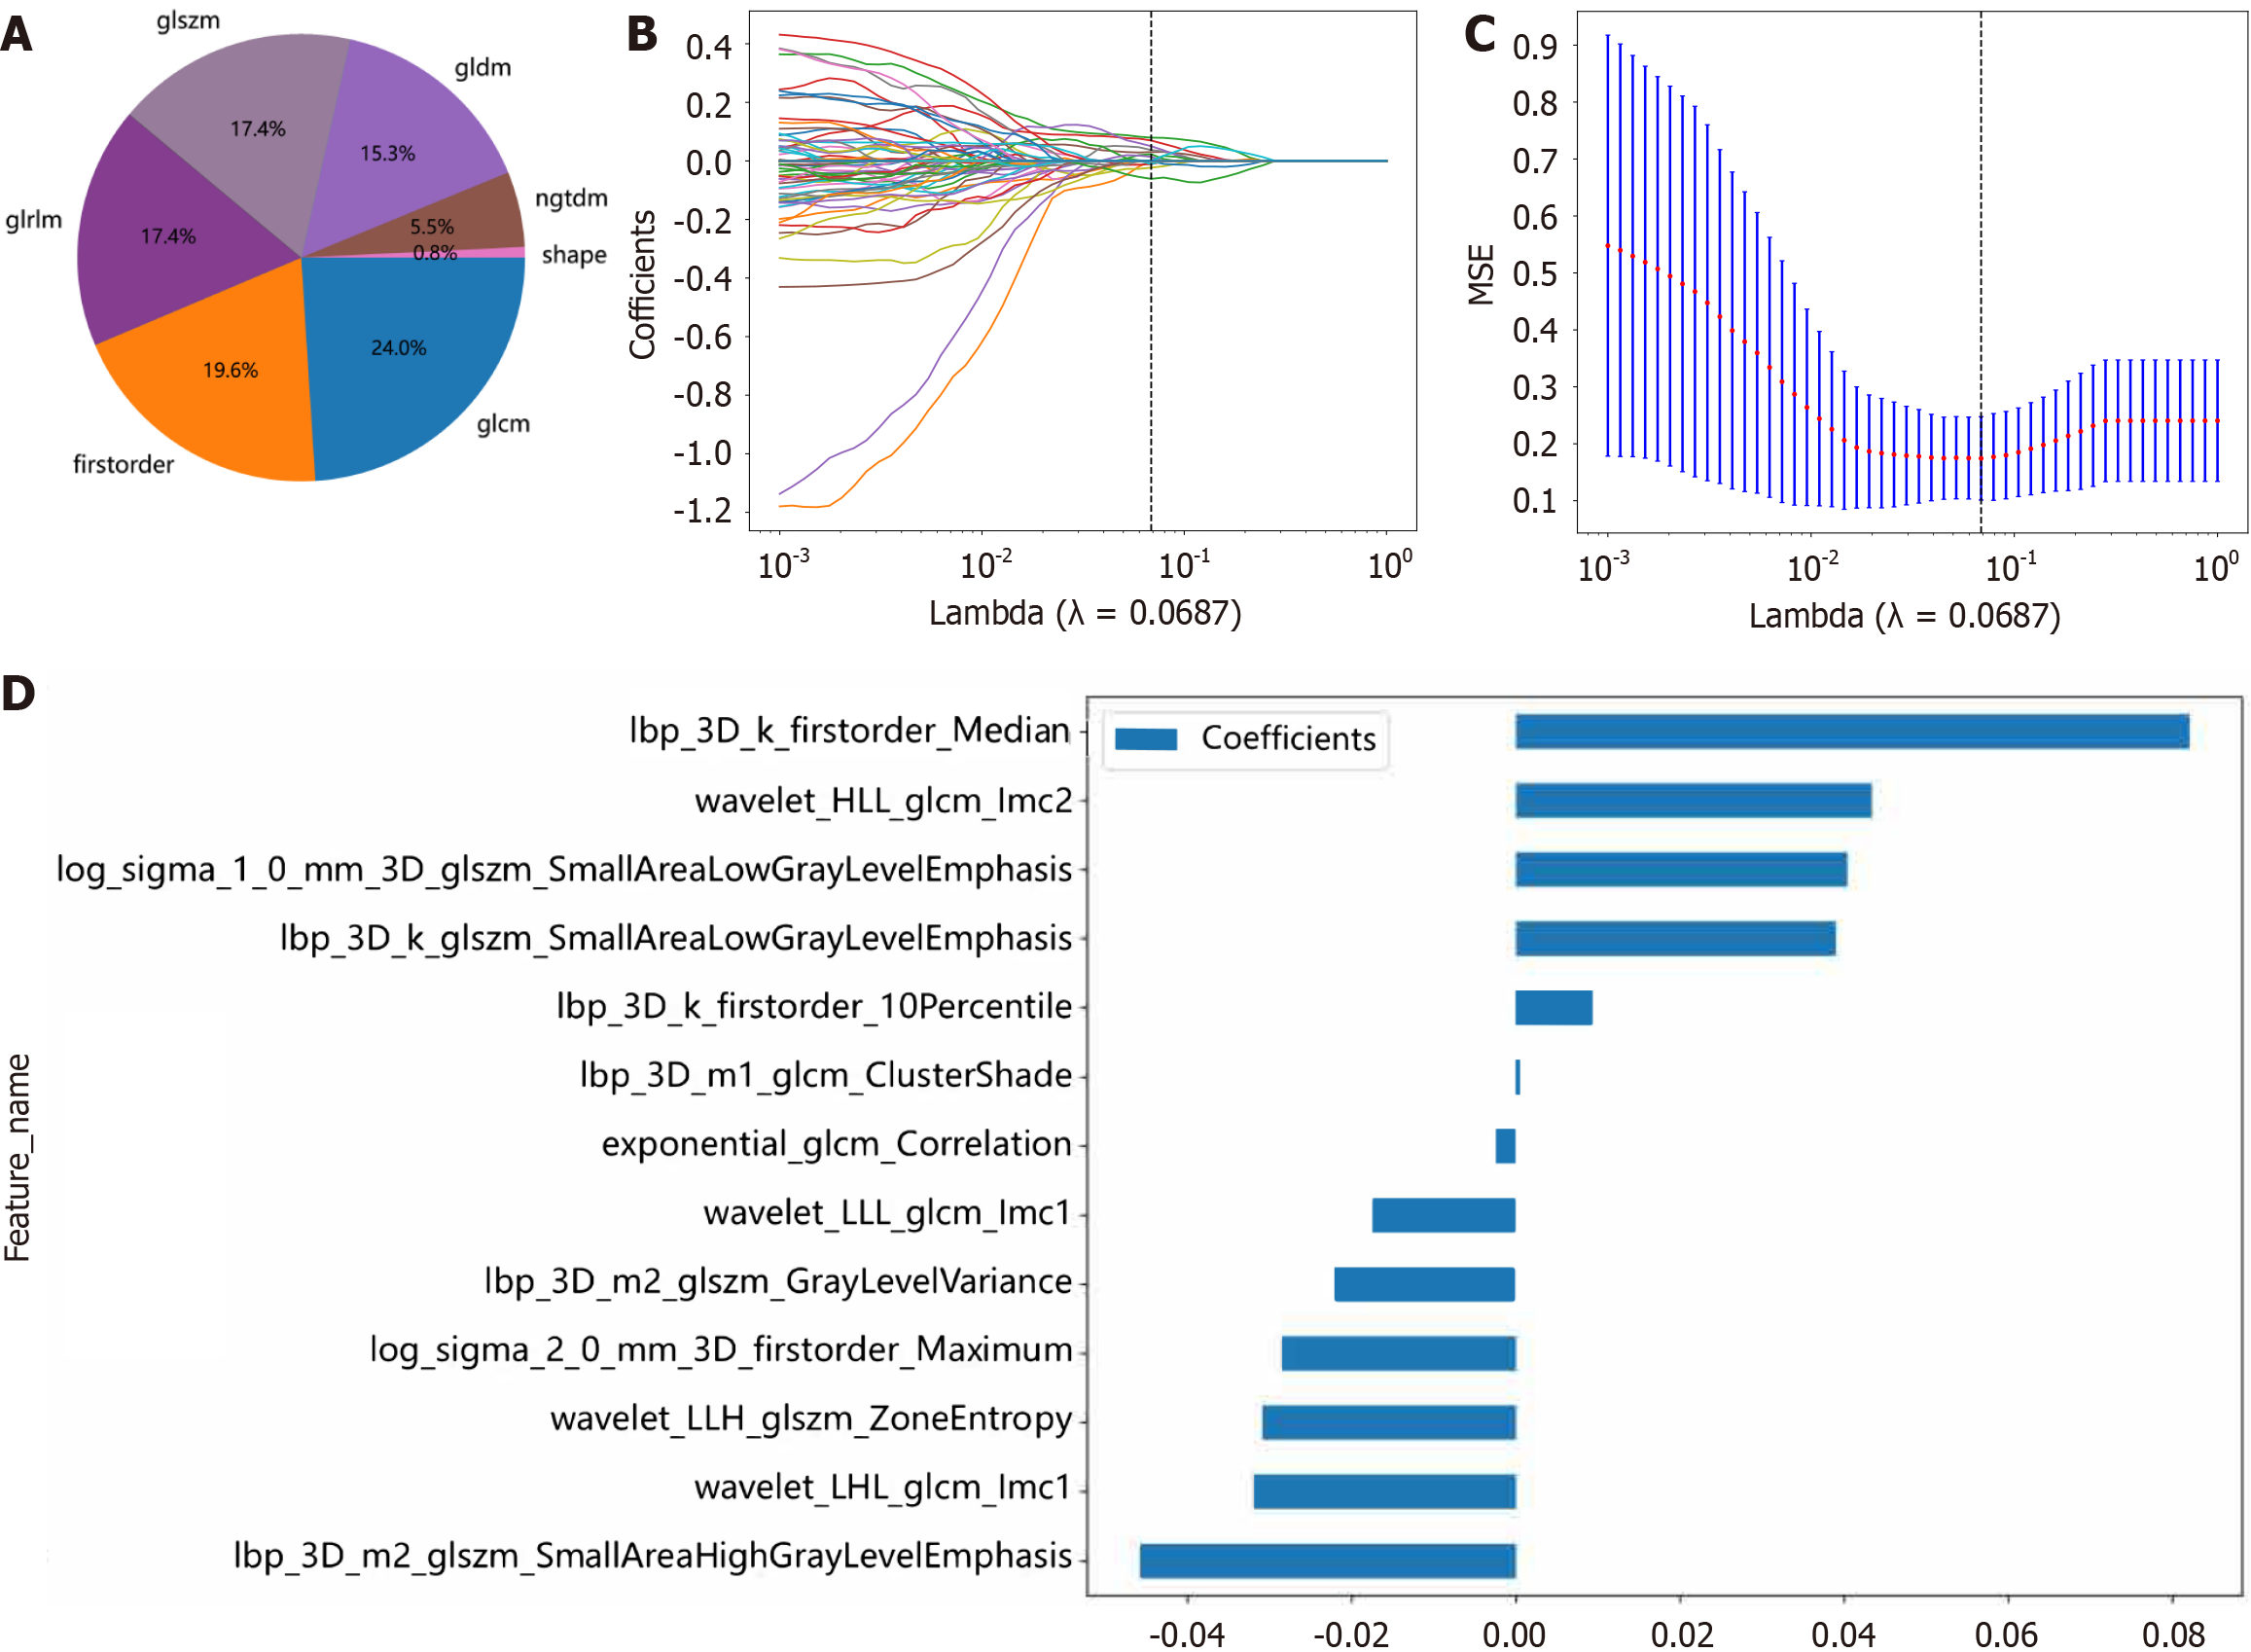
A total of 1834 radiomic features of 7 categories were extracted, including 360 first-order features, 14 shape features, and 1460 texture features (Figure 3A). A radiomic signature was established via the least absolute shrinkage and selection operator SVM model using the final 13 retained nonzero coefficient features. The coefficients and mean standard errors (MSEs) of 10-fold cross-validation and the coefficient values of the selected features are shown in Figure 3B-D. The Rad score was calculated via the following formula: Rad-score = 0.33238259623728683 - (0.002403 × exponential_glcm_Corre
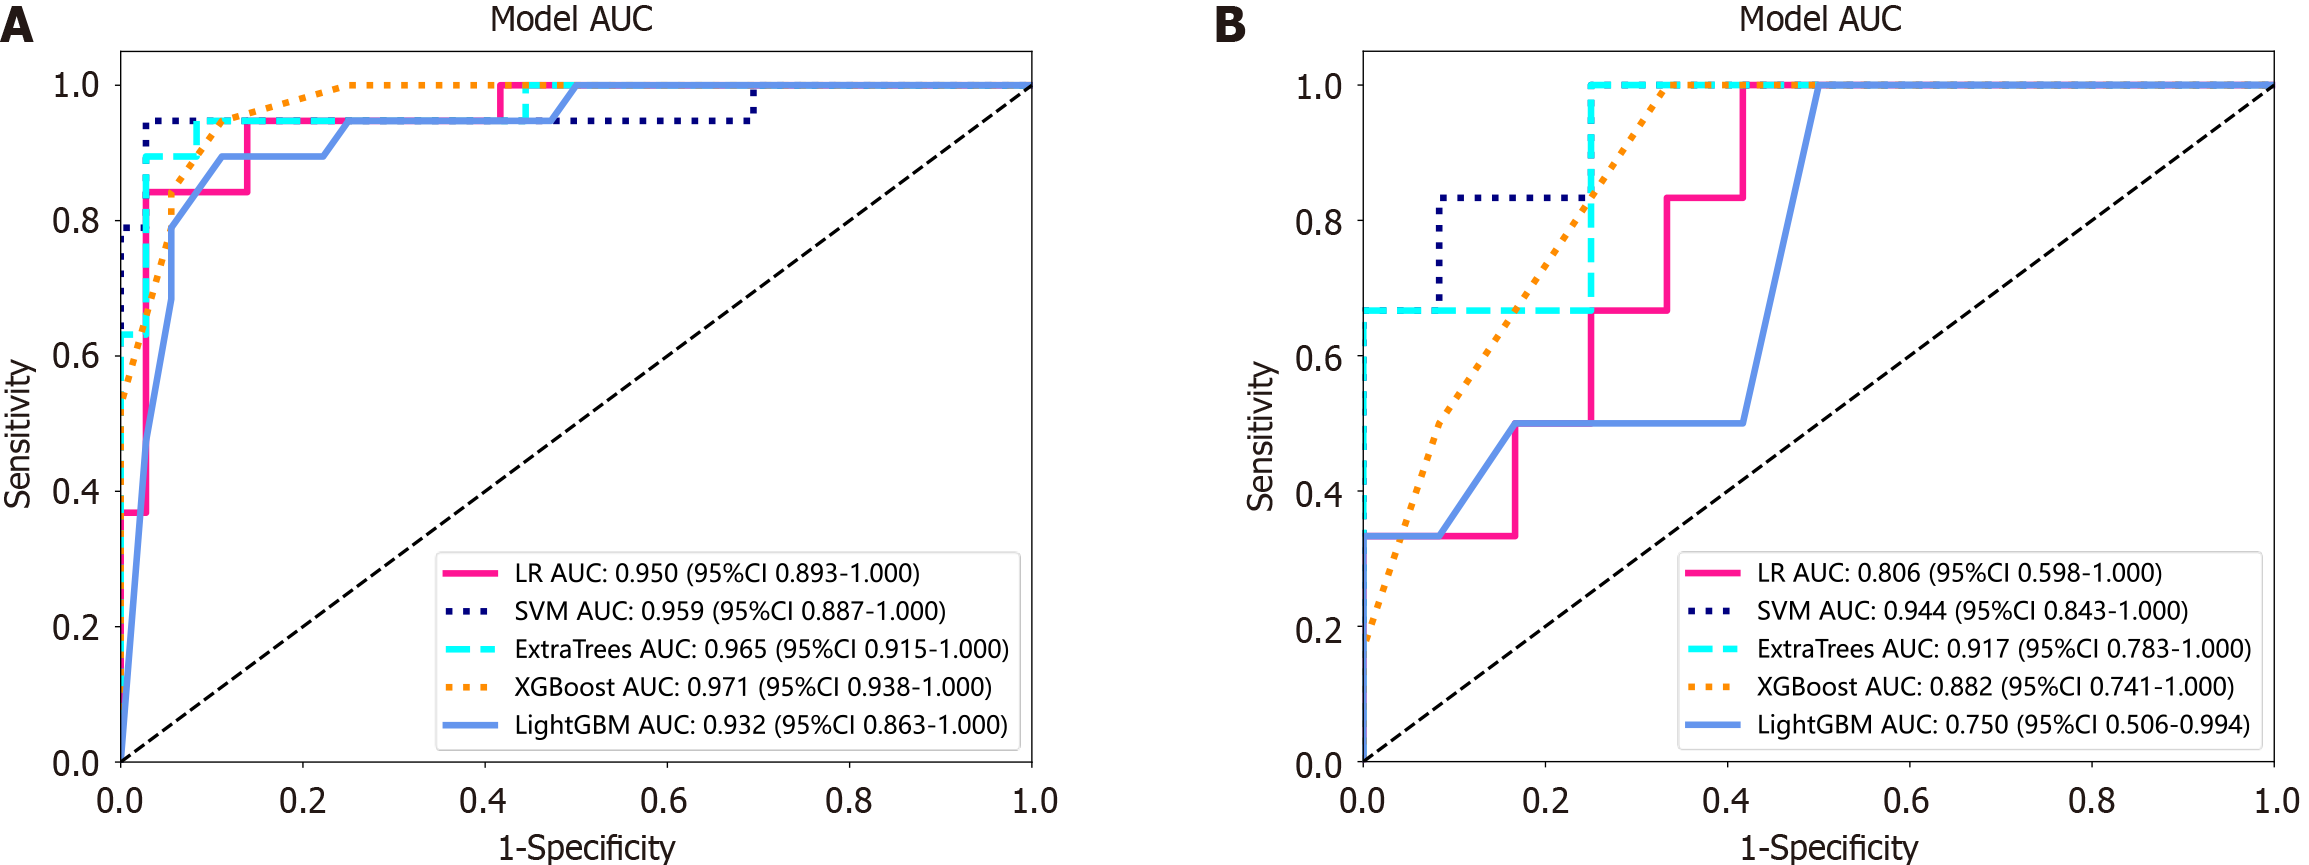
The LR, SVM, ExtraTrees, XGBoost, and LightGBM models were compared to obtain the best-performing model. The ROC curves of these models in the training and test cohorts are shown in Figure 4. In the training cohort, XGBoost exhibited the highest AUC of 0.971, with accuracy, sensitivity, specificity, positive predictive value (PPV), and negative predictive value (NPV) values of 0.909, 0.909, 0.947, 0.818, and 0.970, respectively. In the test cohort, the SVM emerged as the superior model with an AUC of 0.944, an accuracy of 0.889, a sensitivity of 0.833, a specificity of 0.917, a PPV of 0.833, and an NPV of 0.917 (Table 2). The XGBoost model of the training and test cohorts tended to overfit; thus, the SVM model was selected to ensure stability and sustainability.
| Model | AUC (95%CI) | ACC | SENS | SPEC | PPV | NPV | |
| LR | Training | 0.950 (0.893-1.000) | 0.927 | 0.842 | 0.972 | 0.941 | 0.921 |
| Test | 0.806 (0.598-1.000) | 0.722 | 1.000 | 0.583 | 0.545 | 1.000 | |
| SVM | Training | 0.959 (0.887-1.000) | 0.964 | 0.947 | 0.972 | 0.947 | 0.972 |
| Test | 0.944 (0.843-1.000) | 0.889 | 0.833 | 0.917 | 0.833 | 0.917 | |
| ExtraTrees | Training | 0.965 (0.915-1.000) | 0.945 | 0.895 | 0.972 | 0.944 | 0.946 |
| Test | 0.917 (0.783-1.000) | 0.833 | 1.000 | 0.750 | 0.667 | 1.000 | |
| XGBoost | Training | 0.971 (0.938-1.000) | 0.909 | 0.947 | 0.889 | 0.818 | 0.970 |
| Test | 0.882 (0.741-1.000) | 0.778 | 1.000 | 0.667 | 0.600 | 1.000 | |
| LightGBM | Training | 0.932 (0.863-1.000) | 0.891 | 0.895 | 0.914 | 0.810 | 0.941 |
| Test | 0.750 (0.506-0.994) | 0.667 | 1.000 | 0.500 | 0.500 | 1.000 |
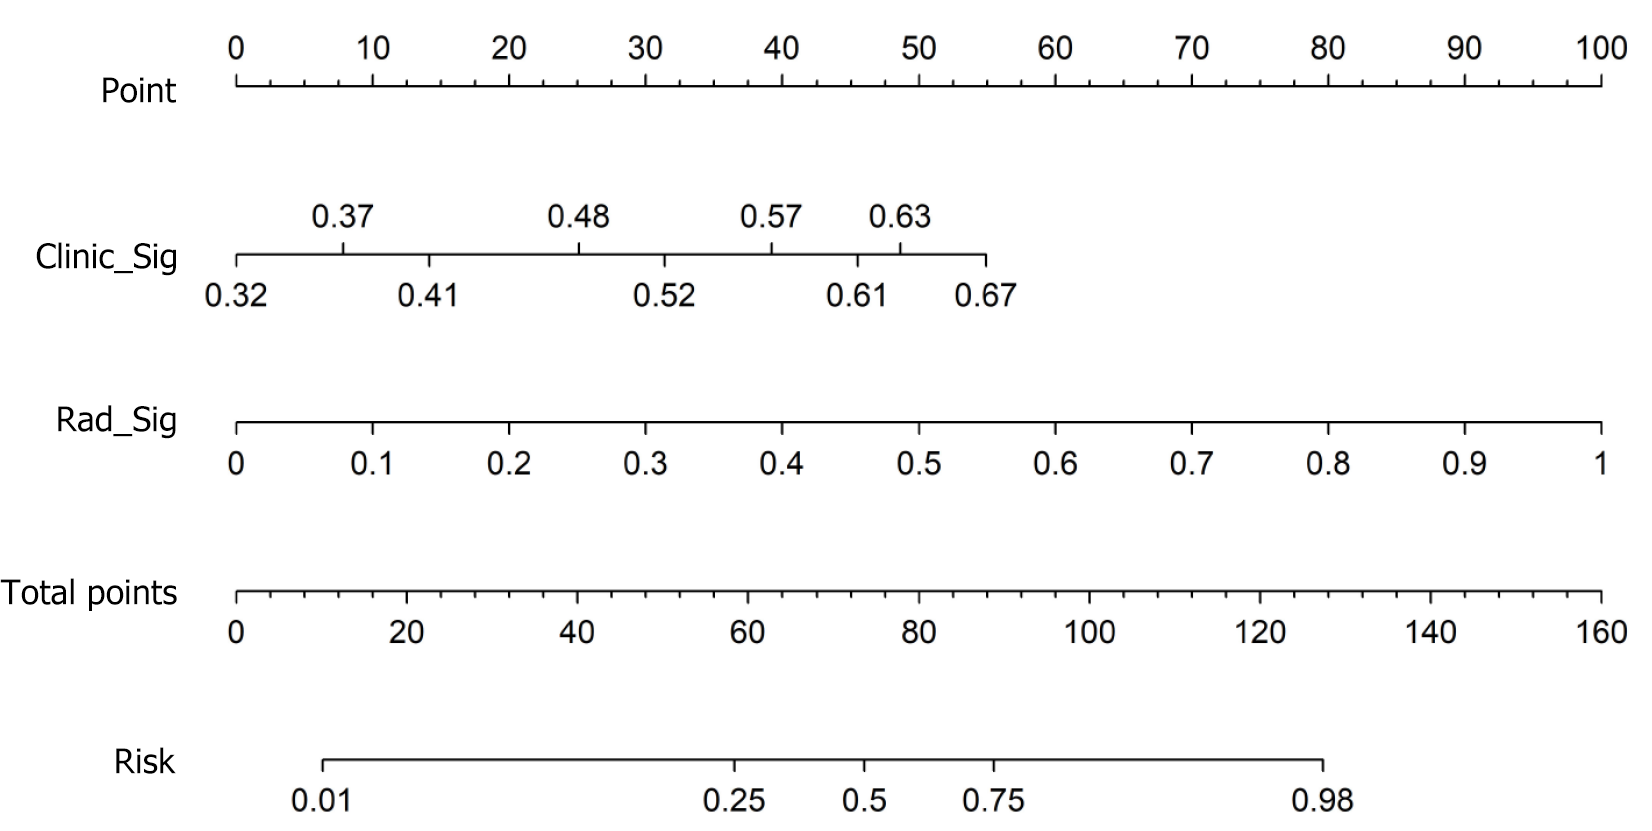
A radiomic-clinical nomogram was established by integrating radiomic and clinical signatures (Figure 5). The Noma score was calculated via the following formula: Noma score = -1.2467834618417515 + (0.483035 × Clinic_Sig) + (1.135023 × Rad_Sig). The calibration curve (Figure 6A and B) revealed that the nomogram fit perfectly in both the training (P = 0.474) and test cohorts (P = 0.279). The diagnostic performance of the clinical, radiomic, and nomogram models is listed in Table 3, and the ROC curves are presented in Figure 6C and D. The nomogram yielded satisfactory diagnostic per
| Model | Training cohort (n = 55) | Test cohort (n = 18) | ||||||
| AUC (95%CI) | ACC | SENS | SPEC | AUC (95%CI) | ACC | SENS | SPEC | |
| Clinical model | 0.917 (0.828-1.000) | 0.891 | 0.895 | 0.889 | 0.854 (0.678-1.000) | 0.778 | 1.000 | 0.667 |
| Radiomic model | 0.959 (0.887-1.000) | 0.964 | 0.947 | 0.972 | 0.944 (0.843-1.000) | 0.889 | 0.833 | 0.917 |
| Nomogram | 0.961 (0.886-1.000) | 0.964 | 0.947 | 0.972 | 0.958 (0.877-1.000) | 0.889 | 1.000 | 0.833 |
MH refers to the absence of mucosal ulceration under endoscopy and has become widely accepted as a therapeutic target for CD[15,16]. Endoscopy is regarded as the gold standard in the clinical diagnosis and management of CD by providing direct MH evidence[17]. Enteroscopy can visualize the SB mucosa but requires specialized expertise to perform; thus, it is not practical for routine clinical practice. Furthermore, enteroscopy has several limitations including cost, the need for sedation anaesthesia, and procedural risks (bowel perforation, bleeding, pancreatitis, etc.). Therefore, a noninvasive and practical method for SB assessment in CD patients is urgently needed.
CTE is currently considered the preferred first-line radiological modality used in the assessment of SBCD, with a diagnostic sensitivity of 83% and a diagnostic specificity of 88%[18]. The conventional CTE focuses mainly on morphological characteristics such as position, dimension, range, boundary, shape, density, and enhancement. However, it is difficult to assess MH in CD patients on the basis of only these conventional CTE characteristics. Radiomics is an innovative approach for measuring high-dimensional characteristics in medical images, allowing the detection of subtle alterations undetectable through visual inspection[19]. In this study, via radiomic feature analysis, we extracted 13 independent radiomic features and constructed a nomogram by integrating these radiomic features with clinical features. The nomogram exhibited excellent diagnostic performance for MH in SBCD patients, with an average AUC of 0.961 in the training cohort and 0.958 in the test cohort.
Radiomics can utilize high-throughput features obtained from medical images to identify new noninvasive imaging biomarkers correlated with prognosis and treatment response and has been widely applied in assessment and decision-making in the field of cancer research[20]. However, studies concerning its role in CD remain limited. Li et al[21] established a CTE-based radiomic model to characterize intestinal fibrosis in CD patients with an AUC of 0.888 in the training cohort and 0.816, 0.724, and 0.750 across 3 centres in the test cohort, indicating superior diagnostic efficacy to that of radiologists. Li et al[22] developed a multislice CT-based radiomic nomogram combined with clinical factors that could accurately distinguish between CD and ulcerative colitis (AUC: 0.8846). Gong et al[23] reported a CTE-based radiomic model to differentiate between CD and intestinal tuberculosis. Furthermore, radiomics has also been reported to predict disease progression, mucosal activity, surgery risk, and loss of response to infliximab in CD patients[24-28]. Recently, two studies focused on the value of radiomics in MH assessment in CD patients and demonstrated excellent performance, with AUCs of 0.976 and 0.877, respectively[8,9]. However, both studies focused on CD patients with predominantly colon and terminal ileum lesions. To the best of our knowledge, no published reports have focused on the application of radiomics in assessing MH in SBCD patients. This study established a CTE-based radiomic model that exhibited favourable performance in differentiating MHs from non-MHs in SBCD patients. We further established a nomogram by integrating radiomic and clinical features, which has superior clinical application value to either the clinical model or the radiomic model. These findings suggest the great potential of radiomics for clinical applications in the management of SBCD.
Several limitations of this study should be addressed. First, the relatively insufficient sample size reduced the statistical reliability and increased the risk of overfitting, which might limit the generalisability of the models when deployed to different patient populations. Second, this study is retrospective and was conducted at a single centre, which may introduce selection bias. The inclusion of external datasets would significantly increase the credibility and clinical applicability of the findings. Multicentre studies with larger samples are needed to further validate the conclusions. Third, ROI segmentation was performed manually, and human error was unavoidable. Tools for automated or semiautomated segmentation based on deep learning are needed to overcome this limitation in future studies.
In conclusion, this study established a CTE-based nomogram model that integrates clinical and radiomic features. The nomogram could accurately distinguish MHs from non-MHs and might serve as a promising imaging biomarker and a noninvasive alternative to enteroscopy for MH assessment in SBCD patients.
We thank the Onekey AI platform (http://www.medai.icu/) and its developers for their technical support.
| 1. | Baumgart DC, Carding SR. Inflammatory bowel disease: cause and immunobiology. Lancet. 2007;369:1627-1640. [RCA] [PubMed] [DOI] [Full Text] [Cited by in Crossref: 1299] [Cited by in RCA: 1564] [Article Influence: 82.3] [Reference Citation Analysis (2)] |
| 2. | Peyrin-Biroulet L, Sandborn W, Sands BE, Reinisch W, Bemelman W, Bryant RV, D'Haens G, Dotan I, Dubinsky M, Feagan B, Fiorino G, Gearry R, Krishnareddy S, Lakatos PL, Loftus EV Jr, Marteau P, Munkholm P, Murdoch TB, Ordás I, Panaccione R, Riddell RH, Ruel J, Rubin DT, Samaan M, Siegel CA, Silverberg MS, Stoker J, Schreiber S, Travis S, Van Assche G, Danese S, Panes J, Bouguen G, O'Donnell S, Pariente B, Winer S, Hanauer S, Colombel JF. Selecting Therapeutic Targets in Inflammatory Bowel Disease (STRIDE): Determining Therapeutic Goals for Treat-to-Target. Am J Gastroenterol. 2015;110:1324-1338. [RCA] [PubMed] [DOI] [Full Text] [Cited by in Crossref: 1487] [Cited by in RCA: 1460] [Article Influence: 132.7] [Reference Citation Analysis (115)] |
| 3. | Roda G, Chien Ng S, Kotze PG, Argollo M, Panaccione R, Spinelli A, Kaser A, Peyrin-Biroulet L, Danese S. Crohn's disease. Nat Rev Dis Primers. 2020;6:22. [RCA] [PubMed] [DOI] [Full Text] [Cited by in Crossref: 207] [Cited by in RCA: 683] [Article Influence: 113.8] [Reference Citation Analysis (0)] |
| 4. | Takenaka K, Fujii T, Suzuki K, Shimizu H, Motobayashi M, Hibiya S, Saito E, Nagahori M, Watanabe M, Ohtsuka K. Small Bowel Healing Detected by Endoscopy in Patients With Crohn's Disease After Treatment With Antibodies Against Tumor Necrosis Factor. Clin Gastroenterol Hepatol. 2020;18:1545-1552. [RCA] [PubMed] [DOI] [Full Text] [Cited by in Crossref: 11] [Cited by in RCA: 33] [Article Influence: 5.5] [Reference Citation Analysis (0)] |
| 5. | Torres J, Mehandru S, Colombel JF, Peyrin-Biroulet L. Crohn's disease. Lancet. 2017;389:1741-1755. [RCA] [PubMed] [DOI] [Full Text] [Cited by in Crossref: 1121] [Cited by in RCA: 1944] [Article Influence: 216.0] [Reference Citation Analysis (113)] |
| 6. | Reinisch W, Panaccione R, Bossuyt P, Baert F, Armuzzi A, Hébuterne X, Travis S, Danese S, Sandborn WJ, Schreiber S, Berg S, Zhou Q, Kligys K, Neimark E, Suleiman AA, D'Haens G, Colombel JF. Association of Biomarker Cutoffs and Endoscopic Outcomes in Crohn's Disease: A Post Hoc Analysis From the CALM Study. Inflamm Bowel Dis. 2020;26:1562-1571. [RCA] [PubMed] [DOI] [Full Text] [Full Text (PDF)] [Cited by in Crossref: 26] [Cited by in RCA: 34] [Article Influence: 5.7] [Reference Citation Analysis (0)] |
| 7. | Takabayashi K, Hosoe N, Kato M, Hayashi Y, Miyanaga R, Nanki K, Fukuhara K, Mikami Y, Mizuno S, Sujino T, Mutaguchi M, Naganuma M, Yahagi N, Ogata H, Kanai T. Efficacy of Novel Ultrathin Single-Balloon Enteroscopy for Crohn's Disease: A Propensity Score-Matched Study. Gut Liver. 2020;14:619-625. [RCA] [PubMed] [DOI] [Full Text] [Full Text (PDF)] [Cited by in Crossref: 6] [Cited by in RCA: 6] [Article Influence: 1.0] [Reference Citation Analysis (0)] |
| 8. | Rong C, Zhu C, He L, Hu J, Gao Y, Li C, Qian B, Li J, Wu X. CTE-Based Radiomics Models Can Identify Mucosal Healing in Patients with Crohn's Disease. Acad Radiol. 2023;30 Suppl 1:S199-S206. [RCA] [PubMed] [DOI] [Full Text] [Cited by in RCA: 7] [Reference Citation Analysis (0)] |
| 9. | Zhu C, Hu J, Wang X, Li C, Gao Y, Li J, Ge Y, Wu X. A novel clinical radiomics nomogram at baseline to predict mucosal healing in Crohn's disease patients treated with infliximab. Eur Radiol. 2022;32:6628-6636. [RCA] [PubMed] [DOI] [Full Text] [Cited by in RCA: 22] [Reference Citation Analysis (0)] |
| 10. | Carter D, Katz LH, Bardan E, Salomon E, Goldstein S, Ben Horin S, Kopylov U, Eliakim R. The accuracy of intestinal ultrasound compared with small bowel capsule endoscopy in assessment of suspected Crohn's disease in patients with negative ileocolonoscopy. Therap Adv Gastroenterol. 2018;11:1756284818765908. [RCA] [PubMed] [DOI] [Full Text] [Full Text (PDF)] [Cited by in Crossref: 8] [Cited by in RCA: 16] [Article Influence: 2.0] [Reference Citation Analysis (0)] |
| 11. | Han W, Wu J, Zhang P, Hu N, Mei Q, Hu J. Fecal calprotectin predicts endoscopic activity and mucosal healing of small bowel Crohn's disease evaluated by double-balloon endoscopy. Int J Colorectal Dis. 2022;37:1953-1961. [RCA] [PubMed] [DOI] [Full Text] [Cited by in RCA: 9] [Reference Citation Analysis (0)] |
| 12. | Kucharzik T, Ellul P, Greuter T, Rahier JF, Verstockt B, Abreu C, Albuquerque A, Allocca M, Esteve M, Farraye FA, Gordon H, Karmiris K, Kopylov U, Kirchgesner J, MacMahon E, Magro F, Maaser C, de Ridder L, Taxonera C, Toruner M, Tremblay L, Scharl M, Viget N, Zabana Y, Vavricka S. ECCO Guidelines on the Prevention, Diagnosis, and Management of Infections in Inflammatory Bowel Disease. J Crohns Colitis. 2021;15:879-913. [RCA] [PubMed] [DOI] [Full Text] [Cited by in Crossref: 275] [Cited by in RCA: 312] [Article Influence: 62.4] [Reference Citation Analysis (32)] |
| 13. | Iwamoto F, Matsuoka K, Motobayashi M, Takenaka K, Kuno T, Tanaka K, Tsukui Y, Kobayashi S, Yoshida T, Fujii T, Saito E, Yamaguchi T, Nagahori M, Sato T, Ohtsuka K, Enomoto N, Watanabe M. Prediction of disease activity of Crohn's disease through fecal calprotectin evaluated by balloon-assisted endoscopy. J Gastroenterol Hepatol. 2018;33:1984-1989. [RCA] [PubMed] [DOI] [Full Text] [Cited by in Crossref: 15] [Cited by in RCA: 21] [Article Influence: 2.6] [Reference Citation Analysis (0)] |
| 14. | Fornacon-Wood I, Mistry H, Ackermann CJ, Blackhall F, McPartlin A, Faivre-Finn C, Price GJ, O'Connor JPB. Reliability and prognostic value of radiomic features are highly dependent on choice of feature extraction platform. Eur Radiol. 2020;30:6241-6250. [RCA] [PubMed] [DOI] [Full Text] [Full Text (PDF)] [Cited by in Crossref: 109] [Cited by in RCA: 148] [Article Influence: 24.7] [Reference Citation Analysis (0)] |
| 15. | Zhou L, Hu C, Zhang R, Qiu Y, Wang Y, Liu Z, Chen B, He Y, Zeng Z, Li X, Mao R, Chen M. Early transmural healing and its predictors assessed by magnetic resonance enterography in patients with Crohn's disease receiving ustekinumab. Therap Adv Gastroenterol. 2023;16:17562848231170947. [RCA] [PubMed] [DOI] [Full Text] [Full Text (PDF)] [Cited by in Crossref: 3] [Cited by in RCA: 9] [Article Influence: 3.0] [Reference Citation Analysis (0)] |
| 16. | Zacharopoulou E, Craviotto V, Fiorino G, Furfaro F, Zilli A, Gilardi D, Peyrin-Biroulet L, Danese S, Allocca M. Targeting the gut layers in Crohn's disease: mucosal or transmural healing? Expert Rev Gastroenterol Hepatol. 2020;14:775-787. [RCA] [PubMed] [DOI] [Full Text] [Cited by in Crossref: 5] [Cited by in RCA: 17] [Article Influence: 2.8] [Reference Citation Analysis (0)] |
| 17. | Magro F, Lopes S, Silva M, Coelho R, Portela F, Branquinho D, Correia L, Fernandes S, Cravo M, Caldeira P, Tavares de Sousa H, Patita M, Lago P, Ramos J, Afonso J, Redondo I, Machado P, Philip G, Lopes J, Carneiro F. Soluble human Suppression of Tumorigenicity 2 is associated with endoscopic activity in patients with moderate-to-severe ulcerative colitis treated with golimumab. Therap Adv Gastroenterol. 2019;12:1756284819869141. [RCA] [PubMed] [DOI] [Full Text] [Full Text (PDF)] [Cited by in Crossref: 3] [Cited by in RCA: 5] [Article Influence: 0.7] [Reference Citation Analysis (0)] |
| 18. | Bollegala N, Griller N, Bannerman H, Habal M, Nguyen GC. Ultrasound vs Endoscopy, Surgery, or Pathology for the Diagnosis of Small Bowel Crohn's Disease and its Complications. Inflamm Bowel Dis. 2019;25:1313-1338. [RCA] [PubMed] [DOI] [Full Text] [Cited by in Crossref: 15] [Cited by in RCA: 26] [Article Influence: 3.7] [Reference Citation Analysis (0)] |
| 19. | Zheng YM, Li J, Liu S, Cui JF, Zhan JF, Pang J, Zhou RZ, Li XL, Dong C. MRI-Based radiomics nomogram for differentiation of benign and malignant lesions of the parotid gland. Eur Radiol. 2021;31:4042-4052. [RCA] [PubMed] [DOI] [Full Text] [Cited by in Crossref: 61] [Cited by in RCA: 67] [Article Influence: 13.4] [Reference Citation Analysis (1)] |
| 20. | Polidori T, De Santis D, Rucci C, Tremamunno G, Piccinni G, Pugliese L, Zerunian M, Guido G, Pucciarelli F, Bracci B, Polici M, Laghi A, Caruso D. Radiomics applications in cardiac imaging: a comprehensive review. Radiol Med. 2023;128:922-933. [RCA] [PubMed] [DOI] [Full Text] [Cited by in RCA: 43] [Reference Citation Analysis (0)] |
| 21. | Li X, Liang D, Meng J, Zhou J, Chen Z, Huang S, Lu B, Qiu Y, Baker ME, Ye Z, Cao Q, Wang M, Yuan C, Chen Z, Feng S, Zhang Y, Iacucci M, Ghosh S, Rieder F, Sun C, Chen M, Li Z, Mao R, Huang B, Feng ST. Development and Validation of a Novel Computed-Tomography Enterography Radiomic Approach for Characterization of Intestinal Fibrosis in Crohn's Disease. Gastroenterology. 2021;160:2303-2316.e11. [RCA] [PubMed] [DOI] [Full Text] [Cited by in Crossref: 79] [Cited by in RCA: 84] [Article Influence: 16.8] [Reference Citation Analysis (0)] |
| 22. | Li H, Mo Y, Huang C, Ren Q, Xia X, Nan X, Shuai X, Meng X. An MSCT-based radiomics nomogram combined with clinical factors can identify Crohn's disease and ulcerative colitis. Ann Transl Med. 2021;9:572. [RCA] [PubMed] [DOI] [Full Text] [Cited by in Crossref: 4] [Cited by in RCA: 31] [Article Influence: 6.2] [Reference Citation Analysis (0)] |
| 23. | Gong T, Li M, Pu H, Yin LL, Peng SK, Zhou Z, Zhou M, Li H. Computed tomography enterography-based multiregional radiomics model for differential diagnosis of Crohn's disease from intestinal tuberculosis. Abdom Radiol (NY). 2023;48:1900-1910. [RCA] [PubMed] [DOI] [Full Text] [Cited by in RCA: 8] [Reference Citation Analysis (0)] |
| 24. | Yueying C, Jing F, Qi F, Jun S. Infliximab response associates with radiologic findings in bio-naïve Crohn's disease. Eur Radiol. 2023;33:5247-5257. [RCA] [PubMed] [DOI] [Full Text] [Full Text (PDF)] [Cited by in RCA: 18] [Reference Citation Analysis (0)] |
| 25. | Li X, Zhang N, Hu C, Lin Y, Li J, Li Z, Cui E, Shi L, Zhuang X, Li J, Lu J, Wang Y, Liu R, Yuan C, Lin H, He J, Ke D, Tang S, Zou Y, He B, Sun C, Chen M, Huang B, Mao R, Feng ST. CT-based radiomics signature of visceral adipose tissue for prediction of disease progression in patients with Crohn's disease: A multicentre cohort study. EClinicalMedicine. 2023;56:101805. [RCA] [PubMed] [DOI] [Full Text] [Full Text (PDF)] [Cited by in Crossref: 19] [Cited by in RCA: 26] [Article Influence: 8.7] [Reference Citation Analysis (0)] |
| 26. | Chirra P, Sharma A, Bera K, Cohn HM, Kurowski JA, Amann K, Rivero MJ, Madabhushi A, Lu C, Paspulati R, Stein SL, Katz JA, Viswanath SE, Dave M. Integrating Radiomics With Clinicoradiological Scoring Can Predict High-Risk Patients Who Need Surgery in Crohn's Disease: A Pilot Study. Inflamm Bowel Dis. 2023;29:349-358. [RCA] [PubMed] [DOI] [Full Text] [Cited by in Crossref: 11] [Cited by in RCA: 23] [Article Influence: 7.7] [Reference Citation Analysis (0)] |
| 27. | Ruiqing L, Jing Y, Shunli L, Jia K, Zhibo W, Hongping Z, Keyu R, Xiaoming Z, Zhiming W, Weiming Z, Tianye N, Yun L. A Novel Radiomics Model Integrating Luminal and Mesenteric Features to Predict Mucosal Activity and Surgery Risk in Crohn's Disease Patients: A Multicenter Study. Acad Radiol. 2023;30 Suppl 1:S207-S219. [RCA] [PubMed] [DOI] [Full Text] [Cited by in Crossref: 1] [Cited by in RCA: 20] [Article Influence: 6.7] [Reference Citation Analysis (0)] |
| 28. | Laterza L, Boldrini L, Tran HE, Votta C, Larosa L, Minordi LM, Maresca R, Pugliese D, Zocco MA, Ainora ME, Lopetuso LR, Papa A, Armuzzi A, Gasbarrini A, Scaldaferri F. Radiomics could predict surgery at 10 years in Crohn's disease. Dig Liver Dis. 2023;55:1042-1048. [RCA] [PubMed] [DOI] [Full Text] [Cited by in Crossref: 3] [Cited by in RCA: 3] [Article Influence: 1.0] [Reference Citation Analysis (0)] |


