Published online Jul 28, 2025. doi: 10.3748/wjg.v31.i28.107361
Revised: April 29, 2025
Accepted: June 19, 2025
Published online: July 28, 2025
Processing time: 125 Days and 1.6 Hours
Inhibiting hepatic stellate cell (HSC) activation is a key therapeutic strategy in liver fibrosis (LF). During activation, aerobic glycolysis is upregulated to meet increased energy demands. Although focal adhesion kinase (FAK) has been implicated in regulating HSC glycolysis, its precise role in activation remains unclear.
To investigate the effects of FAK and fructose-1, 6-bisphosphatase 1 (FBP1) on LF through the modulation of aerobic glycolysis in HSCs.
Eighteen mice were randomly assigned to three groups: Control, carbon tetrachloride (CCl₄)-induced LF, and CCl₄ with FAK inhibitor treatment. Liver tissues were analyzed using transcriptomic and proteomic sequencing. Differential gene expression, Mfuzz clustering, and protein interaction network analyses identified key regulatory factors. Immunohistochemistry (IHC) and Western blot (WB) analysis were used to assess FAK and FBP1 ex
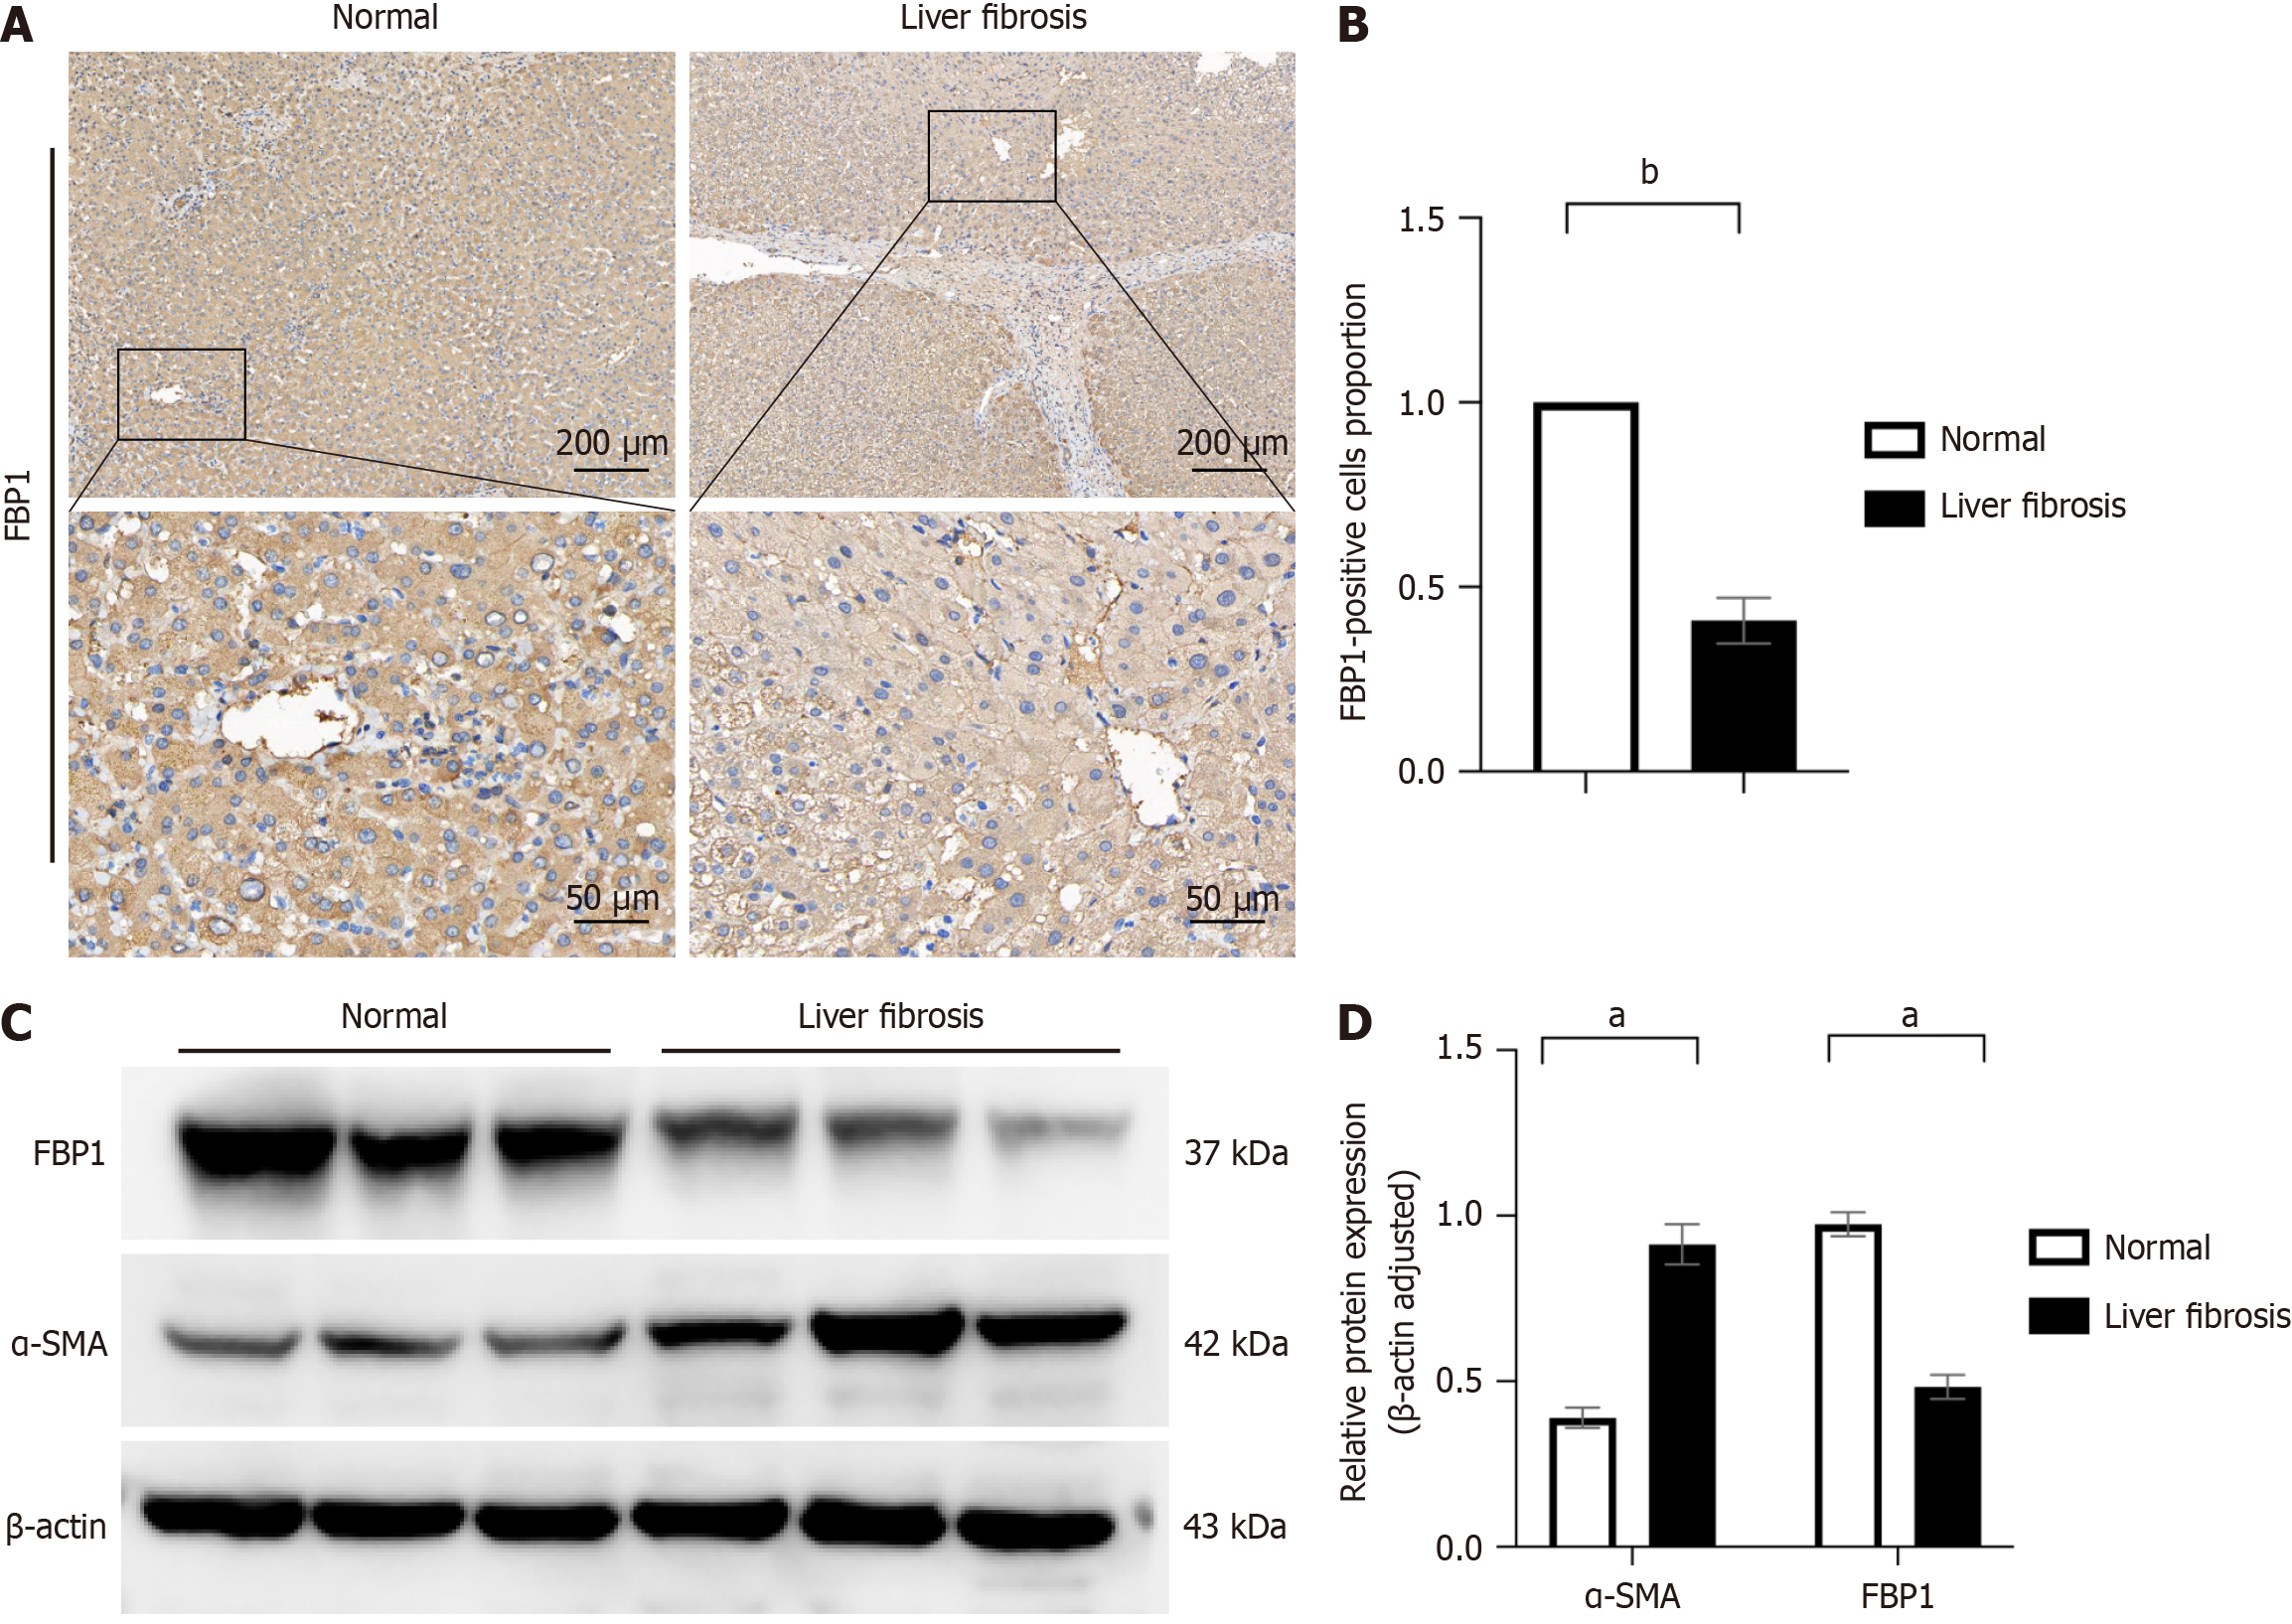
Transcriptomic and proteomic analyses revealed significantly reduced FBP1 expression in CCl₄-induced fibrosis, which was restored upon FAK inhibition. Histological staining (hematoxylin and eosin, Masson’s trichrome, Sirius red) confirmed reduced fibrosis following FAK inhibition. WB analysis demonstrated suppression of glycolysis-related enzymes. In LX-2 cells, FAK inhibition attenuated HSC activation and glycolysis while upregulating FBP1. Exogenous recombinant FBP1 inhibited HSC activation and glycolysis. Transwell and scratch assays showed that FBP1 significantly impaired HSC migration. In addition, WB and IHC analyses confirmed lower FBP1 expression in fibrotic liver tissues from patients compared to healthy controls.
FAK inhibitors and increased FBP1 expression inhibit aerobic glycolysis in HSCs, thereby improving LF. Thus, FAK and FBP1 may be potential targets for LF treatment.
Core Tip: In this study, we showed that focal adhesion kinase (FAK) inhibitors suppress hepatic stellate cell (HSC) activation and aerobic glycolysis, thereby alleviating liver fibrosis (LF). Fructose-1, 6-bisphosphatase 1 (FBP1) inhibits HSC activation and migration by regulating aerobic glycolysis. FAK can affect the expression of FBP1. Therefore, both FAK and FBP1 may serve as potential therapeutic targets for LF.
- Citation: Wu HY, Han L, Ran T, Sun Y, Zhang QX, Huang T, Zou GL, Zhang Y, Zhou YM, Lin GY, Chen SJ, Wang JL, Pan C, Lu F, Pu HF, Zhao XK. FBP1 as a key regulator of focal adhesion kinase-mediated hepatic stellate cell activation: Multi-omics and experimental validation. World J Gastroenterol 2025; 31(28): 107361
- URL: https://www.wjgnet.com/1007-9327/full/v31/i28/107361.htm
- DOI: https://dx.doi.org/10.3748/wjg.v31.i28.107361
Liver fibrosis (LF) represents a universal histopathological consequence of chronic hepatopathies, with its progression to hepatic cirrhosis constituting a major determinant of global disease burden and all-cause mortality[1,2]. A key driver of fibrosis is the activation of hepatic stellate cells (HSCs), which acquire proliferative, migratory and contractile properties that promote extracellular matrix deposition and fibrosis progression[3-5].
HSC activation is accompanied by metabolic reprogramming, resembling shifts observed in cancer cells. Even under aerobic conditions, activated HSCs enhance glycolysis to meet heightened energy demands[6-9]. However, the regulatory mechanisms governing glycolytic and gluconeogenic gene expression during HSCs activation remain poorly understood.
Focal adhesion kinase (FAK) regulates cell signaling and responses to external stimuli[10-12]. In cancer cells, FAK enhances aerobic glycolysis by upregulating glycolytic enzymes, facilitating pyruvate-to-lactate conversion to support rapid proliferation[13]. FAK has also been implicated in HSC activation and fibrosis progression[14]; however, its specific role in promoting glycolysis during HSCs activation remains unclear.
Fructose-1, 6-bisphosphatase 1 (FBP1), a rate-limiting enzyme in gluconeogenesis, not only facilitates glucose produc
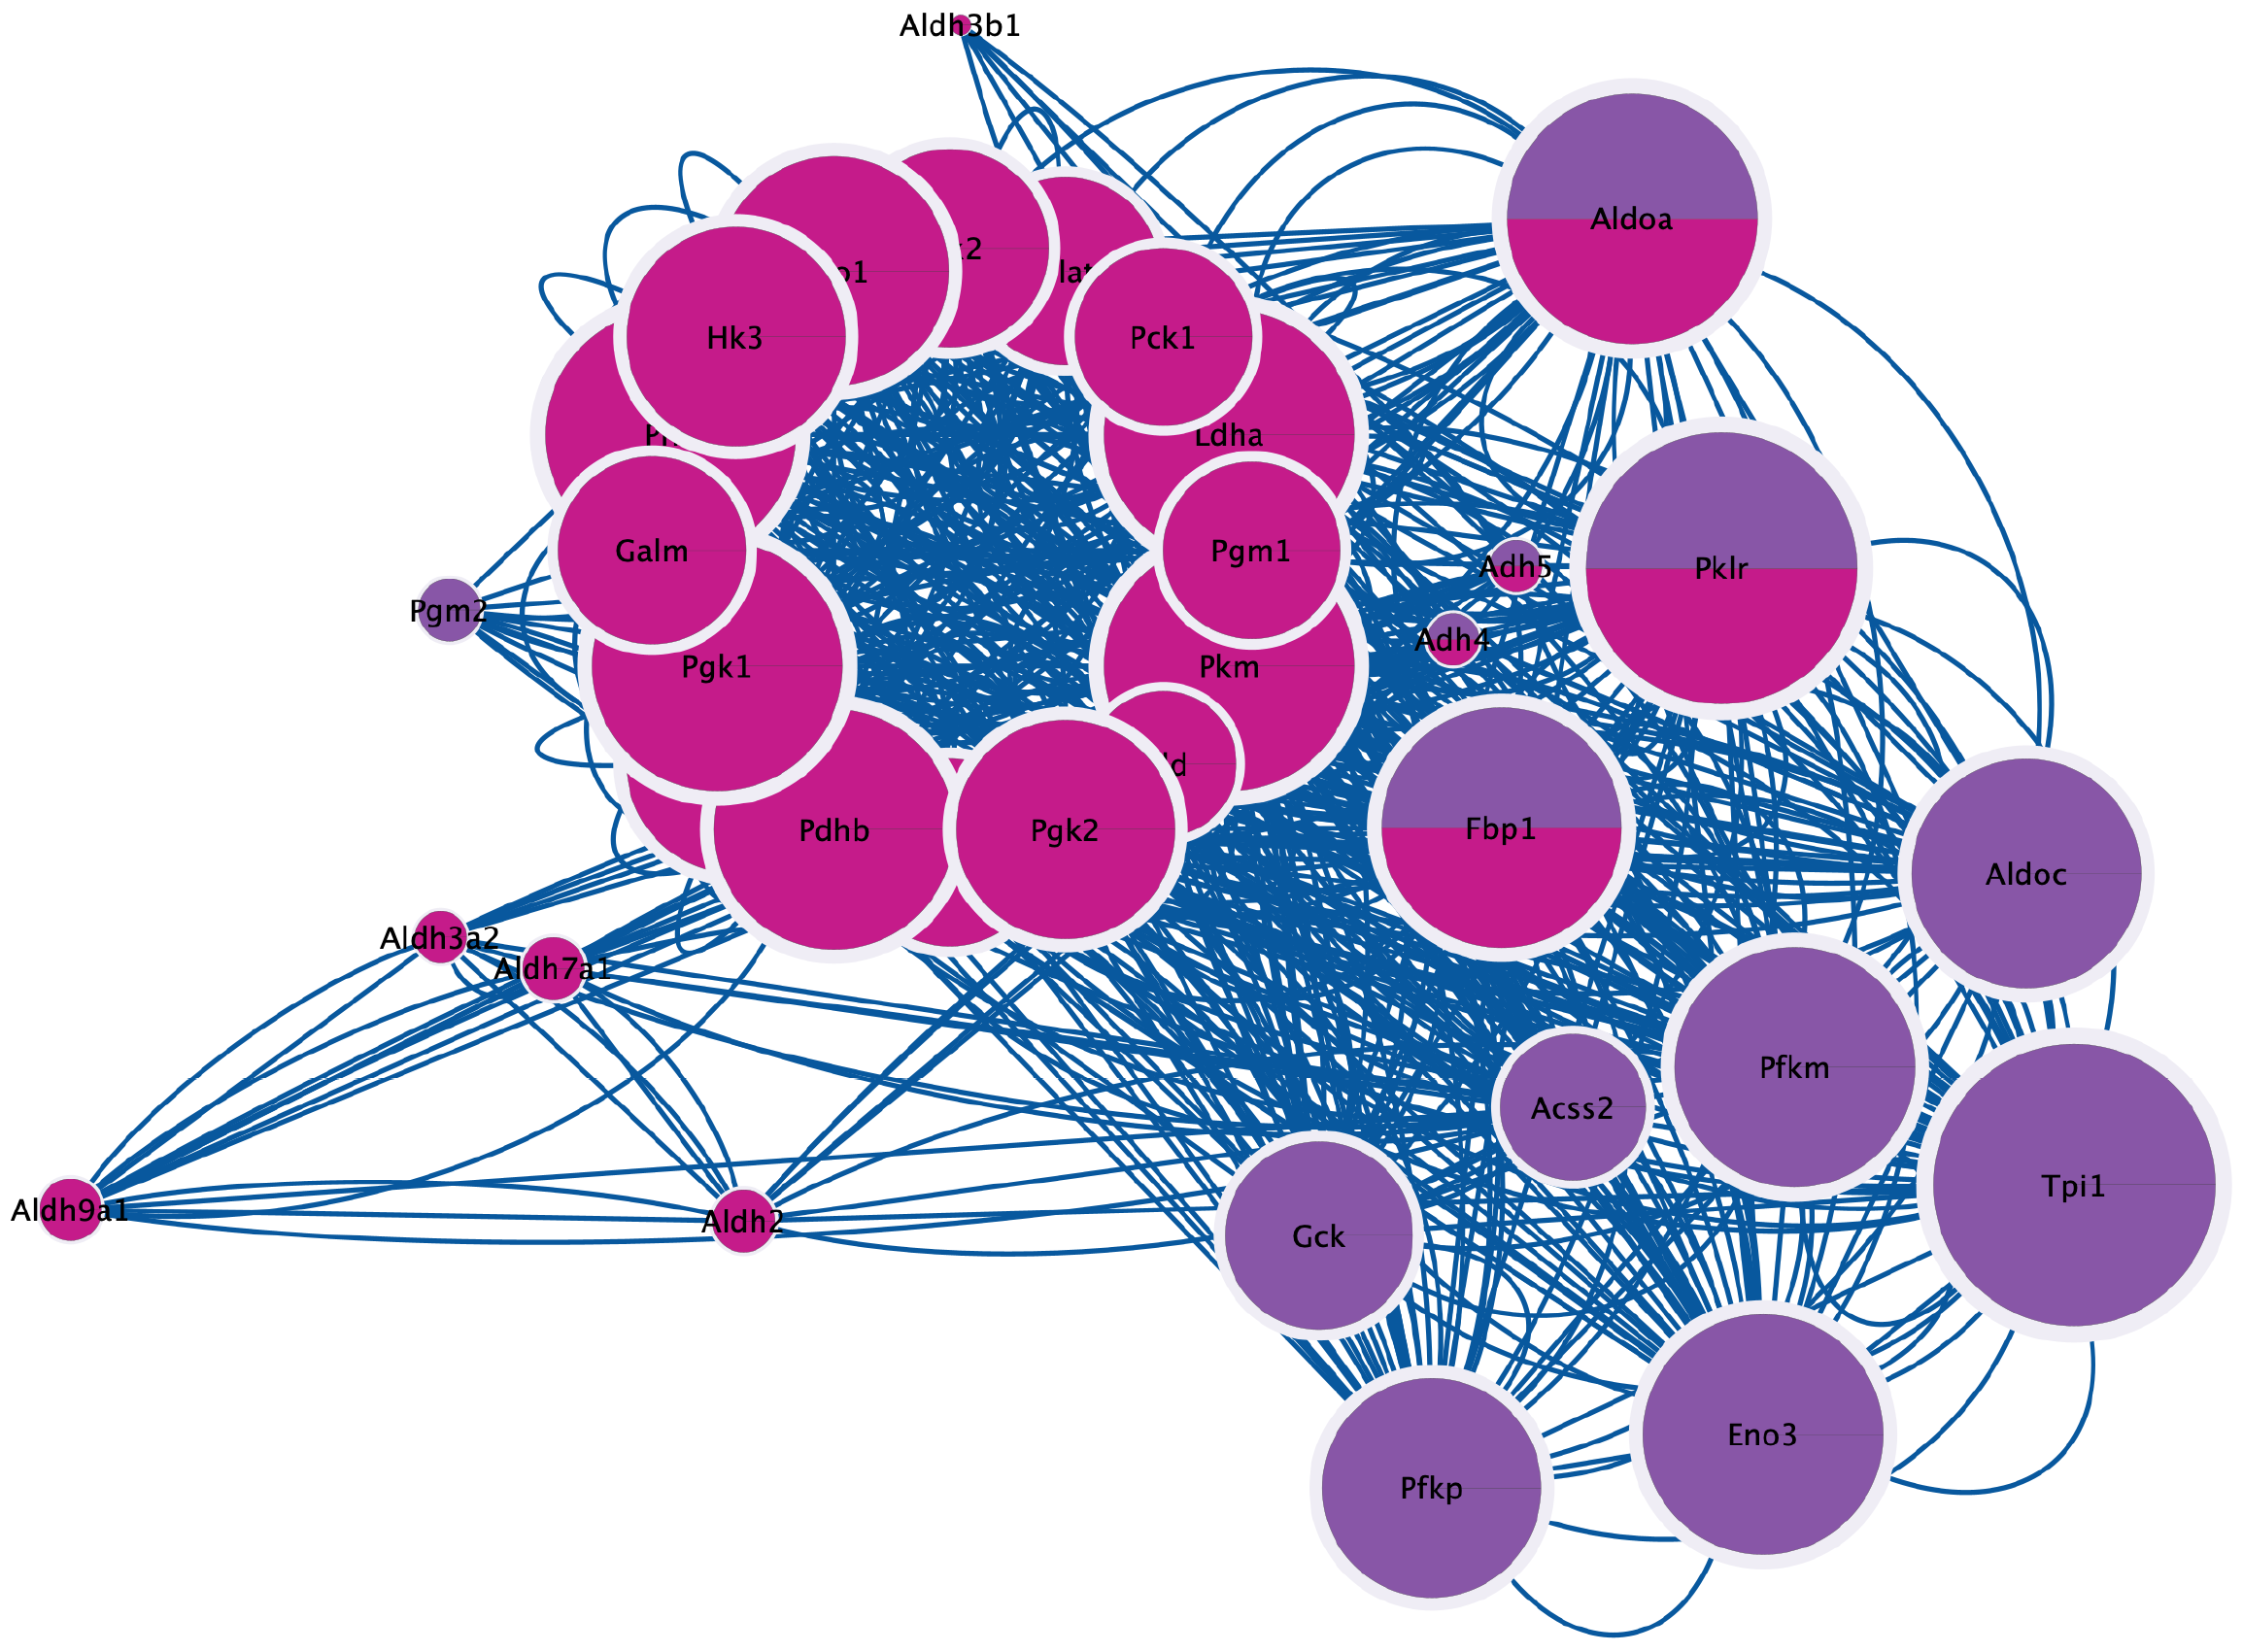
The hepatic tissues of mice from three experimental groups (control, LF model, and FAK inhibitor administration) were subjected to comprehensive transcriptomic profiling and proteomic profiling in the present study. Differential gene expression analysis, Mfuzz clustering, and protein interaction network analysis identified FBP1 as a key regulatory factor, exhibiting a negative correlation with FAK. Additional analysis demonstrated a significant decrease in FBP1 expression at both the transcript and protein levels in LF tissues. Western blot (WB) and immunohistochemistry (IHC) confirmed reduced FBP1 expression in liver tissues from both fibrotic mice and patients. Our experimental findings revealed that FBP1 significantly suppressed cellular activation, migration, and glycolytic metabolism in LX-2 cells. Both and in vitro and in vivo experiments further indicated that FAK modulated FBP1 expression, suggesting that FAK promotes HSC acti
Liver tissue samples were collected from the three groups of mice. Upon verification of RNA integrity and purity, the isolated mRNA underwent controlled fragmentation and was utilized as a template for reverse transcription initiation with random hexamer oligonucleotides to generate first-strand cDNA. Second-strand cDNA was then synthesized and purified. The generated double-stranded cDNA was subjected to end repair, adenylation, and adapter ligation, followed by size selection. Finally, polymerase chain reaction amplification was performed to generate the cDNA library. For proteomic analysis, the workflow included protein extraction, peptide digestion, and data acquisition via liquid chromatography-tandem mass spectrometry. All experimental data underwent rigorous quality control and were analyzed using bioinformatics approaches. The software utilized was Cytoscape version 3.10.3 and R Studio 4.3.2 (https://cn.string-db.org). Transcriptomic and proteomic data were adjusted for false discovery rate (FDR) using the Benjamini-Hochberg method, with significance defined as adjusted P < 0.05. Differentially expressed genes (DEGs) and proteins were iden
Carbon tetrachloride (CCl₄; CAS No. 56-23-5) and corn oil were purchased from MedChemExpress. The following primary antibodies were purchased from Proteintech (Wuhan, China): lactate dehydrogenase A (LDHA) rabbit poly
Non-tumorous liver tissue samples were obtained from liver transplant patients undergoing hepatobiliary surgery. Inclusion criteria: Patients aged 18-70 years with LF, diagnosed via imaging and confirmed by two pathologists. Exclusion criteria: Patients with diabetes mellitus, liver glycogen deposition, and other diseases affecting glucose metabolism were excluded. Patients who had used insulin or antidiabetic drugs in the past 3 months, and those with thyroid diseases and other diseases affecting metabolism were also excluded. The research received approval from the Biomedical Ethics Committee of Guizhou Medical University (Guizhou, China), and all procedures were conducted in accordance with the Declaration of Helsinki principles. Informed consent was obtained from all subjects and/or their legal guardian(s) for the use of human liver tissues.
The experimental protocols involving animals were performed in strict compliance with the Animal Research: Reporting of In Vivo Experiments (ARRIVE) criteria and received ethical clearance from the Institutional Animal Care and Use Committee at Guizhou Medical University (Ethical Approval No: 2403086). Adult male C57BL/6 mice were acquired from Tengxin Biotechnology (Chongqing, China) and maintained in specific pathogen-free facilities with the following regulated environmental parameters: Temperature maintained at 22 ± 2 °C and a 12/12-hour photoperiod. Six mice were housed per cage with soft bedding and acclimated for 2 days before the experiments. To induce LF, healthy male mice (8-11 weeks old, 20 ± 3 g) were intraperitoneally injected with a 10% CCl₄-corn oil solution (15 μL/g) three times a week for 6 weeks. Control mice received corn oil injections (15 μL/g) following the same schedule. Animals receiving PF562271 (administered orally at 30 mg/kg daily, suspended in methylcellulose solution) were maintained on a standard diet[20].
Hematoxylin and eosin, Masson's trichrome, and Sirius red staining kits were purchased from Solarbio Life Sciences (Beijing, China), with all procedures performed according to the manufacturer's instructions. Briefly, hepatic tissues were fixed in formaldehyde, embedded in paraffin wax, and processed through a series of steps including rinsing and dehy
Hepatic tissue specimens were immersion-fixed in 40 g/L paraformaldehyde solution, subsequently processed through graded ethanol dehydration, embedded in paraffin wax, and sectioned for IHC examination using standard histopathological protocols. Tissue specimens were incubated with primary antisera, and subsequently labeled with peroxidase-linked secondary antisera. For visualization, 3,3'-diaminobenzidine tetrahydrochloride was employed, with subsequent hematoxylin counterstaining. Images were obtained with the Zeiss Axioskop microscope (Carl Zeiss), and ImageJ soft
The LX-2 cell line, a human HSC model obtained from Pricella Biotechnology (Wuhan, China), was maintained in high-glucose Dulbecco’s Modified Eagle Medium (4.5 g/L) containing 10% heat-inactivated fetal bovine serum (Pricella). Cells were maintained at 37 °C in a humidified incubator with 50 mL/L carbon dioxide (CO2). For inhibitor treatment, LX-2 cells were exposed to PF562271 (2.5 μM, 5 μM, and 10 μM) or HY-P70275 (12.5 ng/mL, 25 ng/mL, 50 ng/mL, and 100 ng/mL) for 48 hours. After treatment, the cells were collected for subsequent analyses (Supplementary material).
WB analysis was carried out following the method outlined earlier[14]. Briefly, total liver tissue or whole-cell lysates were extracted using RIPA buffer (Beyotime, Beijing, China). Equal protein amounts were separated via sodium dodecyl sulfate polyacrylamide gel electrophoresis, and transferred to PVDF membranes. Protein levels were normalized to β-actin as an internal loading control. Membranes were incubated overnight at 4 °C with primary antibodies, followed by incubation with secondary antibodies. Protein bands were visualized using enhanced chemiluminescence (Millipore, Burlington, MA, United States). The analysis was performed with ImageJ software (National Institutes of Health), following the provided protocol. Band intensities were normalized to β-actin for comparative analysis.
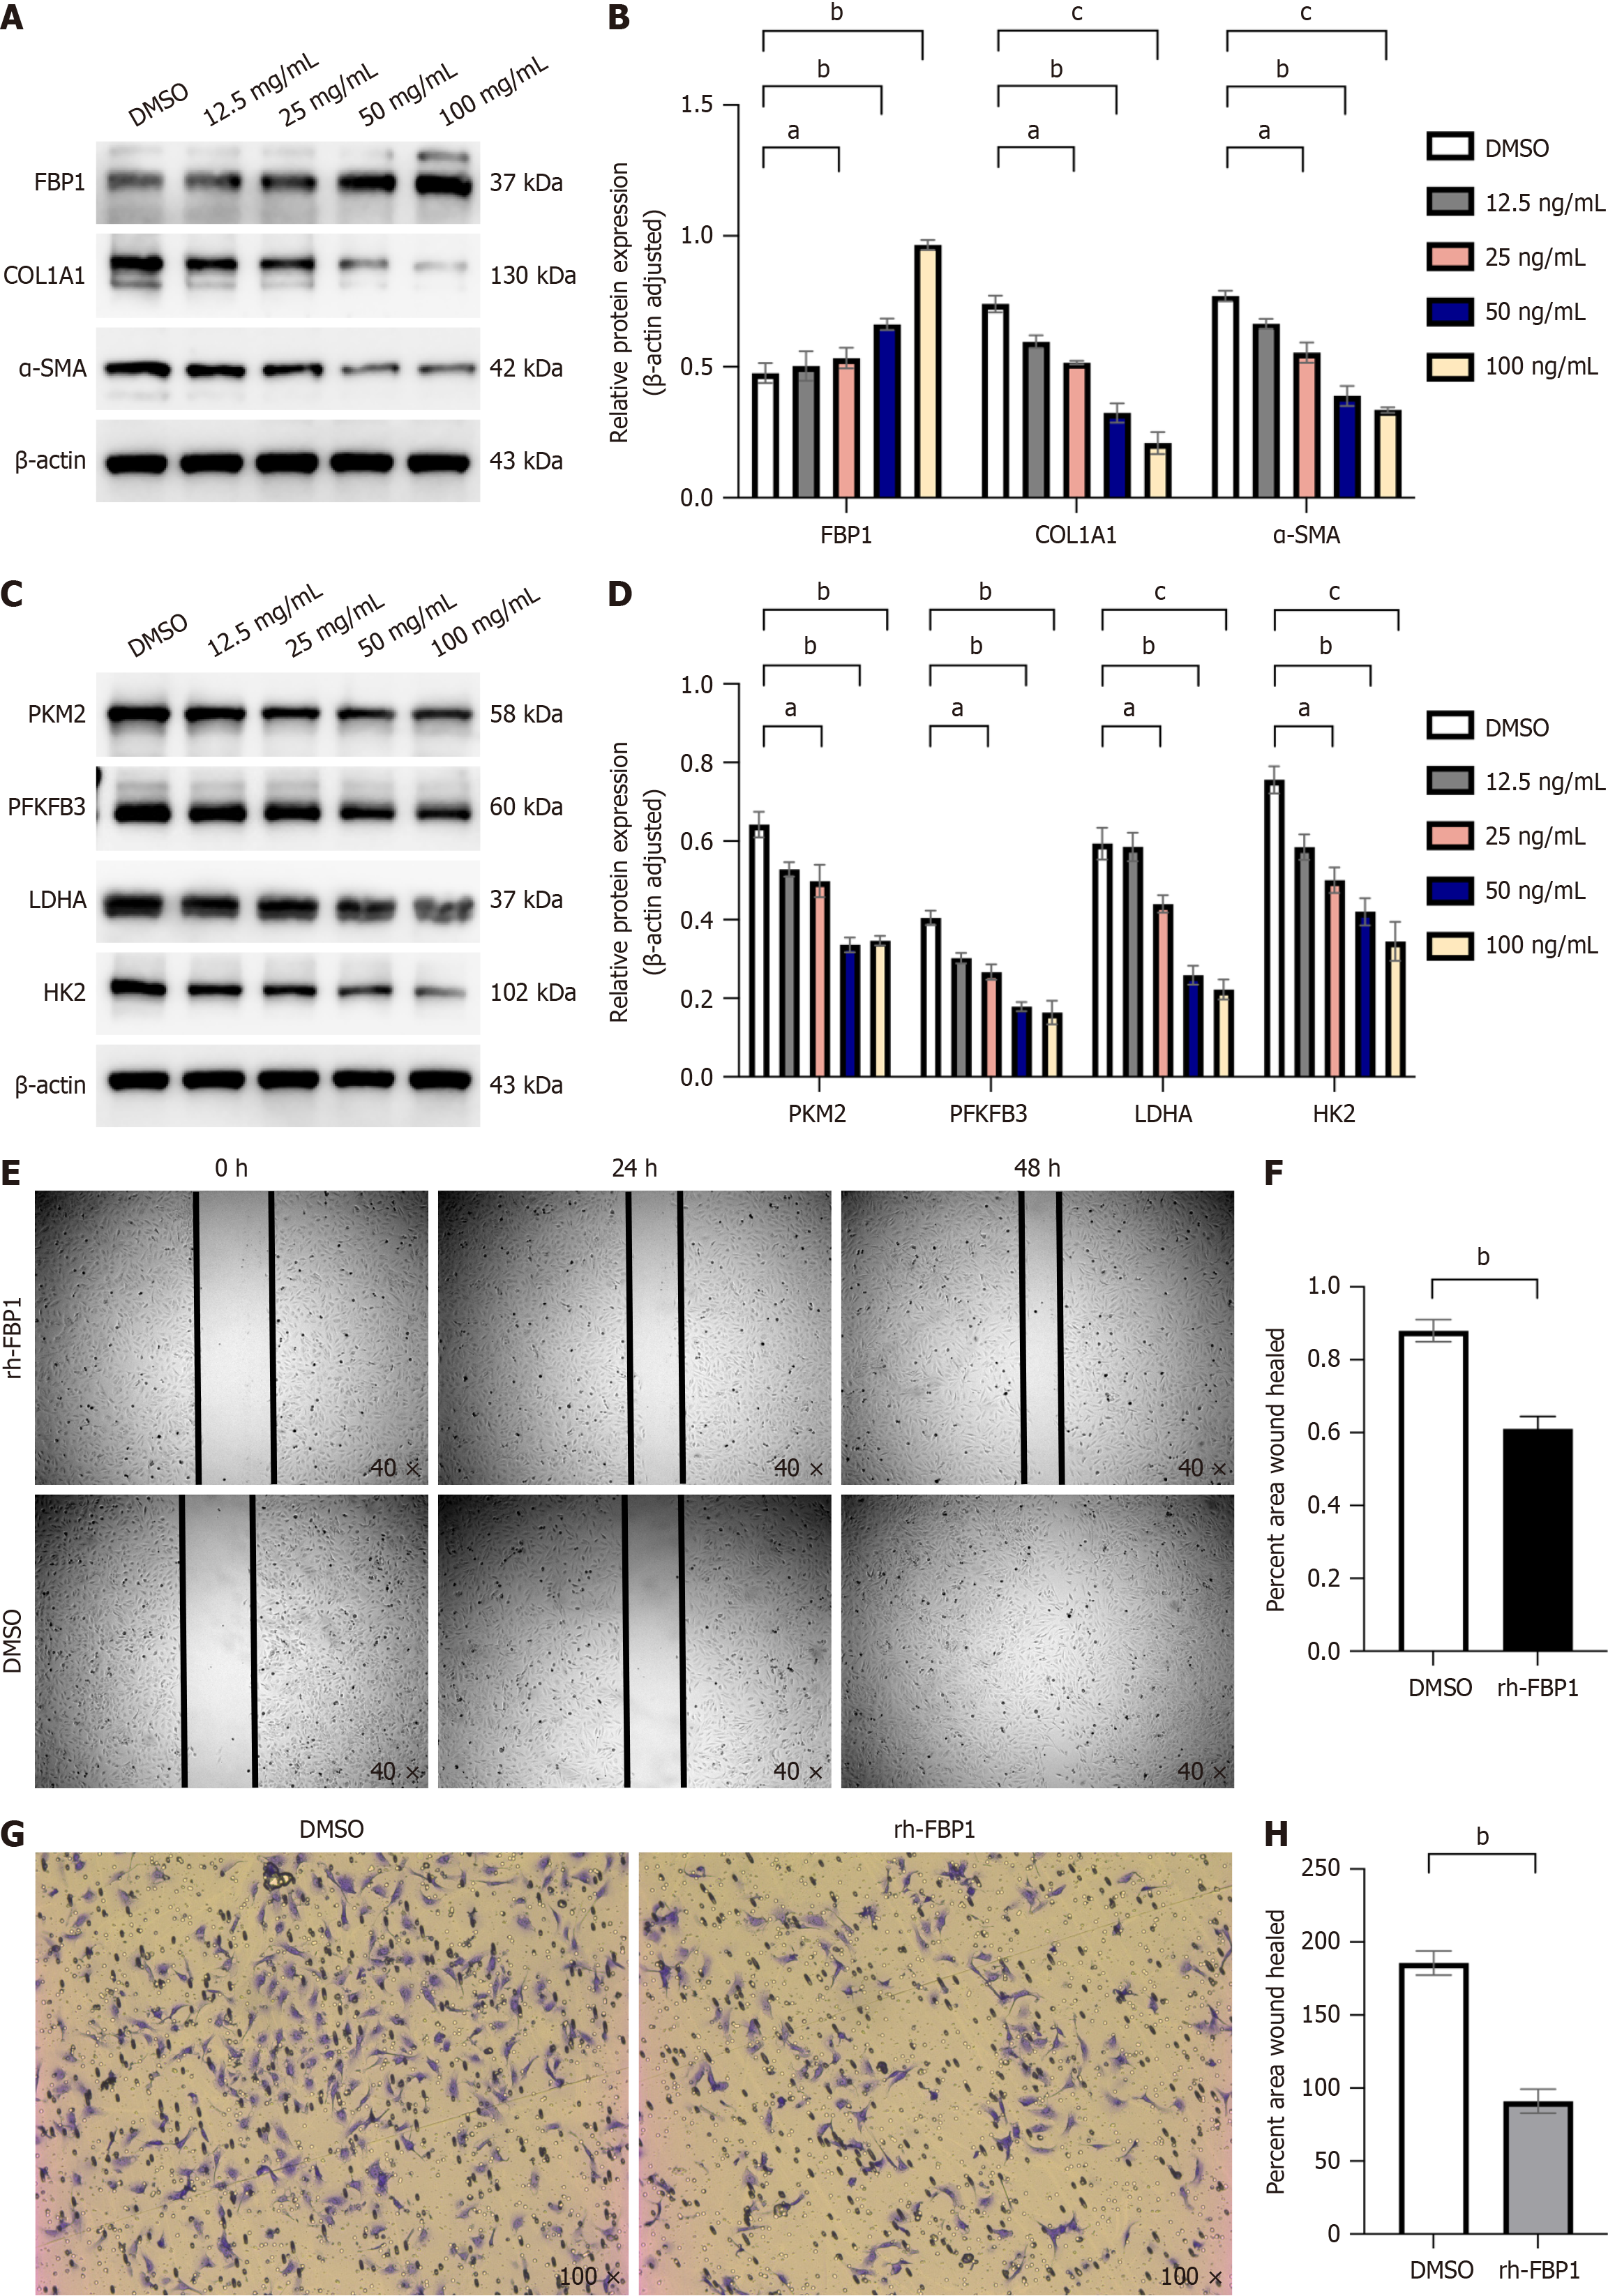
LX-2 cells were plated in 6-well tissue culture plates at a density allowing 90% confluency. Mechanical wounding was then introduced using a sterile 200 μL pipette tip to create a standardized scratch. In the experimental design, vehicle control samples were administered dimethyl sulfoxide, and the treatment group was exposed to recombinant human FBP1 protein at a concentration of 100 ng/mL. Cell cultures were incubated in an optimal growth environment, with wound healing progression quantitatively assessed at predetermined intervals (0 hour, 24 hours, and 48 hours) following scratch induction. The distance between wound edges was quantified using a pre-calibrated optical system with stan
Cell migration assays were conducted utilizing 8.0-µm pore polycarbonate membranes (Corning, Corning, NY, United States) in accordance with standardized protocols. The experimental protocols followed the manufacturer's guidelines. LX-2 cells (1 × 10⁵) were resuspended in serum-free medium and placed in the upper chamber, while complete medium was added to the lower chamber. After incubating for 48 hours at 37 °C with 50 mL/L CO2, cells that migrated to the bottom of the membrane were fixed with 40 g/L paraformaldehyde for 15 minutes, stained with crystal violet for 20 minutes, and then examined under a light microscope.
Statistical analyses was performed with GraphPad Prism version 9.0 software (GraphPad Software, San Diego, CA, United States). Data that followed a normal distribution (Shapiro-Wilk, P > 0.05) were analyzed using the unpaired t-test (for two groups) or analysis of variance with Tukey’s post hoc test (for ≥ 3 groups). Values are presented as the mean ± SD from a minimum of three independent biological replicates. Statistical significance was set at P < 0.05.
Transcriptomic and proteomic sequencing were performed in normal mice, LF model mice, and mice treated with the FAK inhibitor PF562271. PCA of the transcriptomic data revealed distinct gene expression patterns among the normal, CCl₄ and FAK inhibitor groups, with the first principal component (PC1) and PC2 explaining 59% and 8% of the variance, respectively (Figure 1A). Volcano plots identified significantly upregulated and downregulated genes in the CCl₄ group vs the control and in the FAK inhibitor group vs the CCl₄ group, confirming transcriptional alterations induced by CCl₄ and the FAK inhibitor (Figure 1B and C). Gene clustering using Mfuzz identified six clusters with differential expression across groups (Figure 1D). We selected Cluster 2, Cluster 4, and Cluster 5, which exhibited consistent expression trends between the treatment group and the control group, for subsequent analysis. Using Upset analysis, we identified 1321 overlapping genes consistently regulated across the normal vs CCl4, and CCl4vs PF groups, consistent with the clustering pattern (Figure 1E). Venn diagram analysis identified 1321 overlapping genes, with 13 glucose metabolism-related genes exhibiting altered expression (Figure 1F). Similarly, PCA of the proteomic data revealed distinct protein expression pro
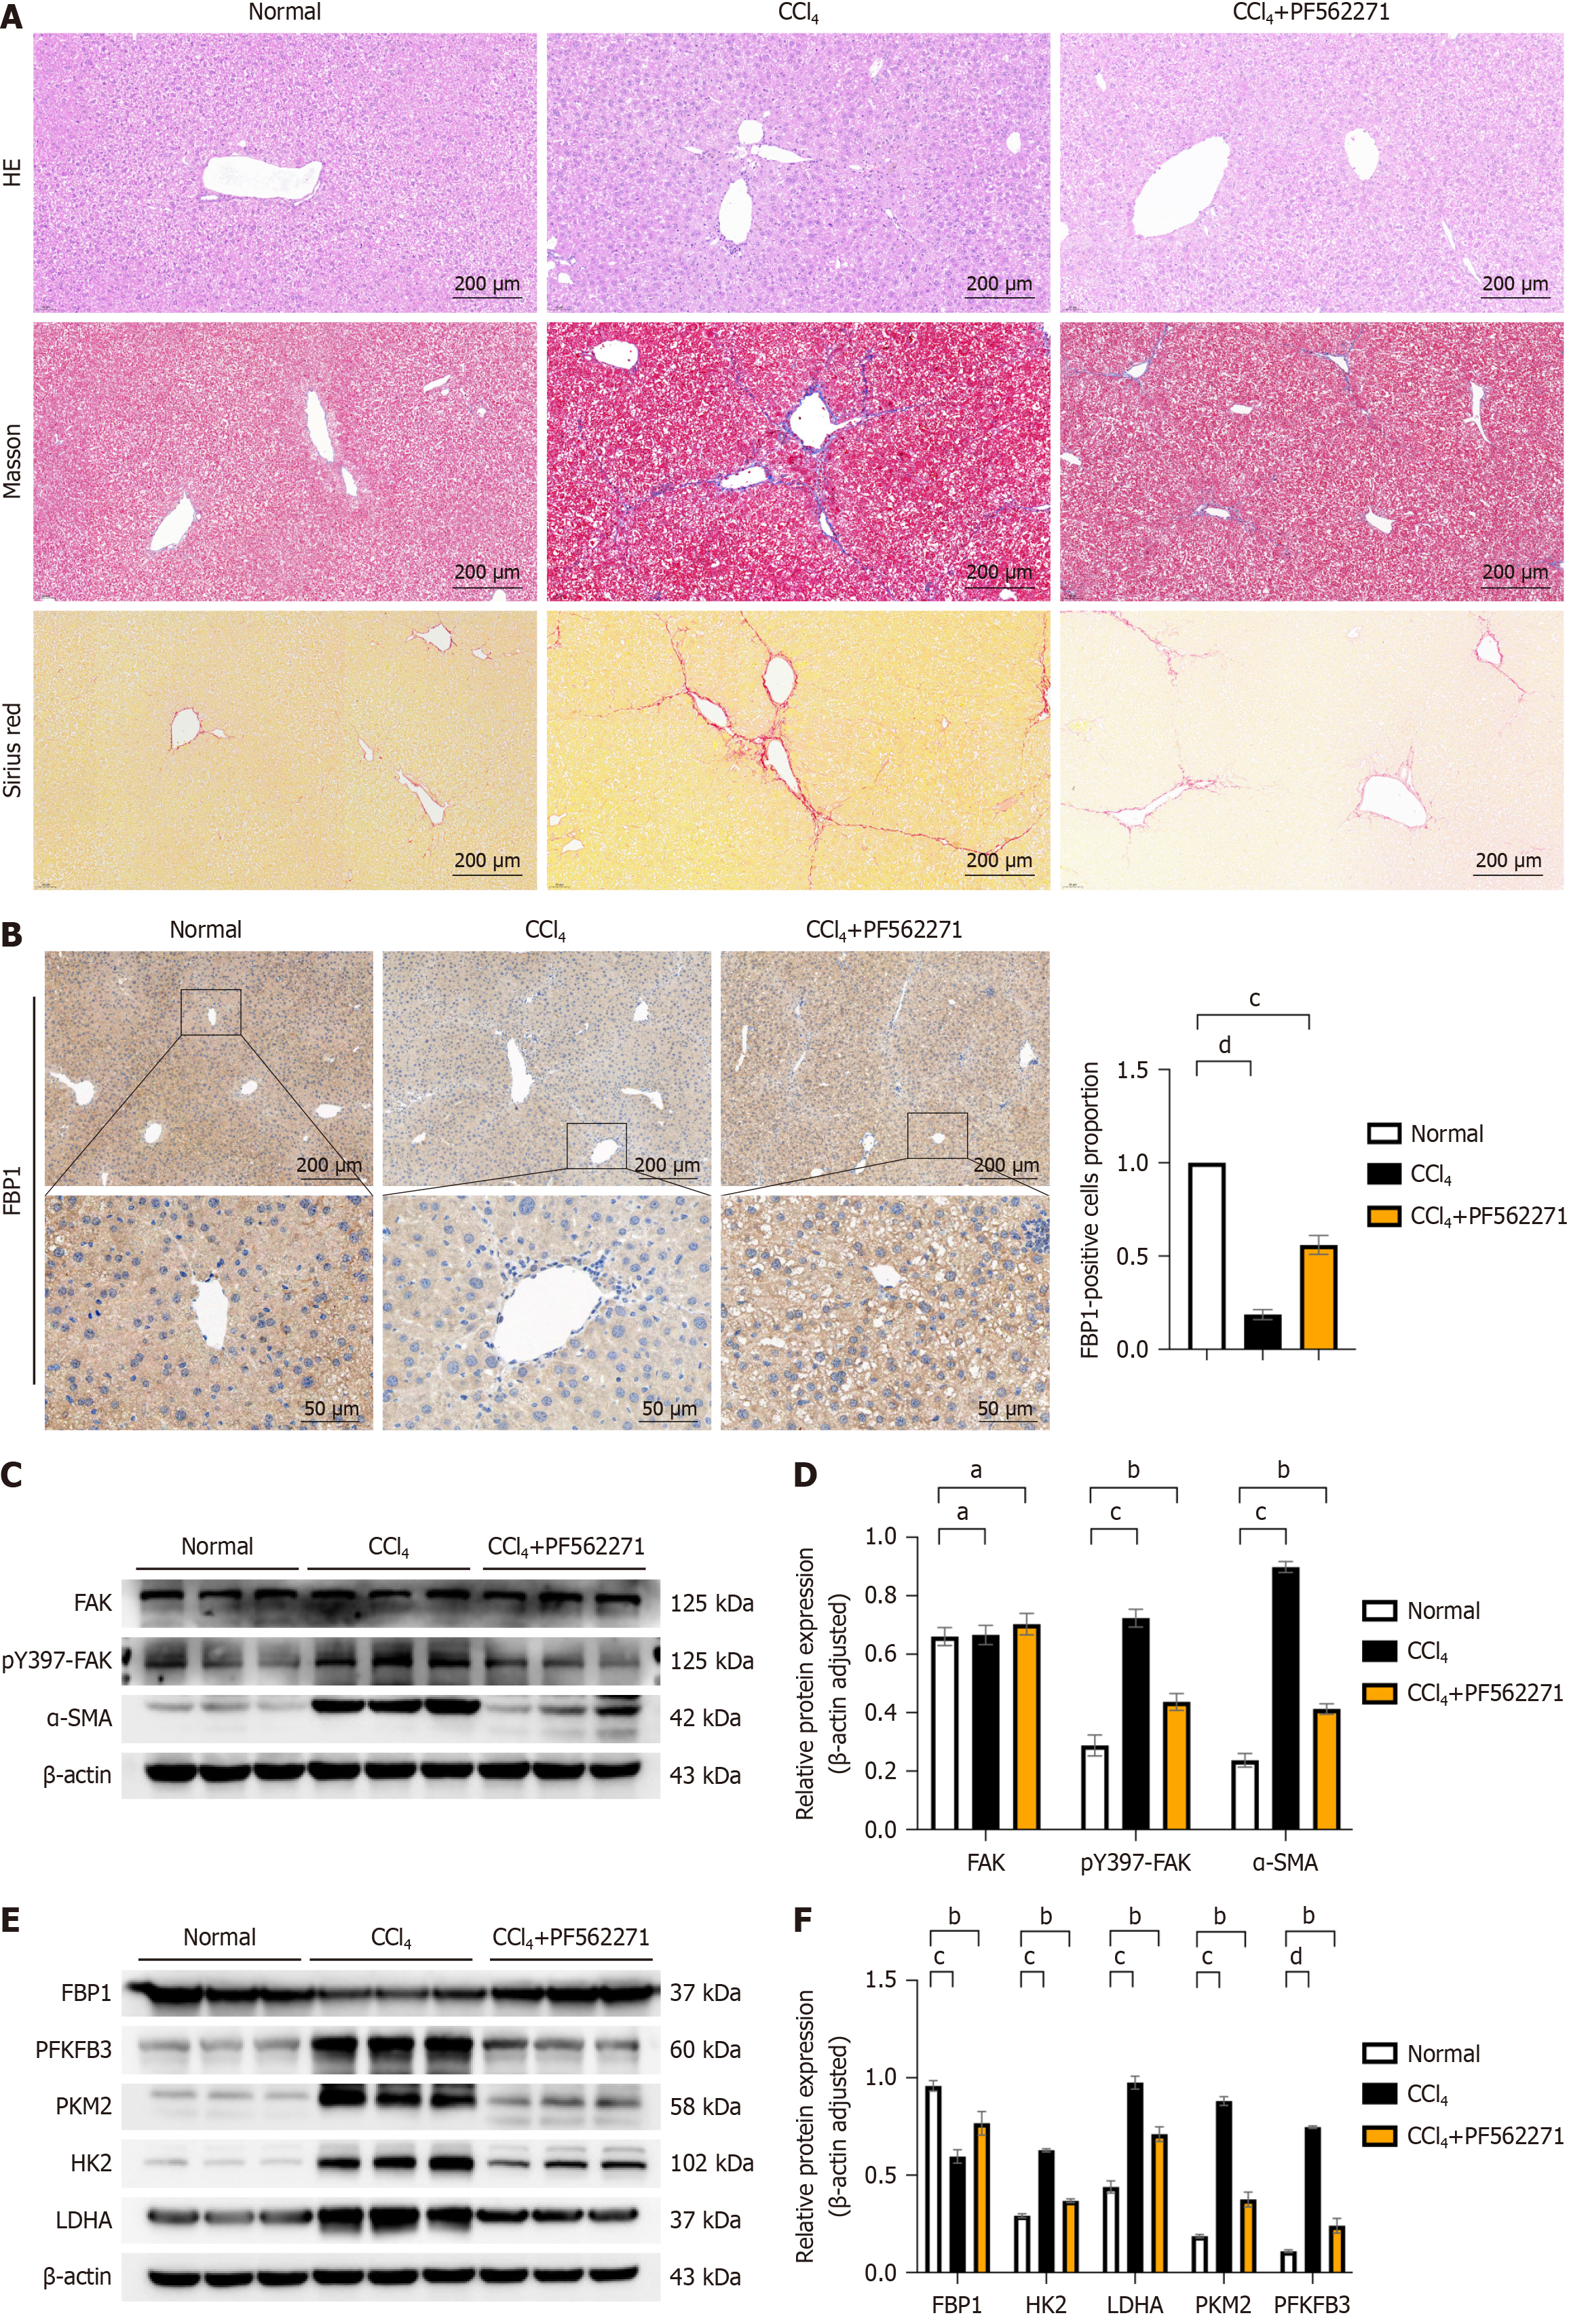
Histological analysis of liver tissues following administration of FAK inhibitor showed reduced inflammatory cell infiltration, preserved hepatic architecture and minimal portal area enlargement compared to the LF model group. Masson and Sirius red staining revealed significantly reduced COL deposition in periportal areas in the FAK inhibitor group (Figure 4A; P < 0.05). IHC analysis demonstrated that FBP1 expression was significantly lower in the LF model group compared to controls but was markedly increased following FAK inhibitor treatment (Figure 4B; P < 0.05). WB analysis further confirmed reduced α-SMA expression in the FAK inhibitor-treated group compared to the fibrosis model group, indicating decreased fibrosis progression (Figure 4C and D; P < 0.05). Additionally, glycolysis markers LDHA, PKM2, PFKFB3, and HK2 were downregulated, while FBP1 protein expression was significantly upregulated in the FAK inhibitor-treated group (Figure 4E and F; P < 0.05).
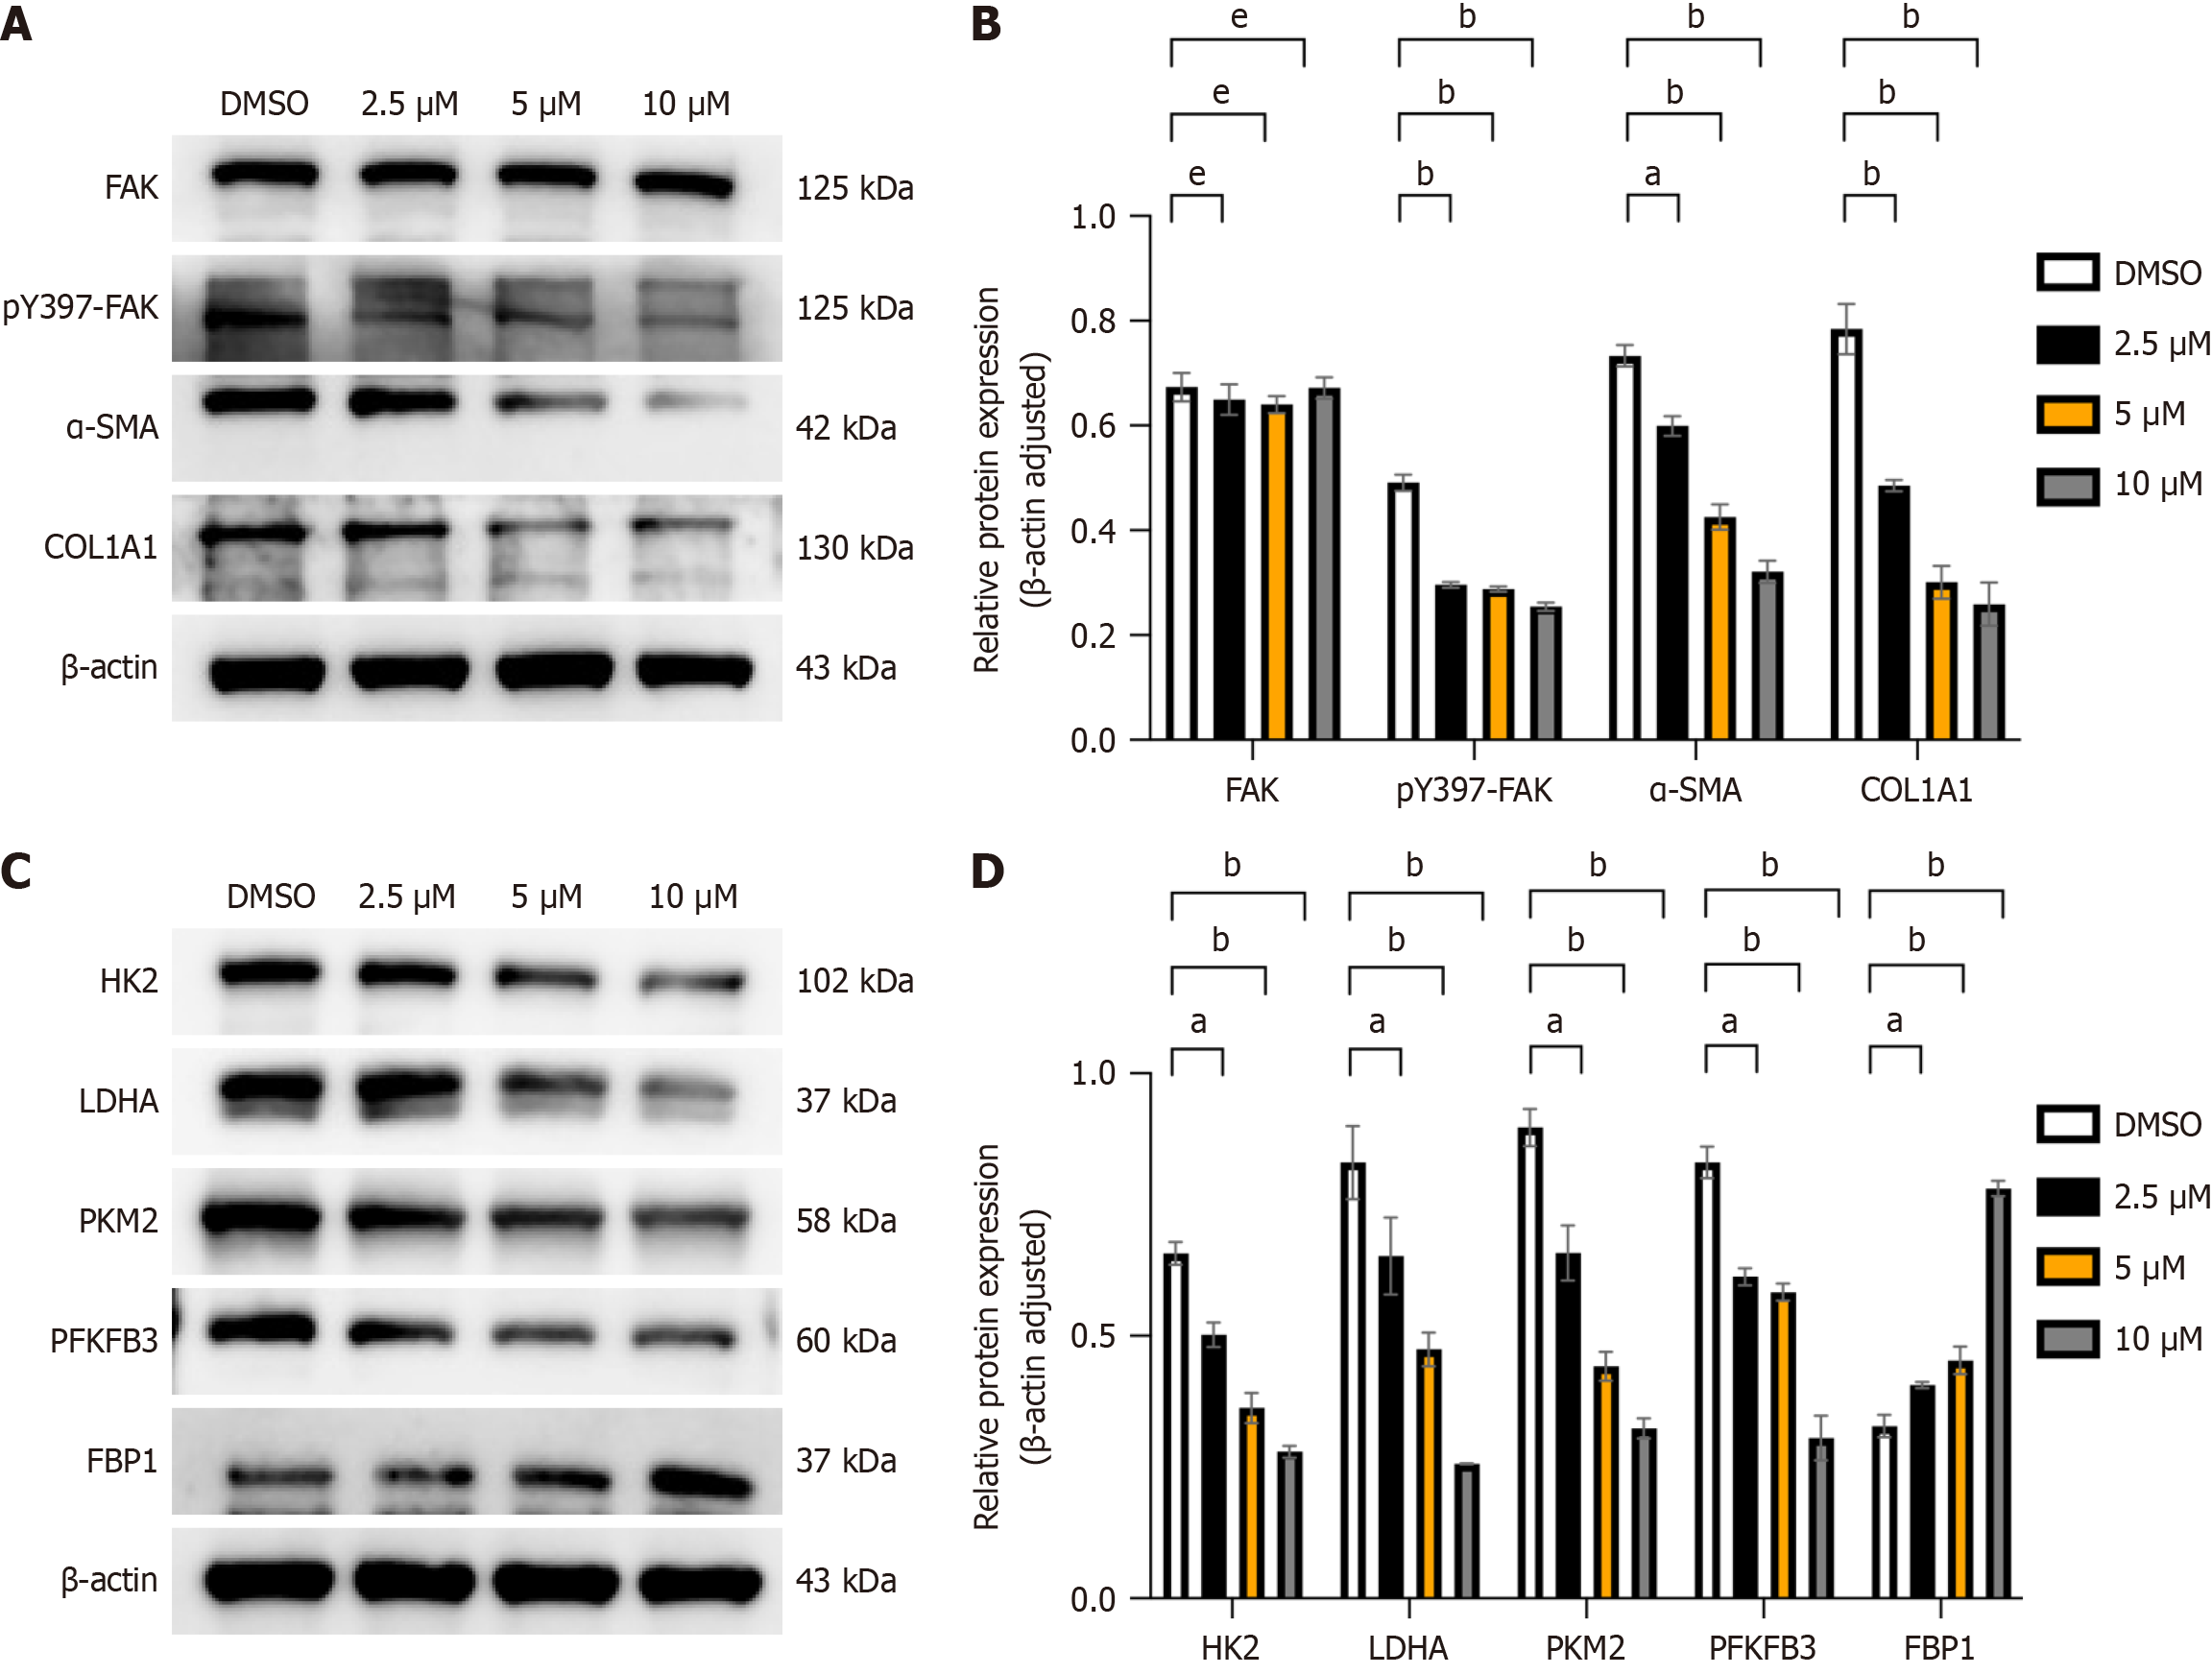
LX-2 cells, an activated human HSCs line[21], were treated with varying concentrations of the FAK inhibitor PF562271 (2.5 μM, 5 μM, 10 μM) based on the IC50 provided by MCE (MedChem Express). In comparison to the control group, administration of the FAK inhibitor markedly decreased the levels of α-SMA and COL1A1, which are biomarkers of hepatic fibrosis (Figure 5A and B; P < 0.05). Additionally, the expression of glycolytic enzymes HK2, PKM2, PFKFB3, and LDHA was downregulated, while FBP1 protein levels were significantly upregulated (Figure 5C and D; P < 0.05).
Our previous findings demonstrated that FAK inhibition alleviates LF and suppresses aerobic glycolysis in vivo, corre
We collected 17 clinical samples, comprising 12 cases of LF and 5 cases of normal liver tissue. Detailed patient informa
HSCs are the primary contributors to extracellular matrix deposition during chronic liver injury[24]. Preventing HSCs activation is a key strategy in the treatment of LF; however, no specific therapeutic agents are currently available, high
Previous studies have indicated that activated HSCs depend on aerobic glycolysis for proliferation and survival, resembling the Warburg effect seen in cancer cells[25]. Our earlier findings indicated that inhibition of FAK suppresses HSC activation and aerobic glycolysis, thereby attenuating LF progression[14,20]. In this study, we conducted transcrip
FBPase is a key enzyme in gluconeogenesis, with two isoforms in humans: FBP1 and FBP2. FBP1 is primarily expressed in the liver and kidneys, while FBP2 is involved in muscle metabolism. FBP1 enzymatically catalyzes the hydrolytic cleavage of F-1,6-BP into F-6-P and an inorganic phosphate moiety through a substrate-specific dephosphorylation reaction[26,27]. Increasing evidence supports the tumor-suppressive role of FBP1 in various cancers, including gastric cancer, renal cancer and hepatocellular carcinoma, where it inhibits tumor cell proliferation and aerobic glycolysis[17,28,29]. Studies have demonstrated that FBP1 deficiency and subsequent hepatic metabolic dysregulation promote hepatocellular carcinoma through the senescence-associated secretory phenotype of HSCs[30]. Importantly, the role of FBP1 in LF and HSC activation has not been thoroughly explored, making it a novel focus of our study. FBP1 is frequently down
FAK and FBP1 inhibit aerobic glycolysis in HSCs, thereby improving LF. FAK and FBP1 may be potential targets in the treatment of LF.
| 1. | Kisseleva T, Brenner D. Molecular and cellular mechanisms of liver fibrosis and its regression. Nat Rev Gastroenterol Hepatol. 2021;18:151-166. [RCA] [PubMed] [DOI] [Full Text] [Cited by in Crossref: 274] [Cited by in RCA: 1365] [Article Influence: 273.0] [Reference Citation Analysis (0)] |
| 2. | Ginès P, Krag A, Abraldes JG, Solà E, Fabrellas N, Kamath PS. Liver cirrhosis. Lancet. 2021;398:1359-1376. [RCA] [PubMed] [DOI] [Full Text] [Cited by in Crossref: 211] [Cited by in RCA: 1041] [Article Influence: 208.2] [Reference Citation Analysis (2)] |
| 3. | Tsuchida T, Friedman SL. Mechanisms of hepatic stellate cell activation. Nat Rev Gastroenterol Hepatol. 2017;14:397-411. [RCA] [PubMed] [DOI] [Full Text] [Cited by in Crossref: 1221] [Cited by in RCA: 2177] [Article Influence: 241.9] [Reference Citation Analysis (0)] |
| 4. | Tapper EB, Parikh ND. Diagnosis and Management of Cirrhosis and Its Complications: A Review. JAMA. 2023;329:1589-1602. [RCA] [PubMed] [DOI] [Full Text] [Cited by in Crossref: 51] [Cited by in RCA: 212] [Article Influence: 70.7] [Reference Citation Analysis (33)] |
| 5. | Ellis EL, Mann DA. Clinical evidence for the regression of liver fibrosis. J Hepatol. 2012;56:1171-1180. [RCA] [PubMed] [DOI] [Full Text] [Cited by in Crossref: 302] [Cited by in RCA: 338] [Article Influence: 24.1] [Reference Citation Analysis (0)] |
| 6. | Higashi T, Friedman SL, Hoshida Y. Hepatic stellate cells as key target in liver fibrosis. Adv Drug Deliv Rev. 2017;121:27-42. [RCA] [PubMed] [DOI] [Full Text] [Cited by in Crossref: 530] [Cited by in RCA: 1139] [Article Influence: 126.6] [Reference Citation Analysis (0)] |
| 7. | Kamm DR, McCommis KS. Hepatic stellate cells in physiology and pathology. J Physiol. 2022;600:1825-1837. [RCA] [PubMed] [DOI] [Full Text] [Cited by in Crossref: 4] [Cited by in RCA: 190] [Article Influence: 47.5] [Reference Citation Analysis (0)] |
| 8. | Mann J, Mann DA. Transcriptional regulation of hepatic stellate cells. Adv Drug Deliv Rev. 2009;61:497-512. [RCA] [PubMed] [DOI] [Full Text] [Cited by in Crossref: 85] [Cited by in RCA: 97] [Article Influence: 5.7] [Reference Citation Analysis (0)] |
| 9. | Khomich O, Ivanov AV, Bartosch B. Metabolic Hallmarks of Hepatic Stellate Cells in Liver Fibrosis. Cells. 2019;9:24. [RCA] [PubMed] [DOI] [Full Text] [Full Text (PDF)] [Cited by in Crossref: 158] [Cited by in RCA: 166] [Article Influence: 23.7] [Reference Citation Analysis (0)] |
| 10. | Lai IR, Chu PY, Lin HS, Liou JY, Jan YJ, Lee JC, Shen TL. Phosphorylation of focal adhesion kinase at Tyr397 in gastric carcinomas and its clinical significance. Am J Pathol. 2010;177:1629-1637. [RCA] [PubMed] [DOI] [Full Text] [Cited by in Crossref: 41] [Cited by in RCA: 51] [Article Influence: 3.2] [Reference Citation Analysis (0)] |
| 11. | Tapial Martínez P, López Navajas P, Lietha D. FAK Structure and Regulation by Membrane Interactions and Force in Focal Adhesions. Biomolecules. 2020;10:179. [RCA] [PubMed] [DOI] [Full Text] [Full Text (PDF)] [Cited by in Crossref: 52] [Cited by in RCA: 150] [Article Influence: 25.0] [Reference Citation Analysis (0)] |
| 12. | Sakurai M, Ohtake J, Ishikawa T, Tanemura K, Hoshino Y, Arima T, Sato E. Distribution and Y397 phosphorylation of focal adhesion kinase on follicular development in the mouse ovary. Cell Tissue Res. 2012;347:457-465. [RCA] [PubMed] [DOI] [Full Text] [Cited by in Crossref: 2] [Cited by in RCA: 7] [Article Influence: 0.5] [Reference Citation Analysis (0)] |
| 13. | Zhang N, Wu X, Zhang W, Sun Y, Yan X, Xu A, Han Q, Yang A, You H, Chen W. Targeting thrombospondin-2 retards liver fibrosis by inhibiting TLR4-FAK/TGF-β signaling. JHEP Rep. 2024;6:101014. [RCA] [PubMed] [DOI] [Full Text] [Full Text (PDF)] [Cited by in RCA: 9] [Reference Citation Analysis (0)] |
| 14. | Huang T, Li YQ, Zhou MY, Hu RH, Zou GL, Li JC, Feng S, Liu YM, Xin CQ, Zhao XK. Focal adhesion kinase-related non-kinase ameliorates liver fibrosis by inhibiting aerobic glycolysis via the FAK/Ras/c-myc/ENO1 pathway. World J Gastroenterol. 2022;28:123-139. [RCA] [PubMed] [DOI] [Full Text] [Full Text (PDF)] [Cited by in CrossRef: 1] [Cited by in RCA: 18] [Article Influence: 4.5] [Reference Citation Analysis (0)] |
| 15. | Chen M, Zhang J, Li N, Qian Z, Zhu M, Li Q, Zheng J, Wang X, Shi G. Promoter hypermethylation mediated downregulation of FBP1 in human hepatocellular carcinoma and colon cancer. PLoS One. 2011;6:e25564. [RCA] [PubMed] [DOI] [Full Text] [Full Text (PDF)] [Cited by in Crossref: 90] [Cited by in RCA: 114] [Article Influence: 7.6] [Reference Citation Analysis (0)] |
| 16. | Dong C, Yuan T, Wu Y, Wang Y, Fan TW, Miriyala S, Lin Y, Yao J, Shi J, Kang T, Lorkiewicz P, St Clair D, Hung MC, Evers BM, Zhou BP. Loss of FBP1 by Snail-mediated repression provides metabolic advantages in basal-like breast cancer. Cancer Cell. 2013;23:316-331. [RCA] [PubMed] [DOI] [Full Text] [Cited by in Crossref: 575] [Cited by in RCA: 661] [Article Influence: 50.8] [Reference Citation Analysis (0)] |
| 17. | Hirata H, Sugimachi K, Komatsu H, Ueda M, Masuda T, Uchi R, Sakimura S, Nambara S, Saito T, Shinden Y, Iguchi T, Eguchi H, Ito S, Terashima K, Sakamoto K, Hirakawa M, Honda H, Mimori K. Decreased Expression of Fructose-1,6-bisphosphatase Associates with Glucose Metabolism and Tumor Progression in Hepatocellular Carcinoma. Cancer Res. 2016;76:3265-3276. [RCA] [PubMed] [DOI] [Full Text] [Cited by in Crossref: 80] [Cited by in RCA: 123] [Article Influence: 12.3] [Reference Citation Analysis (0)] |
| 18. | Yang J, Wang C, Zhao F, Luo X, Qin M, Arunachalam E, Ge Z, Wang N, Deng X, Jin G, Cong W, Qin W. Loss of FBP1 facilitates aggressive features of hepatocellular carcinoma cells through the Warburg effect. Carcinogenesis. 2017;38:134-143. [RCA] [PubMed] [DOI] [Full Text] [Cited by in Crossref: 18] [Cited by in RCA: 32] [Article Influence: 3.6] [Reference Citation Analysis (0)] |
| 19. | Zhang J, Wang J, Xing H, Li Q, Zhao Q, Li J. Down-regulation of FBP1 by ZEB1-mediated repression confers to growth and invasion in lung cancer cells. Mol Cell Biochem. 2016;411:331-340. [RCA] [PubMed] [DOI] [Full Text] [Cited by in Crossref: 43] [Cited by in RCA: 53] [Article Influence: 4.8] [Reference Citation Analysis (0)] |
| 20. | Zhao XK, Yu L, Cheng ML, Che P, Lu YY, Zhang Q, Mu M, Li H, Zhu LL, Zhu JJ, Hu M, Li P, Liang YD, Luo XH, Cheng YJ, Xu ZX, Ding Q. Focal Adhesion Kinase Regulates Hepatic Stellate Cell Activation and Liver Fibrosis. Sci Rep. 2017;7:4032. [RCA] [PubMed] [DOI] [Full Text] [Full Text (PDF)] [Cited by in Crossref: 63] [Cited by in RCA: 104] [Article Influence: 11.6] [Reference Citation Analysis (0)] |
| 21. | Xu L, Hui AY, Albanis E, Arthur MJ, O'Byrne SM, Blaner WS, Mukherjee P, Friedman SL, Eng FJ. Human hepatic stellate cell lines, LX-1 and LX-2: new tools for analysis of hepatic fibrosis. Gut. 2005;54:142-151. [RCA] [PubMed] [DOI] [Full Text] [Cited by in Crossref: 686] [Cited by in RCA: 876] [Article Influence: 41.7] [Reference Citation Analysis (1)] |
| 22. | Trivedi P, Wang S, Friedman SL. The Power of Plasticity-Metabolic Regulation of Hepatic Stellate Cells. Cell Metab. 2021;33:242-257. [RCA] [PubMed] [DOI] [Full Text] [Cited by in Crossref: 87] [Cited by in RCA: 298] [Article Influence: 59.6] [Reference Citation Analysis (0)] |
| 23. | Zhang P, Shao Y, Quan F, Liu L, Yang J. FBP1 enhances the radiosensitivity by suppressing glycolysis via the FBXW7/mTOR axis in nasopharyngeal carcinoma cells. Life Sci. 2021;283:119840. [RCA] [PubMed] [DOI] [Full Text] [Cited by in Crossref: 7] [Cited by in RCA: 25] [Article Influence: 5.0] [Reference Citation Analysis (0)] |
| 24. | Puche JE, Saiman Y, Friedman SL. Hepatic stellate cells and liver fibrosis. Compr Physiol. 2013;3:1473-1492. [RCA] [PubMed] [DOI] [Full Text] [Cited by in Crossref: 421] [Cited by in RCA: 572] [Article Influence: 47.7] [Reference Citation Analysis (0)] |
| 25. | Hou W, Syn WK. Role of Metabolism in Hepatic Stellate Cell Activation and Fibrogenesis. Front Cell Dev Biol. 2018;6:150. [RCA] [PubMed] [DOI] [Full Text] [Full Text (PDF)] [Cited by in Crossref: 42] [Cited by in RCA: 79] [Article Influence: 9.9] [Reference Citation Analysis (0)] |
| 26. | Dzugaj A. Localization and regulation of muscle fructose-1,6-bisphosphatase, the key enzyme of glyconeogenesis. Adv Enzyme Regul. 2006;46:51-71. [RCA] [PubMed] [DOI] [Full Text] [Cited by in Crossref: 26] [Cited by in RCA: 29] [Article Influence: 1.5] [Reference Citation Analysis (0)] |
| 27. | He T, Wang Y, Lv W, Wang Y, Li X, Zhang Q, Shen HM, Hu J. FBP1 inhibits NSCLC stemness by promoting ubiquitination of Notch1 intracellular domain and accelerating degradation. Cell Mol Life Sci. 2024;81:87. [RCA] [PubMed] [DOI] [Full Text] [Cited by in RCA: 12] [Reference Citation Analysis (0)] |
| 28. | Liu X, Wang X, Zhang J, Lam EK, Shin VY, Cheng AS, Yu J, Chan FK, Sung JJ, Jin HC. Warburg effect revisited: an epigenetic link between glycolysis and gastric carcinogenesis. Oncogene. 2010;29:442-450. [RCA] [PubMed] [DOI] [Full Text] [Cited by in Crossref: 122] [Cited by in RCA: 151] [Article Influence: 8.9] [Reference Citation Analysis (0)] |
| 29. | Li B, Qiu B, Lee DS, Walton ZE, Ochocki JD, Mathew LK, Mancuso A, Gade TP, Keith B, Nissim I, Simon MC. Fructose-1,6-bisphosphatase opposes renal carcinoma progression. Nature. 2014;513:251-255. [RCA] [PubMed] [DOI] [Full Text] [Full Text (PDF)] [Cited by in Crossref: 319] [Cited by in RCA: 440] [Article Influence: 36.7] [Reference Citation Analysis (0)] |
| 30. | Li F, Huangyang P, Burrows M, Guo K, Riscal R, Godfrey J, Lee KE, Lin N, Lee P, Blair IA, Keith B, Li B, Simon MC. FBP1 loss disrupts liver metabolism and promotes tumorigenesis through a hepatic stellate cell senescence secretome. Nat Cell Biol. 2020;22:728-739. [RCA] [PubMed] [DOI] [Full Text] [Full Text (PDF)] [Cited by in Crossref: 122] [Cited by in RCA: 159] [Article Influence: 26.5] [Reference Citation Analysis (0)] |


