Published online Oct 14, 2017. doi: 10.3748/wjg.v23.i38.6995
Peer-review started: August 2, 2017
First decision: August 10, 2017
Revised: August 19, 2017
Accepted: September 6, 2017
Article in press: September 5, 2017
Published online: October 14, 2017
Processing time: 76 Days and 3.8 Hours
To investigate the protective mechanism of mitofusin-2 (Mfn2) in rat remote ischemic perconditioning (RIC) models and revalidate it in alpha mouse liver-12 (AML-12) hypoxia cell lines.
Sprague-Dawley rats were divided into three groups (n = 6 each): sham, orthotopic liver transplantation and RIC. After operation, blood samples were collected to test alanine aminotransferase and aspartate aminotransferase. The liver lobes were harvested for histopathological examination, western blotting (WB) and quantitative real-time (qRT)-PCR. AML-12 cell lines were then subjected to normal culture, anoxic incubator tank culture (hypoxia) and anoxic incubator tank culture with Mfn2 knockdown (hypoxia + Si), and data of qRT-PCR, WB, mitochondrial membrane potential (ΔΨm), apoptosis, endoplasmic reticulum Ca2+ concentrations and mitochondrial Ca2+ concentrations were collected.
Both sham and normal culture groups showed no injury during the experiment. The RIC group showed amelioration of liver function compared with the orthotopic liver transplantation group (P < 0.05). qRT-PCR and WB confirmed that Mfn2-mitochondrial Ca2+ uptake 1/2 (MICUs) axis was changed (P < 0.005). In AML-12 cell lines, compared with the hypoxia group, the hypoxia + Si group attenuated the collapse of ΔΨm and apoptosis (P < 0.005). The endoplasmic reticulum Ca2+ decrease and mitochondrial Ca2+ overloading observed in the hypoxia group were also attenuated in the hypoxia + Si group (P < 0.005). Finally, qRT-PCR and WB confirmed the Mfn2-MICUs axis change in all the groups (P < 0.005).
Mfn2 participates in liver injury in rat RIC models and AML-12 hypoxia cell lines by regulating the MICUs pathway.
Core tip: Compared to the orthotopic liver transplantation, the remote ischemic perconditioning (RIC) model can significantly improve liver functions. But, knowledge of its mechanism remains largely unknown. This research is the first to prove the protective mechanism of the mitofusin-2-mitochondrial Ca2+ uptake 1/2 axis by affecting the metabolism of intracellular calcium in the RIC model of liver transplantation and to revalidate it in alpha mouse liver-12 hypoxia cell lines.
- Citation: Liang RP, Jia JJ, Li JH, He N, Zhou YF, Jiang L, Bai T, Xie HY, Zhou L, Sun YL. Mitofusin-2 mediated mitochondrial Ca2+ uptake 1/2 induced liver injury in rat remote ischemic perconditioning liver transplantation and alpha mouse liver-12 hypoxia cell line models. World J Gastroenterol 2017; 23(38): 6995-7008
- URL: https://www.wjgnet.com/1007-9327/full/v23/i38/6995.htm
- DOI: https://dx.doi.org/10.3748/wjg.v23.i38.6995
Liver transplantation (LT) has become an important countermeasure for end-stage liver disease[1]. Ischemia-reperfusion injury (IRI) is one of the severe complications of LT, leading to graft dysfunction and thus increasing the morbidity and mortality[2-4]. Our previous studies confirmed that ischemia preconditioning (IPC) can effectively alleviate IRI by reducing hepatic enzymatic leakage, leukocyte infiltration and apoptosis formation[5,6]. However, because of its traumatic nature and ethical reasons, its application has failed to develop extensively[7]. Remote ischemic perconditioning (RIC) was first proposed by Przyklenk in 1993, and compared with IPC, it is a temporary ischemic treatment for distant organs and plays a protective role without damaging the target organs[8]. We have optimized the application of RIC and proved that the PI3K/Akt/eNOS/NO pathway could reduce the damage[9,10].
Mitofusin-2 (Mfn2), localized in the outer membrane of the mitochondria, maintains the network stability of mitochondria by participating in mitochondrial fusion and fission[11]. Ca2+ is an important intracellular signaling pathway, involved in important pathophysiological functions such as maintenance of biological potential, cell growth/proliferation regulation and apoptosis regulation[12-15]. Vasington et al[16] discovered mitochondrial Ca2+ uptake 1/2 (MICUs) in 1962. They used two Ca2+-binding EF hands to sense Ca2+ concentration, thereby maintaining mitochondrial Ca2+ stability, which were considered as “gatekeepers”for mitochondrial Ca2+ influx[17-20]. Furthermore, they are mediated by the mitochondrial Ca2+ uniporter (MCU) and form an MCU protein complex together with MCU, MICU-1 and MICU-2[21,22]. In our previous work, we also observed that Mfn2 induced apoptosis in HCC cells due to down-regulation of the MICUs gatekeepers[11].
There is little information about relationships between the protective effect of RIC and the Mfn2-MICUs axis during LT. Ca2+ plays an important role in apoptosis. In our previous RIC experiment, compared with the orthotopic liver transplantation (OLT) group, the RIC group showed decreased apoptosis. In the present study, we hypothesized and verified whether RIC model via Mfn2-MICUs axis has a protective effect for LT. As it is hard to perform gene knockout operations using primary cells, genetically engineered rats are expensive and the experiment is time-consuming, we designed the use of alpha mouse liver-12 (AML-12) hypoxia cell lines to simulate the RIC model and to revalidate it to prove our hypothesis.
All experimental protocols were conducted in accordance with the Animal Research: Reporting in vivo Experiments (ARRIVE) guidelines (http://www.nc3rs.org/ARRIVE). Adult male Sprague-Dawley rats weighing 250-300 g were chosen, placed in standard environment, and allowed ad libitum access to food and water. Thirty rats (including 12 donors) were randomly allocated to three groups (n = 6 in each group): sham, OLT and RIC. The following operations were performed: After fasting for 12 h, all rats were anesthetized for 3 h by intraperitoneal injection with 4% chloral hydrate (Shanghai Guchen Biological, China).
In the OLT group, the modified method of Kamada was adopted[23]. Donor liver was obtained, and cold physiological saline containing 25 U/mL heparin was used to perfuse the graft liver through portal vein and stored in 0-4°C cold saline for about 45 min before the graft was transplanted into the recipient. After the suprahepatic inferior vena cava and portal vein were anastomosed by cuff method, the liver was reperfused along with the ligation of the hepatic artery. Then, the infra-hepatic inferior vena cava was connected, and common bile duct was reconstructed by tying the duct over a stent. Physiological saline (1 mL) was injected via the dorsal penile vein of the recipient after operation in order to prevent acid-base imbalance.
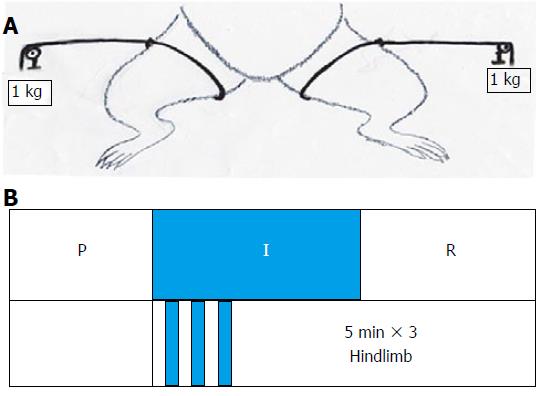
In the RIC group, the method used in our previous study was adopted. In the recipients who underwent OLT, hindlimb ischemia (using a standard tourniquet appending 1 kg weight to both legs) and reperfusion was performed for three 5-min cycles starting at the anhepatic phase[10] (Figure 1). After recovery from anesthesia, the rats allowed free access to sterile water and standard diet.
In the sham group, the abdomen was opened after 70 min, and then closed in order to acquire the mean time of the total ischemia in the OLT/RIC group (2-min warm ischemia, 45-min cold ischemia, and 70-min total ischemia).
Sham group rats were euthanized after anesthesia. After 3 h of blood flow into the recipient’s portal vein, euthanasia was performed in OLT and RIC groups. Blood samples were drawn from the portal vein and then centrifuged for 15 min at 3000 × g, and serum alanine aminotransferase (ALT) and aspartate aminotransferase (AST) were measured to assess liver function (7600 automatic analyzer; Hitachi, Japan). Some of the liver lobes were kept in formalin solution for histopathological examination, and the other parts of the lobes were used for western blotting (WB) and PCR studies.
qRT-PCR was used to detect the level of mRNA expression (Table 1). Total RNA was extracted from the previous phase of the experiment (liver lobes and cell lines) using Trizol reagent (Thermo Fisher Scientific, United States) and PrimeScript RT Reagent Kit with gDNA Eraser (Takara Bio, Japan) for reverse transcription to cDNA. Following the protocol, we performed qRT-PCR in a total volume of 10 μL with 7900Fast (Applied Biosystems Inc, United States) to test the efficiency of small interfering (si)RNA in the hypoxia + Si group. The mRNA levels of Mfn2, MCU, MICU-1 and MICU-2 in the three model groups of sham, OLT and RIC and three cell line groups of normal culture (NC), hypoxia and hypoxia + Si were compared.
| Target gene | Primer sequence |
| Rat-β-Actin | Forward: 5'-ACGGTCAGGTCATCACTATCG-3' |
| Reverse: 5'-GAGGTCTTTACGGATGTCAACG-3' | |
| Rat-Mfn2 | Forward: 5'-GAAGAAGAGTGTCAAGACCGTG-3' |
| Reverse: 5'-CAGGCAAAACTTATCAATCCAG-3' | |
| Rat-Mcu | Forward: 5'-GACCCTGAACGATGTGAAGAC-3' |
| Reverse: 5'-TTCTCCGCTTTCCTGCTAAT-3' | |
| Rat-MICU-1 | Forward: 5'-GACTAAGCGGAGACTGATGTTG-3' |
| Reverse: 5'-GAGATTCTGCGTGAGCCTTC-3' | |
| Rat-MICU-2 | Forward: 5'-ACAAAGCCTCACTCTGGGT-3' |
| Reverse: 5'-TCACTGTTGGTTCCTGGTATT-3' | |
| Mus-β-Actin | Forward: 5'-CATTGCTGACAGGATGCAGAAGG-3' |
| Reverse: 5'-TGCTGGAAGGTGGACAGTGAGG-3' | |
| Mus-Mfn2 | Forward: 5'-CAAGTGTCCGCTCCTGAAG-3' |
| Reverse: 5'-CCACCAGCACAAACACATC-3' | |
| Mus-Mcu | Forward: 5'-GAGCCGCATATTGCAGTACGGT-3' |
| Reverse: 5'-AAACACGCCGACTGAGTCAGAG-3' | |
| Mus-MICU-1 | Forward: 5'-GAAGTGTCCAGCCGTGAAGGAA-3' |
| Reverse: 5'-TGGTGTGGAGTAGGCTCGGATT-3' | |
| Mus-MICU-2 | Forward: 5'-GGAAGACTTTGCTATCGCCATGC-3' |
| Reverse: 5'-GGTGTCCAGAAGATTGTCCGAG-3' |
WB was used to detect the level of protein expression of Mfn2, MCU, MICU-1, MICU-2 and β-actin. Total proteins were extracted from the previous phase of the experiment (liver lobes and cell lines). Cells and tissues (the liver tissues had first been ground in liquid nitrogen) were transfected after incubation in RIPA lysis buffer (Thermo Fisher Scientific) supplemented with protease inhibitor cocktail (Thermo Fisher Scientific) for 1 h on ice and then underwent ultrasonic oscillation crushing (Shanghai Experimental Instruments, China) for three 5-s cycles on ice. After centrifugation (14000 × g, 4 °C, 15 min), the supernatant was collected for protein concentration measurement by Bicinchoninic Acid Protein Assay Kit (Pierce Biotechnology, United States).
The denatured protein samples (30 μg/10 μL) were separated by SDS-PAGE (Invitrogen, United States) and transferred to polyvinylidene fluoride membranes. Then, the membranes were blocked with 5% non-fat milk (BD Biosciences, United States) dissolved in 30 mL Tris-buffered saline with Tween (TBST) for 2 h at room temperature. Using primary antibodies against β-actin/Mfn2 (1:1000; Abcam, United States), MCU/MICU-1 (1:1000; Cell Signaling Technology, United States) and MICU-2 (1:1000; Santa Cruz Biotechnology, United States), the membranes were incubated overnight at 4 °C.
After agitation washing of the membranes for three 5-min cycles with TBST, appropriate secondary horseradish peroxidase-linked antibodies (1:2000; all purchased from Abcam), including goat anti-mouse IgG for total Mfn2, goat anti-rabbit IgG for β-actin and MCU/MICU-1/MICU-2, were used to incubate the membranes for 1 h at room temperature. An ECL kit (Pierce Biotechnology) was used to acquire enhanced chemiluminescence.
The mouse liver hepatocyte cell line AML-12 [established from hepatocytes from a male mouse (CD1 strain, line MT42) non-tumorigenic], preserved by our laboratory, was cultured according to the ATCC guideline, with 10% fetal bovine serum (Gibco, United States) added in a 90% 1:1 mixture of Dulbecco’s modified Eagle’s medium and Ham’s F12 medium (DMEM/F12; Hangzhou Genom Biochemical and Pharmaceutical, China) with 0.005 mg/mL insulin, 0.005 mg/mL transferrin, 5 ng/mL selenium and 40 ng/mL dexamethasone (all purchased from Sigma-Aldrich). All cells were cultured in 5% CO2 at 37 °C in a moderately moist environment.
Cells were assigned to three groups (NC, hypoxia and hypoxia + Si) in the logarithmic phase, and less than 70% had good conditions. The NC group cells were cultured using the normal protocol. The hypoxia group cells were first cultured for 3 h in a humidified atmosphere containing 2% O2, 5% CO2 and 93% N2 at 37 °C in a noxic incubator tank (Thermo Fisher Scientific), and then cultured for another 3 h in normal atmosphere as NC group cells to simulate the IRI process. The hypoxia + Si cells were first used in siRNA experiments (Table 2; Shanghai GenePharma Biochemical and Pharmaceutical, China) to knock down the Mfn2 expression. The same culturing was performed in the hypoxia group. Cells were collected for subsequent experiments.
| Target gene | Primer sequence |
| Mus-Mfn2 | Sense strand: |
| 5′-CUGCGAAUUAAGCAGAUUATTdTdT-3′; | |
| Anti-sense strand: | |
| 5′-UAAUCUGCUUAAUUCGCAGTTdTdT-3′ |
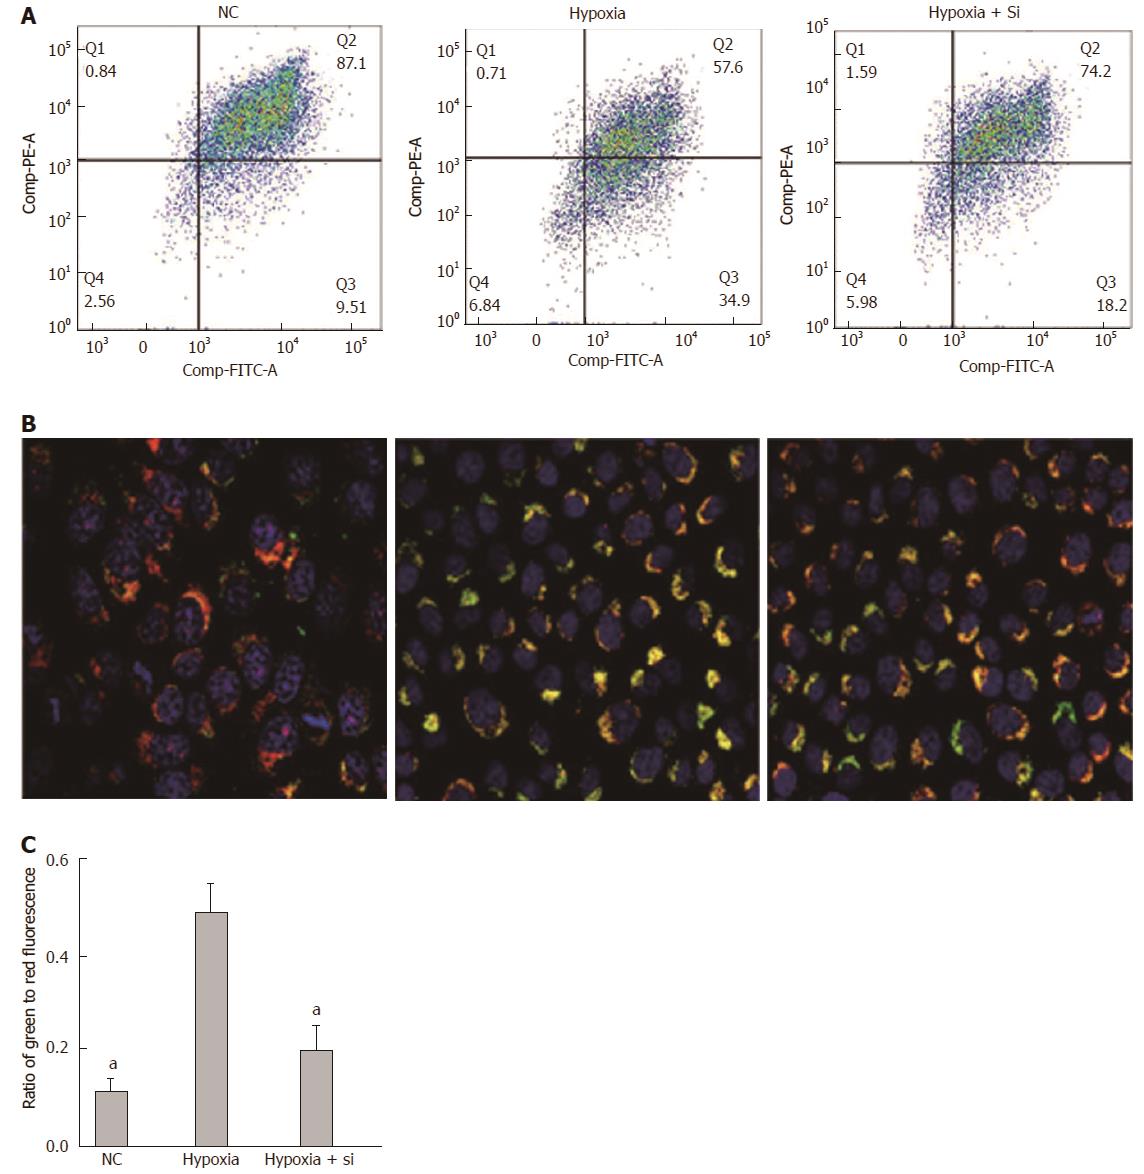
The mitochondrial membrane potential (ΔΨm) was quantified using a JC-1 kit (Beijing Beyotime Institute of Biotechnology, China). JC-1 was used to cultivate the cells for 30 min, which was measured by flow cytometry (FCM) in the channels of FITC (green) and PE-A (red) of the FC500 flow cytometer (Cytomics, United States). Furthermore, cells were cultured for 30 min using JC-1 and for 15 min using Hoechst-33342 (Beijing Beyotime Institute of Biotechnology), and observed under confocal microscopy (FV1000; Olympus, Japan) to confirm the results obtained from FCM.
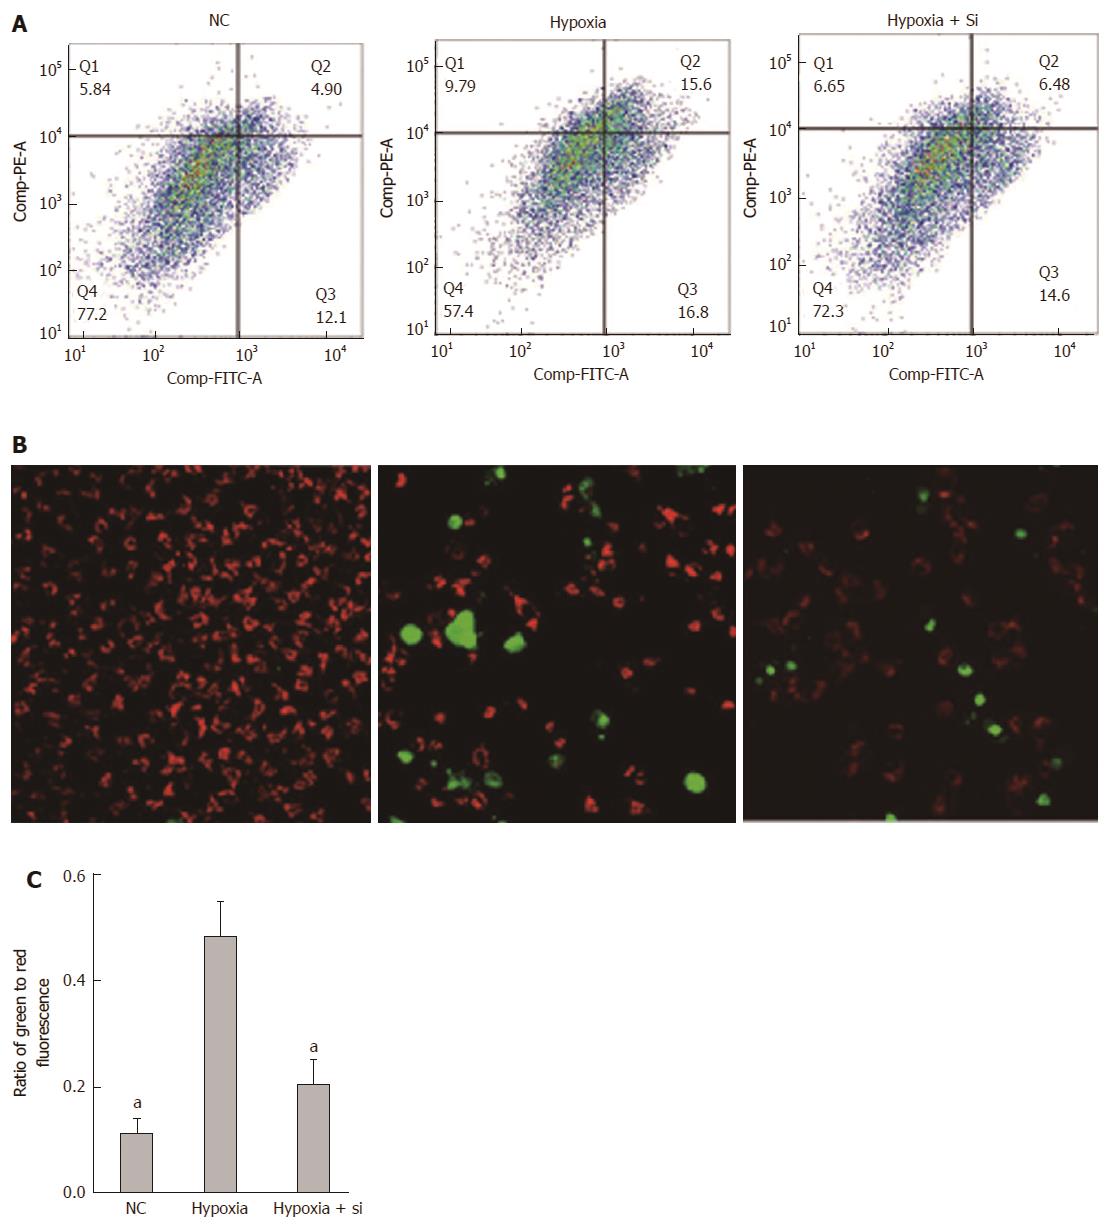
Cell apoptosis was assayed using the Annexin V/Propidium Iodide Apoptosis (AV/PI) Detection Kit (BD Biosciences) and measured by FCM. Furthermore, cells were treated with 7.5 μmol/L of the CellEvent Caspase 3/7 Green Detection Reagent (Invitrogen, United States) and 10 nmol/L tetramethylrhodamine methyl ester perchlorate (Invitrogen), and observed under confocal microscopy to confirm the results obtained from FCM.
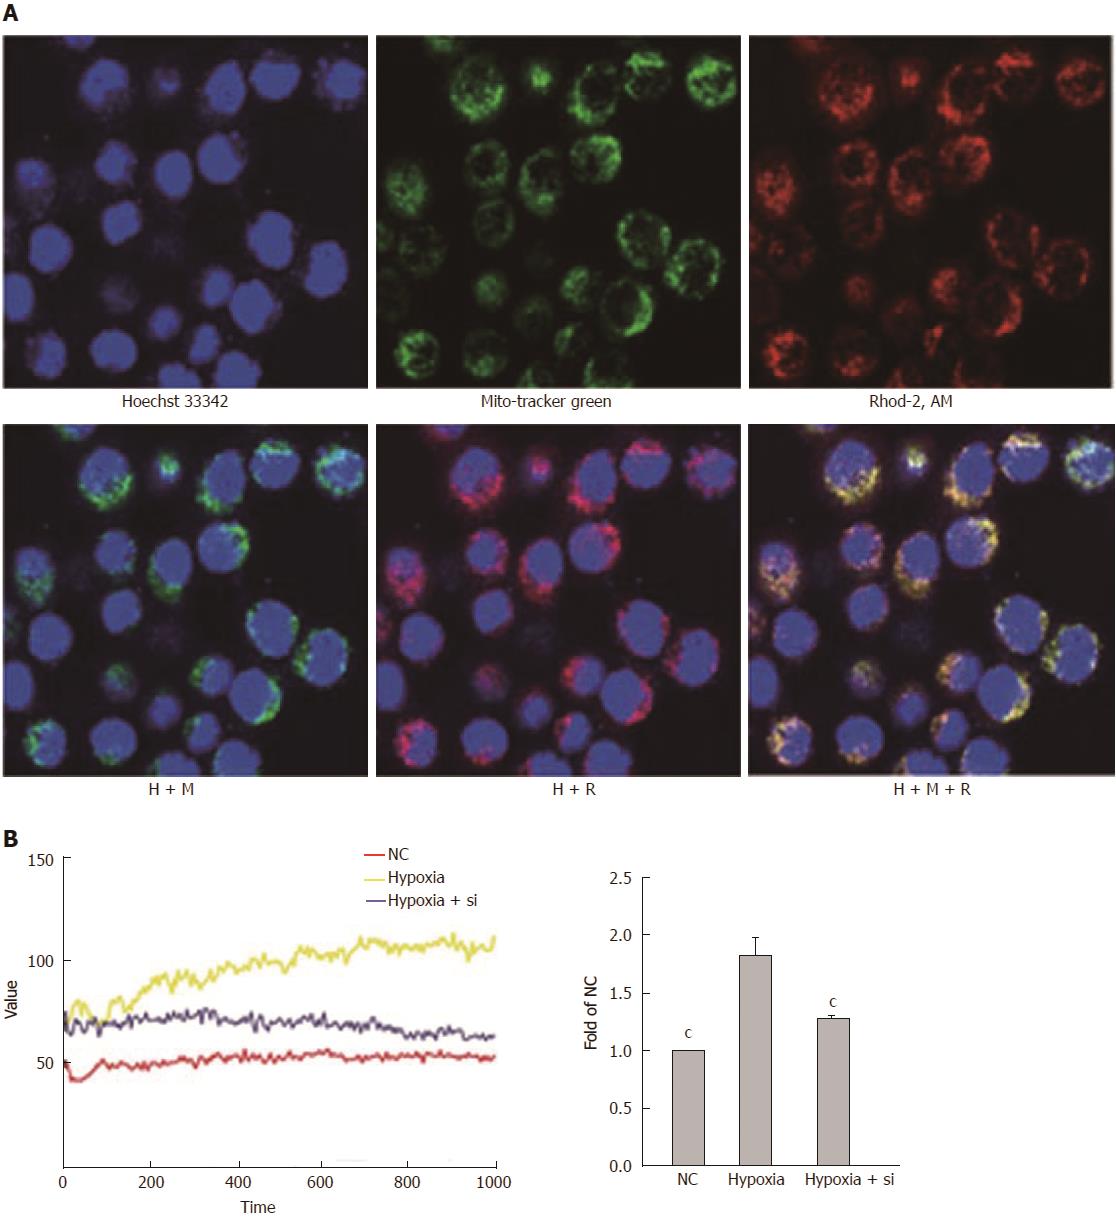
Rhod-2 acetoxymethyl ester (Rhod-2, AM; GeneCopoeia, United States) was used to measure the mitochondrial Ca2+ concentrations. According to our previous experience, the fluorescence value of Rhod-2 AM approximately represented the fluorescence value of mitochondrial Ca2+[11,24]. The day before the experiment, 1 x 10⁵ cells were plated in 10-mm confocal dishes (Nest Biotechnology, China). After overnight incubation, the growth medium was removed from the cell plates, and added with 500 μL medium with 4 μM Rhod-2 AM and 0.1% Pluronic® F-127 (GeneCopoeia) and allowed to incubate at 37 °C in humidified air (containing 5% CO2) for 2 h. Next, D-Hanks balanced salt solution (Hangzhou Genom Biochemical and Pharmaceutical, China) was used to wash the cells three times, followed by addition of 500 μL Hoechst-33342 and 200 nmol/L MitoTracker Green (Beijing Beyotime Institute of Biotechnology), and allowed to incubate in the same environment for 30 min of cultivation. Confocal microscopy confirmed that the vast majority of Rhod-2 AM fluorescence was associated with the mitochondria. Furthermore, cells were incubated in 96-well plates with Rhod-2 AM and F-127 in the same process and observed by VarioskanFlash (Thermo Fisher Scientific) with the illumination at excitation 552 nm and emission 581 nm to confirm the results obtained from confocal microscopy.
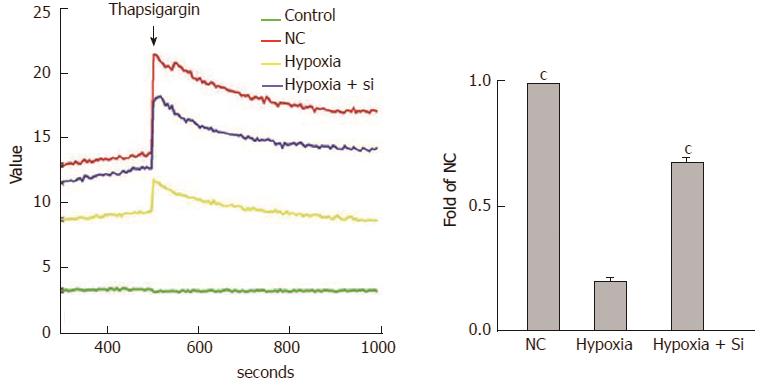
We used the FLUOFORTE® Calcium Assay (Enzo Life Sciences, United States) to detect ER Ca2+ concentrations. The day before the experiment, 5 × 10⁴ cells were plated per well in 96-well assay plates (Corning, United States). After overnight incubation, the growth medium was removed from the cell plates and 100 μL FLUOFORTE® Dye-Loading Solution (prepared by Enzo’s protocol, containing 0.5 mmol/L EGTA to eliminate Ca2+ concentrations in the medium) was added to each well, and the cells were incubated at room temperature for 45 min. The illumination at excitation 490 nm and emission 525 nm was observed by VarioskanFlash for quantification of cytosolic Ca2+ concentrations at baseline. Then, 5 μM thapsigargin (Thermo Fisher Scientific) was added to each measurement well to detect the total values, including cytosolic baseline and Ca2+ released from the ER, by VarioskanFlash with the same parameters. SkanIt software (Thermo Fisher Scientific) was used to measure the ER Ca2+ concentrations.
The results were expressed as mean ± SEM. One-way analysis of variance was used for comparisons among three groups and the t-test was used for comparison between the two groups. All statistical analyses and related statistical diagramming were performed using the GraphPad Prism software (ver. 5.0 for Windows; GraphPad Software Inc., United States). P < 0.05 was considered statistically significant.
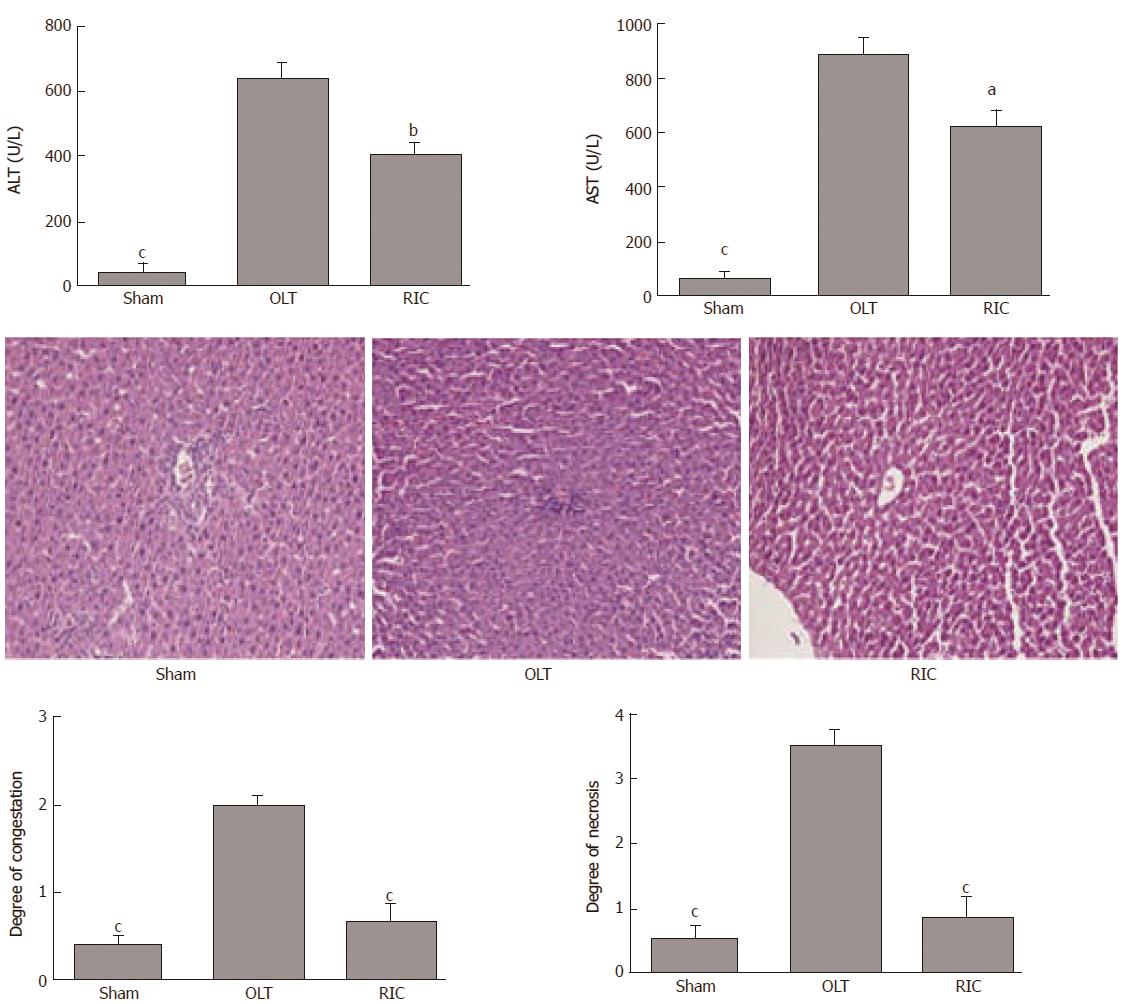
According to the literature and our previous research, RIC does not cause muscle and remote organ function damage, so this experiment focused on liver function[9,10]. In the present study, the sham group showed no injury during the experiment. Compared with the OLT group, ALT and AST levels were lower in the RIC group (ALT: P = 0.0029, AST: P = 0.0121; Figure 2A). Liver histopathological examinations showed that the RIC group had fewer sinusoids, central vein congestion and hepatocyte necrosis than the OLT group (P < 0.001; Figure 2B and C).
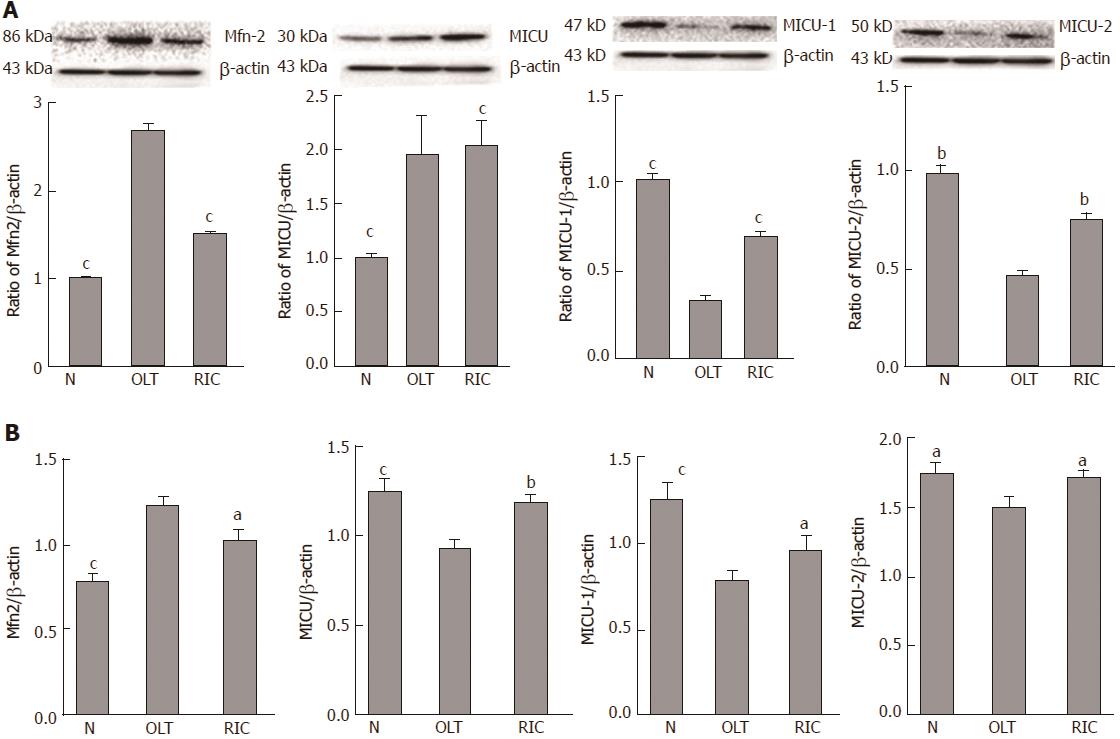
Expression of Mfn2 and MICUs was measured by WB (Figure 3A) and qRT-PCR (Figure 3B). Taking the OLT group as the reference, both the sham and RIC groups showed lower expression of Mfn2 (WB: sham vs RIC: P < 0.001; qRT-PCR: sham P < 0.001, RIC P = 0.0348). The MICUs expression was also altered. Compared with the OLT group, both the sham and RIC groups showed higher expression of MICU-1 (WB: sham vs RIC, P < 0.001; qRT-PCR: sham P = 0.0005, RIC P = 0.0030) and similar expression of MICU-2 (WB: sham P = 0.0011, RIC P = 0.0033; qRT-PCR: sham P = 0.0255, RIC: P = 0.0137). However, we did not observe any significant changes in the expression of MCU (WB: sham P = 0.1044, RIC P = 0.9243; qRT-PCR: sham P = 0.0005, RIC P = 0.1507).
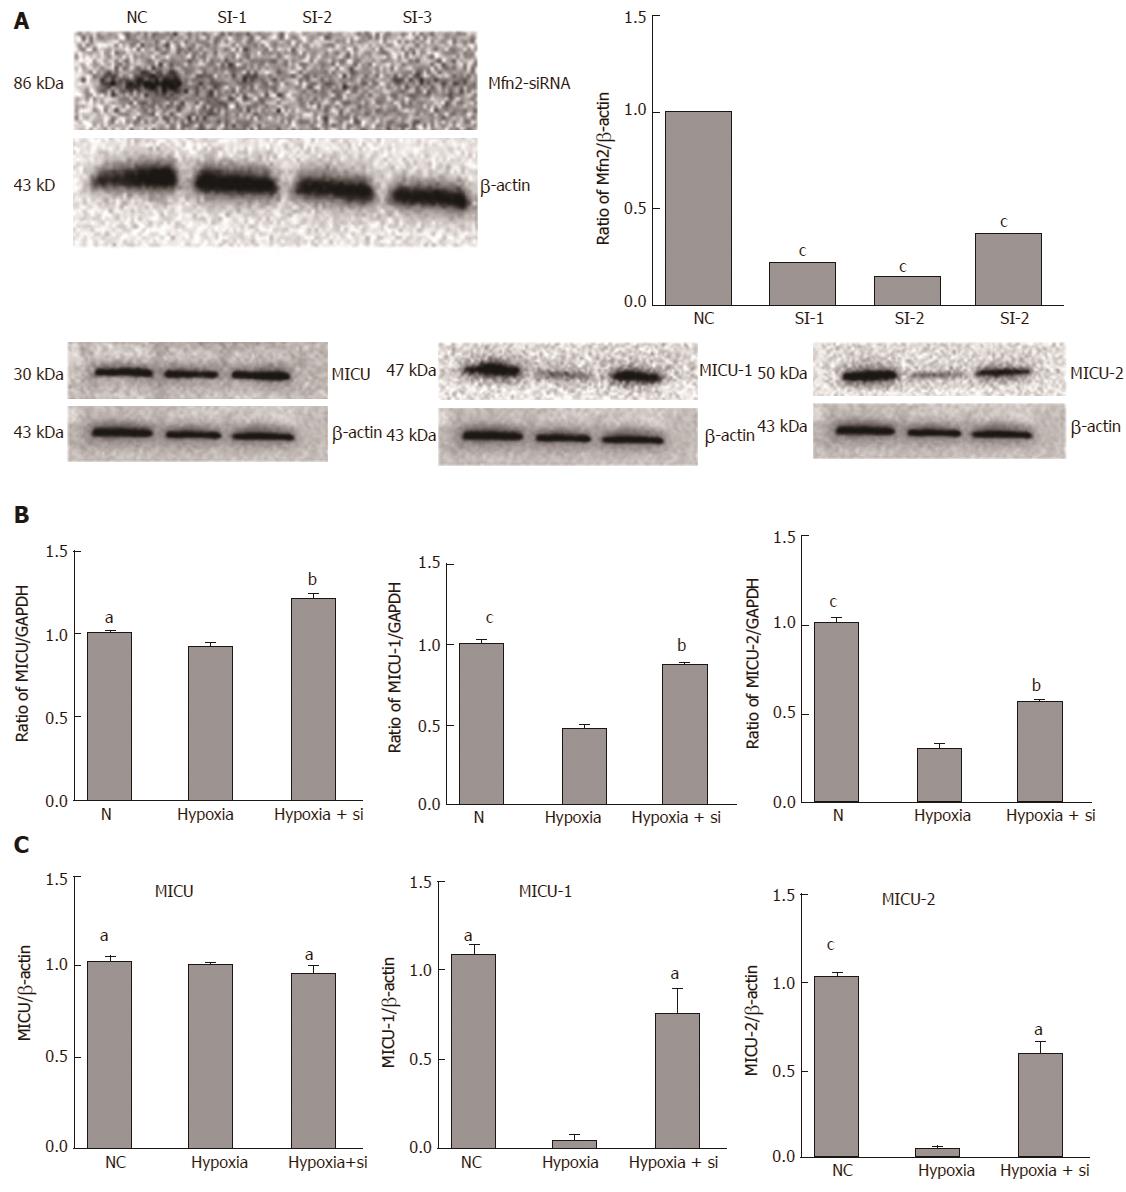
The NC group was cultured in normal environment. The hypoxia group followed our protocol to simulate the IRI process. In the hypoxia + Si group, siRNA was used to knock down Mfn2 expression (WB and qRT-PCR; Figure 4A) and culturing was performed by the same protocol as in the hypoxia group. Expression of MICUs was measured by WB and qRT-PCR. Taking the hypoxia group as the reference, both the NC and hypoxia + Si groups showed higher expression of MICU-1 (WB: NC P = 0.0001, hypoxia + Si P = 0.0010; qRT-PCR: NC P = 0.0026, hypoxia + Si P = 0.0430) and similar expression of MICU-2 (WB: sham P < 0.0001, hypoxia + Si P = 0.0020; qRT-PCR: sham P = 0.0004, RIC P = 0.0137). We observed the change in expression of MCU by WB (sham: P = 0.0158, RIC: P = 0.0040), but did not obtain significant findings by qRT-PCR (sham: P = 0.2597, RIC: P = 0.2420) (Figure 4B and C).
We first used the JC-1 kit to measure the ΔΨm in AML-12 hypoxia cell lines cultured by FCM with our protocol. JC-1 fluorescence shifted from red (JC-1 aggregates bound to mitochondria) to green (JC-1 monomers bound to cytoplasm), indicating a decline of ΔΨm. Taking the hypoxia group as the reference, the green to red fluorescence ratio was lower in the NC and hypoxia + Si groups (FCM: NC P = 0.0329, hypoxia + Si P = 0.0391; Figure 5A and C). We obtained the same result by confocal microscopy as that obtained from FCM using the JC-1 kit and Hoechst-33342 (Figure 5B).
The Annexin V/Propidium Iodide Apoptosis Detection Kit was used to detect cell apoptosis by FCM. Annexin V fluorescence reflects early cell apoptosis while propidium iodide fluorescence reflects late apoptosis and dying cells. Taking the hypoxia group as the reference, the ratio of apoptosis cells was lower in the NC and hypoxia + Si groups (FCM: NC P = 0.0092, hypoxia + Si P = 0.0369; Figure 6A and C). We obtained the same result by confocal microscopy as that obtained from FCM using the caspase 3/7 detection kit (green) and tetramethylrhodamine methyl ester perchlorate (red) (Figure 6B).
We used Rhod-2 AM to detect mitochondrial Ca2+ concentrations by confocal microscopy and VarioskanFlash. Rhod-2 AM, Hoechst-33342 and MitoTracker Green were used to confirm that the fluorescence value of Rhod-2 AM approximately represented the fluorescence value of mitochondrial Ca2+ (Figure 7A). Then, VarioskanFlash was used to analyze the illumination at excitation 557 nm and emission 581 nm and detect mitochondrial Ca2+ concentrations (Figure 7B). Taking the hypoxia group as the reference, both the NC and hypoxia + Si groups relieved mitochondrial Ca2+ overloading (NC vs hypoxia + Si: P < 0.0001).
We used the FLUOFORTE® Calcium Assay to detect ER Ca2+ concentrations by analyzing the illumination at excitation 490 nm and emission 525 nm with VarioskanFlash. The cytosolic baseline was measured first, and then thapsigargin (Ca2+ was released by inhibiting endoplasmic reticular Ca-ATPase) was added to detect the total values, including cytosolic baseline and Ca2+ release from the ER. SkanIt software was used to measure the ER Ca2+ concentrations. Taking the hypoxia group as the reference, both the NC and hypoxia + Si groups showed higher ER Ca2+ concentrations (NC vs hypoxia + Si: P < 0.0001) (Figure 7).
The incidence of liver cancer is increasing and liver cancer currently represents the sixth most frequent type of cancer worldwide[25]. LT has become an important countermeasure for end-stage liver diseases, and numerous research studies have been carried out to improve LT outcome by reducing the damages, such as IPC and RIC[26,27]. We have demonstrated in our previous studies that the RIC model protects the liver against IRI, causing no muscle or remote organ function damage[9,10], but the mechanism is not yet fully understood.
Mitochondrial Ca2+ plays an important role in intracellular homeostasis[28]. Mfn2 maintains the network stability of mitochondria by participating in mitochondrial fusion and fission[29]. MCU, MICU-1 and MICU-2 form the mitochondrial calcium uniporter complex. Along with the increase in intracellular Ca2+, Ca2+ combined with EF-hand of MICUs promotes the opening of MCU pores and leads to an increase in the mitochondrial Ca2+[30,31]. Furthermore, excessive intake of Ca2+ can increase mitochondrial permeability transition, thereby inducing pathophysiological phenomena such as apoptosis[32]. Previous studies have shown that Mfn2 provides a convenient pathway for Ca2+ transport from mitochondria to ER in intracellular high Ca2+ environment[33-37]. However, there is little information about relationships between the protective effect of RIC and the Mfn2-MICUs axis during LT.
We, therefore, designed and performed the present RIC experiment (Figure 1) and found that, compared with the sham group, LT (including RIC) could cause liver damage and change the Mfn2-MICUs axis at the same time. While the RIC model reduced liver damage, Mfn2 expression was lower and MICUs expression was higher than in LT (Figures 2 and 3). These results demonstrated that the RIC model might exert its protective effect for LT via the Mfn2-MICUs axis.
To further verify our findings, we decided to knock down the Mfn2 expression by siRNA. Since genetically engineered mice are expensive, the experiment is time-consuming, and it is hard to perform gene knockout operations using primary cells, we designed the use of AML-12 hypoxia cell lines to simulate a RIC model. After determining the Mfn2 knockdown efficiency (Figure 4A), we proved that the hypoxia + Si group alleviated the hypoxia damage and showed higher expression of MICU-1 and MICU-2 compared with the hypoxia group (Figure 4B and C). Revalidating the same result from the RIC experiment provides the basis for our future mechanism studies.
Depolarization of mitochondrial membrane potential is usually associated with early apoptosis. According to the JC-1 kit instructions, in the absence of apoptotic cells, JC-1 aggregates are bound to mitochondria and red fluorescence occurs at 590 nm. Whereas in apoptotic cells, JC-1 monomers are bound to cytoplasm and green fluorescence occurs at 530 nm. The green to red fluorescence ratio then indicates the collapse of ΔΨm. In the present study, we used the JC-1 kit to measure the ΔΨm in hypoxia cell lines by FCM, and found that the green to red fluorescence ratio was lower in the NC and hypoxia + Si groups (Figure 5A and C). The sham group showed no injury during the experiment. Compared with the hypoxia group, the hypoxia + Si group had less collapse of ΔΨm. For more intuitive observation, we used JC-1 and Hoechst-33342 to repeat the experiment by confocal microscopy, and revalidated the same result from FCM (Figure 5B). The results illustrated that Mfn2 knockdown lowered the mitochondrial membrane potential in hypoxia cells.
Apoptosis is a programmed cell death controlled by genes, which is designed to maintain homeostasis[38]. In the early stage of apoptosis, phosphotidylserine can be translocated from the inside of the cell membrane to the outside of the cell membrane and combined with annexin V (FITC). In late apoptotic and dead cells, the membranes are permeable to propidium iodide (PE-A). According to the staining status of the cells, we can distinguish the apoptosis status (annexin V/propidium iodide positive or negative). In the present study, we found that the ratio of cell apoptosis was lower in the NC and hypoxia + Si groups (Figure 6A and C). The sham group showed no injury during the experiment, indicating that compared with the hypoxia group, the hypoxia + Si group had fewer cells undergoing apoptosis. We used the caspase 3/7 detection reagent (green) and tetramethylrhodamine methyl ester perchlorate (red) to repeat the experiment by confocal microscopy and revalidate the same result from FCM (Figure 6B). The results demonstrated that Mfn2 knockdown reduced the apoptosis in hypoxia cells.
As mentioned earlier, whether IRI in LT or hypoxia in cells leads to injury should be verified. Mfn2 provides a convenient pathway for Ca2+ transport from mitochondria to ER in intracellular high Ca2+ environment. Excessive uptake of Ca2+ caused mitochondrial pathogenesis and affected ‘gatekeeper’ expression, thus leading to a higher Ca2+ concentration. In the present study, after confirming that the Mfn2-MICUs were altered in both rat models and cell models, we continued to validate Ca2+ changes at the mitochondrial level. We used Rhod-2 AM to analyze the mitochondrial Ca2+ concentration (Figure 7A), and VarioskanFlash to analyze the illumination of Rhod-2 AM to get the fluorescence of mitochondrial Ca2+ concentrations. We found that the hypoxia + Si group relieved mitochondrial Ca2+ overloading compared with the hypoxia group (Figure 7B). This indicated that Mfn2 knockdown reduced the mitochondrial Ca2+ overload by Mfn2-MICUs axis in cell models.
The ER is an important organelle of Ca2+ storage, the stored Ca2+ in ER is mainly released through the inositol 1, 4, 5-trisphosphate (InsP3) receptor and ryanodine receptor pathways[13]. In the present study, we investigated the relationships between ER Ca2+ concentrations and mitochondrial Ca2+ overloading. After the cytosolic Ca2+ concentration at baseline was quantified by VarioskanFlash using the FLUOFORTE® Calcium Assay, we added thapsigargin to release the ER Ca2+ and performed repeat measurement. The hypoxia + Si group showed relief of the ER Ca2+ decrease compared with the hypoxia group (Figure 8). This result proved that Mfn2 knockdown relieved the ER Ca2+ decrease by affecting the Mfn2-MICUs axis, thus altering the mitochondrial Ca2+ status in cell models.
The MCU protein complex is a highly selective calcium channel consisting of three components: MCU, MICU-1 and MICU-2. The complex can sense Ca2+ level and determine whether it passes through the mitochondrial membrane[19]. In our experiment, we failed to observe the consistency of MCU expression changes in rat and cell models. According to the literature, ER was mediated by the InsP3 receptor, Mfn2 showed no effect on expression of InsP3R, but when specific inhibitors of InsP3 receptor were used, the decline of ER Ca2+ induced by Mfn2 no longer occurred, suggesting that InsP3R Ca2+ release pathways affected the ER Ca2+ efflux[11]. The specific mechanism in InsP3R and IRI/cell hypoxia injury is not clear. Nevertheless, our research provides a clear clue that Mfn2 down-regulated expression of MICUs can affect the state of Ca2+ in organelles, thus playing a protective role in the two models. We will continue to apply gene-editing mouse models and specific inhibitors to conduct an in-depth research in the future.
In conclusion, we used an RIC model and confirmed that IRI was prevented by altered organelles’ Ca2+ status via the Mfn2-MICUs axis, and revalidated the effect in AML-12 hypoxia cell models.
Remote ischemic perconditioning (RIC) alleviates the damage of ischemia-reperfusion injury (IRI). The Mfn2-MICUs axis is involved in the regulation of intracellular calcium, thereby affecting the process of apoptosis. But there is little information about the role of the mitofusin-2-mitochondrial Ca2+ uptake 1/2 (Mfn2-MICUs) axis in the protective effect of RIC during liver transplantation (LT).
Most previous studies only confirmed the protective effect of RIC, but few showed the detailed mechanism. In the protective role of RIC, the mechanism of apoptosis related to the Mfn2-MICUs axis is worthy of being explored.
This research is the first to prove the protective mechanism of the Mfn2-MICUs axis as affecting the metabolism of intracellular calcium to reduce apoptosis in RIC of LT and revalidate it in AML-12 hypoxia cell lines.
This study showed the relationship between the protective effect of RIC and cell hypoxia injury, and that the Mfn2-MICUs axis and apoptosis are affected by the intracellular calcium homeostasis, thus laying a basic foundation for future studies.
RIC was first proposed by Przyklenk in 1993, and it alleviates the damage of IRI in a temporary ischemic treatment for distant organs without damaging the target organs. RIC operations include remote-ischemic-preconditioning (RIPreC), remote-ischemic-postconditioning and RIPerC.
This is an interesting paper looking at the role of Mnf2 in liver IRI.
We are grateful to the Collaborative Innovation Center for Diagnosis and Treatment of Infectious Diseases of the First Affiliated Hospital of Zhejiang University for providing the experimental sites and reagents for this study. We also wish to thank Wen-Feng Song for technical assistance.
Manuscript source: Unsolicited manuscript
Specialty type: Gastroenterology and hepatology
Country of origin: China
Peer-review report classification
Grade A (Excellent): 0
Grade B (Very good): B
Grade C (Good): C
Grade D (Fair): D
Grade E (Poor): 0
P- Reviewer: Gunay Y, Hori T, Tsoulfas G S- Editor: Wei LJ
L- Editor: Filipodia E- Editor: Ma YJ
| 1. | Eshraghian A, Imanieh MH, Dehghani SM, Nikeghbalian S, Shamsaeefar A, Barshans F, Kazemi K, Geramizadeh B, Malek-Hosseini SA. Post-transplant lymphoproliferative disorder after liver transplantation: Incidence, long-term survival and impact of serum tacrolimus level. World J Gastroenterol. 2017;23:1224-1232. [RCA] [PubMed] [DOI] [Full Text] [Full Text (PDF)] [Cited by in CrossRef: 26] [Cited by in RCA: 31] [Article Influence: 3.4] [Reference Citation Analysis (0)] |
| 2. | Eggenhofer E, Sabet-Rashedi M, Lantow M, Renner P, Rovira J, Koehl GE, Schlitt HJ, Geissler EK, Kroemer A. RORγt(+) IL-22-producing NKp46(+) cells protect from hepatic ischemia reperfusion injury in mice. J Hepatol. 2016;64:128-134. [RCA] [PubMed] [DOI] [Full Text] [Cited by in Crossref: 16] [Cited by in RCA: 22] [Article Influence: 2.2] [Reference Citation Analysis (0)] |
| 3. | Peralta C, Jiménez-Castro MB, Gracia-Sancho J. Hepatic ischemia and reperfusion injury: effects on the liver sinusoidal milieu. J Hepatol. 2013;59:1094-1106. [RCA] [PubMed] [DOI] [Full Text] [Cited by in Crossref: 475] [Cited by in RCA: 501] [Article Influence: 38.5] [Reference Citation Analysis (9)] |
| 4. | Zhai Y, Petrowsky H, Hong JC, Busuttil RW, Kupiec-Weglinski JW. Ischaemia-reperfusion injury in liver transplantation--from bench to bedside. Nat Rev Gastroenterol Hepatol. 2013;10:79-89. [RCA] [PubMed] [DOI] [Full Text] [Cited by in Crossref: 468] [Cited by in RCA: 705] [Article Influence: 54.2] [Reference Citation Analysis (0)] |
| 5. | Jin LM, Liu YX, Zhou L, Xie HY, Feng XW, Li H, Zheng SS. Ischemic preconditioning attenuates morphological and biochemical changes in hepatic ischemia/reperfusion in rats. Pathobiology. 2010;77:136-146. [RCA] [PubMed] [DOI] [Full Text] [Cited by in Crossref: 19] [Cited by in RCA: 20] [Article Influence: 1.3] [Reference Citation Analysis (0)] |
| 6. | Yan S, Jin LM, Liu YX, Zhou L, Xie HY, Zheng SS. Outcomes and mechanisms of ischemic preconditioning in liver transplantation. Hepatobiliary Pancreat Dis Int. 2010;9:346-354. [PubMed] |
| 7. | Kanoria S, Jalan R, Davies NA, Seifalian AM, Williams R, Davidson BR. Remote ischaemic preconditioning of the hind limb reduces experimental liver warm ischaemia-reperfusion injury. Br J Surg. 2006;93:762-768. [RCA] [PubMed] [DOI] [Full Text] [Cited by in Crossref: 81] [Cited by in RCA: 83] [Article Influence: 4.2] [Reference Citation Analysis (0)] |
| 8. | Heusch G, Bøtker HE, Przyklenk K, Redington A, Yellon D. Remote ischemic conditioning. J Am Coll Cardiol. 2015;65:177-195. [RCA] [PubMed] [DOI] [Full Text] [Cited by in Crossref: 483] [Cited by in RCA: 518] [Article Influence: 47.1] [Reference Citation Analysis (0)] |
| 9. | Jia J, Li J, Jiang L, Zhang J, Chen S, Wang L, Zhou Y, Xie H, Zhou L, Zheng S. Protective effect of remote limb ischemic perconditioning on the liver grafts of rats with a novel model. PLoS One. 2015;10:e0121972. [RCA] [PubMed] [DOI] [Full Text] [Full Text (PDF)] [Cited by in Crossref: 15] [Cited by in RCA: 16] [Article Influence: 1.5] [Reference Citation Analysis (0)] |
| 10. | He N, Jia JJ, Li JH, Zhou YF, Lin BY, Peng YF, Chen JJ, Chen TC, Tong RL, Jiang L. Remote ischemic perconditioning prevents liver transplantation-induced ischemia/reperfusion injury in rats: Role of ROS/RNS and eNOS. World J Gastroenterol. 2017;23:830-841. [RCA] [PubMed] [DOI] [Full Text] [Full Text (PDF)] [Cited by in CrossRef: 24] [Cited by in RCA: 30] [Article Influence: 3.3] [Reference Citation Analysis (0)] |
| 11. | Wang W, Xie Q, Zhou X, Yao J, Zhu X, Huang P, Zhang L, Wei J, Xie H, Zhou L. Mitofusin-2 triggers mitochondria Ca2+ influx from the endoplasmic reticulum to induce apoptosis in hepatocellular carcinoma cells. Cancer Lett. 2015;358:47-58. [RCA] [PubMed] [DOI] [Full Text] [Cited by in Crossref: 82] [Cited by in RCA: 105] [Article Influence: 8.8] [Reference Citation Analysis (0)] |
| 12. | Jouaville LS, Pinton P, Bastianutto C, Rutter GA, Rizzuto R. Regulation of mitochondrial ATP synthesis by calcium: evidence for a long-term metabolic priming. Proc Natl Acad Sci USA. 1999;96:13807-13812. [RCA] [PubMed] [DOI] [Full Text] [Cited by in Crossref: 584] [Cited by in RCA: 647] [Article Influence: 24.0] [Reference Citation Analysis (0)] |
| 13. | Berridge MJ, Bootman MD, Roderick HL. Calcium signalling: dynamics, homeostasis and remodelling. Nat Rev Mol Cell Biol. 2003;4:517-529. [RCA] [PubMed] [DOI] [Full Text] [Cited by in Crossref: 3972] [Cited by in RCA: 4150] [Article Influence: 180.4] [Reference Citation Analysis (0)] |
| 14. | Berridge MJ, Lipp P, Bootman MD. The versatility and universality of calcium signalling. Nat Rev Mol Cell Biol. 2000;1:11-21. [RCA] [PubMed] [DOI] [Full Text] [Cited by in Crossref: 4077] [Cited by in RCA: 4261] [Article Influence: 163.9] [Reference Citation Analysis (0)] |
| 15. | Carafoli E, Santella L, Branca D, Brini M. Generation, control, and processing of cellular calcium signals. Crit Rev Biochem Mol Biol. 2001;36:107-260. [RCA] [PubMed] [DOI] [Full Text] [Cited by in Crossref: 383] [Cited by in RCA: 374] [Article Influence: 15.0] [Reference Citation Analysis (0)] |
| 16. | Vasington FD, Murphy JV. Ca ion uptake by rat kidney mitochondria and its dependence on respiration and phosphorylation. J Biol Chem. 1962;237:2670-2677. [PubMed] |
| 17. | Baughman JM, Perocchi F, Girgis HS, Plovanich M, Belcher-Timme CA, Sancak Y, Bao XR, Strittmatter L, Goldberger O, Bogorad RL. Integrative genomics identifies MCU as an essential component of the mitochondrial calcium uniporter. Nature. 2011;476:341-345. [RCA] [PubMed] [DOI] [Full Text] [Full Text (PDF)] [Cited by in Crossref: 1624] [Cited by in RCA: 1554] [Article Influence: 103.6] [Reference Citation Analysis (0)] |
| 18. | De Stefani D, Raffaello A, Teardo E, Szabò I, Rizzuto R. A forty-kilodalton protein of the inner membrane is the mitochondrial calcium uniporter. Nature. 2011;476:336-340. [RCA] [PubMed] [DOI] [Full Text] [Full Text (PDF)] [Cited by in Crossref: 1617] [Cited by in RCA: 1551] [Article Influence: 103.4] [Reference Citation Analysis (0)] |
| 19. | Kirichok Y, Krapivinsky G, Clapham DE. The mitochondrial calcium uniporter is a highly selective ion channel. Nature. 2004;427:360-364. [RCA] [PubMed] [DOI] [Full Text] [Cited by in Crossref: 1005] [Cited by in RCA: 1097] [Article Influence: 49.9] [Reference Citation Analysis (0)] |
| 20. | Csordás G, Golenár T, Seifert EL, Kamer KJ, Sancak Y, Perocchi F, Moffat C, Weaver D, de la Fuente Perez S, Bogorad R. MICU1 controls both the threshold and cooperative activation of the mitochondrial Ca²⁺ uniporter. Cell Metab. 2013;17:976-987. [RCA] [PubMed] [DOI] [Full Text] [Cited by in Crossref: 361] [Cited by in RCA: 407] [Article Influence: 31.3] [Reference Citation Analysis (0)] |
| 21. | Mallilankaraman K, Doonan P, Cárdenas C, Chandramoorthy HC, Müller M, Miller R, Hoffman NE, Gandhirajan RK, Molgó J, Birnbaum MJ. MICU1 is an essential gatekeeper for MCU-mediated mitochondrial Ca(2+) uptake that regulates cell survival. Cell. 2012;151:630-644. [RCA] [PubMed] [DOI] [Full Text] [Cited by in Crossref: 447] [Cited by in RCA: 554] [Article Influence: 42.6] [Reference Citation Analysis (0)] |
| 22. | Ahuja M, Muallem S. The gatekeepers of mitochondrial calcium influx: MICU1 and MICU2. EMBO Rep. 2014;15:205-206. [RCA] [PubMed] [DOI] [Full Text] [Cited by in Crossref: 33] [Cited by in RCA: 30] [Article Influence: 2.5] [Reference Citation Analysis (0)] |
| 23. | Shen K, Zheng SS, Park O, Wang H, Sun Z, Gao B. Activation of innate immunity (NK/IFN-gamma) in rat allogeneic liver transplantation: contribution to liver injury and suppression of hepatocyte proliferation. Am J Physiol Gastrointest Liver Physiol. 2008;294:G1070-G1077. [RCA] [PubMed] [DOI] [Full Text] [Full Text (PDF)] [Cited by in Crossref: 29] [Cited by in RCA: 30] [Article Influence: 1.7] [Reference Citation Analysis (0)] |
| 24. | Uzhachenko R, Ivanov SV, Yarbrough WG, Shanker A, Medzhitov R, Ivanova AV. Fus1/Tusc2 is a novel regulator of mitochondrial calcium handling, Ca2+-coupled mitochondrial processes, and Ca2+-dependent NFAT and NF-κB pathways in CD4+ T cells. Antioxid Redox Signal. 2014;20:1533-1547. [RCA] [PubMed] [DOI] [Full Text] [Cited by in Crossref: 23] [Cited by in RCA: 34] [Article Influence: 2.8] [Reference Citation Analysis (0)] |
| 25. | Della Corte CM, Viscardi G, Papaccio F, Esposito G, Martini G, Ciardiello D, Martinelli E, Ciardiello F, Morgillo F. Implication of the Hedgehog pathway in hepatocellular carcinoma. World J Gastroenterol. 2017;23:4330-4340. [RCA] [PubMed] [DOI] [Full Text] [Full Text (PDF)] [Cited by in CrossRef: 40] [Cited by in RCA: 59] [Article Influence: 6.6] [Reference Citation Analysis (0)] |
| 26. | Wang Y, Shen J, Xiong X, Xu Y, Zhang H, Huang C, Tian Y, Jiao C, Wang X, Li X. Remote ischemic preconditioning protects against liver ischemia-reperfusion injury via heme oxygenase-1-induced autophagy. PLoS One. 2014;9:e98834. [RCA] [PubMed] [DOI] [Full Text] [Full Text (PDF)] [Cited by in Crossref: 70] [Cited by in RCA: 73] [Article Influence: 6.1] [Reference Citation Analysis (0)] |
| 27. | Björnsson B, Winbladh A, Bojmar L, Sundqvist T, Gullstrand P, Sandström P. Conventional, but not remote ischemic preconditioning, reduces iNOS transcription in liver ischemia/reperfusion. World J Gastroenterol. 2014;20:9506-9512. [RCA] [PubMed] [DOI] [Full Text] [Full Text (PDF)] [Cited by in CrossRef: 13] [Cited by in RCA: 12] [Article Influence: 1.0] [Reference Citation Analysis (0)] |
| 28. | Balaban RS. The role of Ca(2+) signaling in the coordination of mitochondrial ATP production with cardiac work. Biochim Biophys Acta. 2009;1787:1334-1341. [RCA] [PubMed] [DOI] [Full Text] [Full Text (PDF)] [Cited by in Crossref: 188] [Cited by in RCA: 186] [Article Influence: 10.9] [Reference Citation Analysis (0)] |
| 29. | Peng C, Rao W, Zhang L, Wang K, Hui H, Wang L, Su N, Luo P, Hao YL, Tu Y. Mitofusin 2 ameliorates hypoxia-induced apoptosis via mitochondrial function and signaling pathways. Int J Biochem Cell Biol. 2015;69:29-40. [RCA] [PubMed] [DOI] [Full Text] [Cited by in Crossref: 46] [Cited by in RCA: 65] [Article Influence: 5.9] [Reference Citation Analysis (0)] |
| 30. | Motloch LJ, Larbig R, Gebing T, Reda S, Schwaiger A, Leitner J, Wolny M, Eckardt L, Hoppe UC. By Regulating Mitochondrial Ca2+-Uptake UCP2 Modulates Intracellular Ca2+. PLoS One. 2016;11:e0148359. [RCA] [PubMed] [DOI] [Full Text] [Full Text (PDF)] [Cited by in Crossref: 25] [Cited by in RCA: 27] [Article Influence: 2.7] [Reference Citation Analysis (0)] |
| 31. | Perocchi F, Gohil VM, Girgis HS, Bao XR, McCombs JE, Palmer AE, Mootha VK. MICU1 encodes a mitochondrial EF hand protein required for Ca(2+) uptake. Nature. 2010;467:291-296. [RCA] [PubMed] [DOI] [Full Text] [Full Text (PDF)] [Cited by in Crossref: 751] [Cited by in RCA: 725] [Article Influence: 45.3] [Reference Citation Analysis (0)] |
| 32. | Patron M, Checchetto V, Raffaello A, Teardo E, Vecellio Reane D, Mantoan M, Granatiero V, Szabò I, De Stefani D, Rizzuto R. MICU1 and MICU2 finely tune the mitochondrial Ca2+ uniporter by exerting opposite effects on MCU activity. Mol Cell. 2014;53:726-737. [RCA] [PubMed] [DOI] [Full Text] [Full Text (PDF)] [Cited by in Crossref: 358] [Cited by in RCA: 431] [Article Influence: 35.9] [Reference Citation Analysis (0)] |
| 33. | Bernardi P, Rasola A. Calcium and cell death: the mitochondrial connection. Subcell Biochem. 2007;45:481-506. [RCA] [PubMed] [DOI] [Full Text] [Cited by in Crossref: 149] [Cited by in RCA: 149] [Article Influence: 7.8] [Reference Citation Analysis (0)] |
| 34. | Rizzuto R, Pinton P, Carrington W, Fay FS, Fogarty KE, Lifshitz LM, Tuft RA, Pozzan T. Close contacts with the endoplasmic reticulum as determinants of mitochondrial Ca2+ responses. Science. 1998;280:1763-1766. [RCA] [PubMed] [DOI] [Full Text] [Cited by in Crossref: 1693] [Cited by in RCA: 1825] [Article Influence: 65.2] [Reference Citation Analysis (0)] |
| 35. | Csordás G, Várnai P, Golenár T, Roy S, Purkins G, Schneider TG, Balla T, Hajnóczky G. Imaging interorganelle contacts and local calcium dynamics at the ER-mitochondrial interface. Mol Cell. 2010;39:121-132. [RCA] [PubMed] [DOI] [Full Text] [Full Text (PDF)] [Cited by in Crossref: 637] [Cited by in RCA: 609] [Article Influence: 38.1] [Reference Citation Analysis (0)] |
| 36. | Giacomello M, Drago I, Bortolozzi M, Scorzeto M, Gianelle A, Pizzo P, Pozzan T. Ca2+ hot spots on the mitochondrial surface are generated by Ca2+ mobilization from stores, but not by activation of store-operated Ca2+ channels. Mol Cell. 2010;38:280-290. [RCA] [PubMed] [DOI] [Full Text] [Cited by in Crossref: 299] [Cited by in RCA: 331] [Article Influence: 20.7] [Reference Citation Analysis (0)] |
| 37. | de Brito OM, Scorrano L. Mitofusin 2 tethers endoplasmic reticulum to mitochondria. Nature. 2008;456:605-610. [RCA] [PubMed] [DOI] [Full Text] [Cited by in Crossref: 2039] [Cited by in RCA: 2010] [Article Influence: 111.7] [Reference Citation Analysis (0)] |
| 38. | Agha Amiri S, Shahhosseini S, Zarei N, Khorasanizadeh D, Aminollahi E, Rezaie F, Zargari M, Azizi M, Khalaj V. A novel anti-CD22 scFv-apoptin fusion protein induces apoptosis in malignant B-cells. AMB Express. 2017;7:112. [RCA] [PubMed] [DOI] [Full Text] [Full Text (PDF)] [Cited by in Crossref: 12] [Cited by in RCA: 13] [Article Influence: 1.4] [Reference Citation Analysis (0)] |


