Topic Highlight Open Access
Copyright ©The Author(s) 2016. Published by Baishideng Publishing Group Inc. All rights reserved.
World J Gastroenterol. Jan 7, 2016; 22(1): 284-299
Published online Jan 7, 2016. doi: 10.3748/wjg.v22.i1.284
Differentiation of hepatocellular carcinoma from its various mimickers in liver magnetic resonance imaging: What are the tips when using hepatocyte-specific agents?
Yang Shin Park, Chang Hee Lee, Jeong Woo Kim, Cheol Min Park, Department of Radiology, Korea University Guro Hospital, Korea University College of Medicine, Seoul 152-703, South Korea
Sora Shin, Korea University College of Medicine, Anam-dong 5-ga, Seongbuk-Gu, Seoul 136-701, South Korea
Author contributions: Lee CH designed the study; Park YS wrote the first draft of the manuscript; Park YS, Kim JW and Shin S performed literature research; Lee CH, Kim JW, Shin S, and Park CM gathered image data; Park YS, Lee CH and Park CM were involved in editing the manuscript.
Conflict-of-interest statement: We disclose that all authors have no conflict of interest about this manuscript.
Open-Access: This article is an open-access article which was selected by an in-house editor and fully peer-reviewed by external reviewers. It is distributed in accordance with the Creative Commons Attribution Non Commercial (CC BY-NC 4.0) license, which permits others to distribute, remix, adapt, build upon this work non-commercially, and license their derivative works on different terms, provided the original work is properly cited and the use is non-commercial. See: http://creativecommons.org/licenses/by-nc/4.0/
Correspondence to: Chang Hee Lee, MD, Department of Radiology, Korea University Guro Hospital, Korea University College of Medicine, 80 Guro-dong, Guro-gu, Seoul 152-703, South Korea. chlee86@korea.ac.kr
Telephone: +82-2-26263212 Fax: +82-2-8639282
Received: April 28, 2015
Peer-review started: May 6, 2015
First decision: September 29, 2015
Revised: October 13, 2015
Accepted: November 9, 2015
Article in press: November 9, 2015
Published online: January 7, 2016
Processing time: 246 Days and 17.1 Hours

Abstract

Hepatocellular carcinoma is the most common primary hepatic malignant tumor. With widespread use of liver imaging, various cirrhosis-related nodules are frequently detected in patients with chronic liver disease, while diverse hypervascular hepatic lesions are incidentally detected but undiagnosed on dynamic computed tomography and magnetic resonance imaging (MRI). However, use of hepatocyte-specific MR contrast agents with combined perfusion and hepatocyte-selective properties have improved diagnostic performance in detection and characterization of focal liver lesions. Meanwhile, the enhancement patterns observed during dynamic phases using hepatocyte-specific agents may be different from those observed during MRI using conventional extracellular fluid agents, leading to confusion in diagnosis. Therefore, we discuss useful tips for the differentiation of hepatocellular carcinoma from similar lesions in patients with and without chronic liver disease using liver MRI with hepatocyte-specific agents.

Key Words: Hepatocellular carcinoma; Gadoxetic acid; Magnetic resonance imaging; Liver cirrhosis

Core tip: Hepatocellular carcinoma is the most common primary hepatic malignant tumor. With widespread use of liver imaging, various cirrhosis-related nodules are more frequently detected in patients with chronic liver disease, while diverse hypervascular hepatic lesions are incidentally detected but undiagnosed on dynamic computed tomography and magnetic resonance imaging (MRI). However, liver MRI using hepatocyte-specific agents has been suggested to be a much more reliable modality in the detection and characterization of focal liver lesions. Therefore, we would like to discuss useful tips for the differentiation of hepatocellular carcinoma from similar lesions in patients with and without chronic liver disease using liver MRI with hepatocyte-specific agents.


INTRODUCTION

Hepatocellular carcinoma (HCC) is the fifth most common malignant neoplasm and the third most common cause of disease-related mortality worldwide[1,2]. Its incidence has been increasing in several countries. Meanwhile, in recent years, diagnostic imaging modalities for HCC have markedly improved, with technical advancements in multidetector row computed tomography (MDCT) and magnetic resonance imaging (MRI). Therefore, HCC is commonly diagnosed using dynamic CT and/or dynamic MRI without histological confirmation, on the basis of a characteristic arterial enhancement and portal venous or delayed phase washout[3,4]. For the radiological diagnosis of HCC, MRI is more sensitive (81% vs 68%) than CT, while their specificities are comparable (85% vs 95%)[5]. Moreover, liver MRI using hepatocyte-specific agents has been suggested to be much more reliable than other modalities such as MDCT and extracellular contrast-enhanced dynamic MRI[6].

Hepatocyte-specific MR contrast agents initially distribute in the extracellular fluid (ECF) compartment, similar to ECF contrast agents, and are subsequently taken up by functioning hepatocytes and excreted in the bile. Consequently, these agents provide dual benefits of dynamic imaging as well as delayed hepatobiliary phase (HBP) imaging[7]. Among the commercially available hepatocyte-specific agents, gadoxetic acid (Primovist outside the United States or Eovist in the United States, Bayer Healthcare, Berlin, Germany; formerly known as Gd-EOB-DTPA) is currently used widely because of the rapid acquisition of HBP images (10-20 min after contrast injection) and more intense HBP enhancement[7]. Furthermore, whereas dynamic MRI using hepatocyte-specific agents showed a performance comparable with that of CT with regard to focal lesion characterization, HBP significantly improved the diagnostic accuracy in terms of lesion detection and characterization[8-11].

On the other hand, with technical improvements in and the widespread use of liver MRI, various cirrhosis-related nodules are more frequently detected in patients with chronic liver disease, while diverse hypervascular hepatic lesions are incidentally detected but undiagnosed on CT. Consequentially, these hepatic lesions are mostly referred for MRI, particularly liver MRI using hepatocyte-specific agents, for lesion characterization. These diverse hepatic lesions may occasionally mimic HCC, resulting in a diagnostic challenge in clinical practice. Therefore, the aim of this study is to briefly describe the imaging findings of HCC and lesions mimicking HCC and discuss useful tips for the differentiation of HCC from similar lesions using liver MRI with hepatocyte-specific agents.

MRI FINDINGS OF HCC

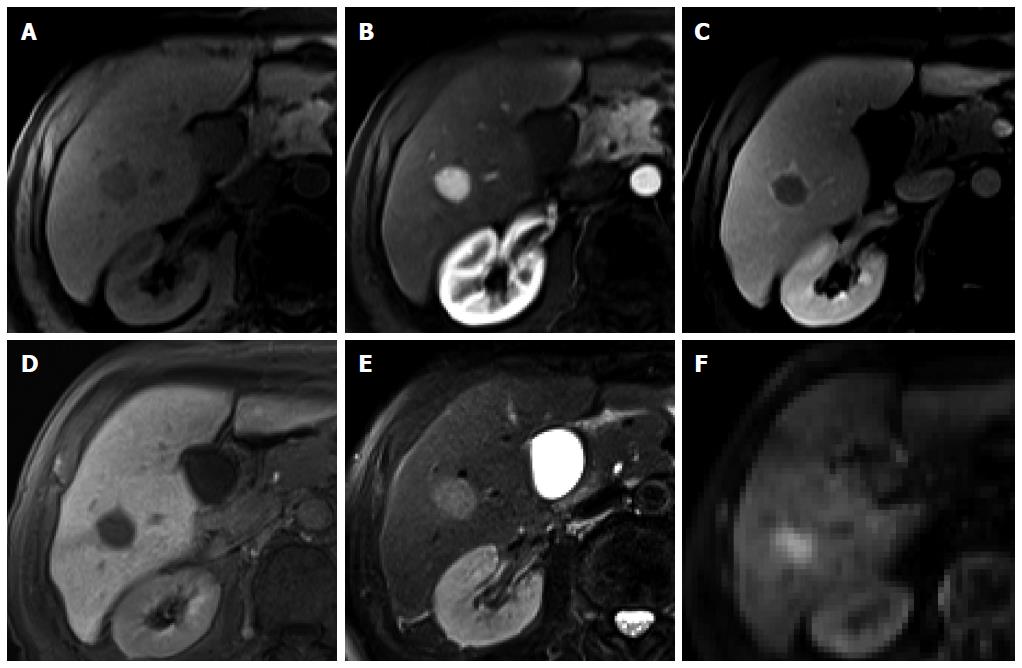
On gadoxetic acid-enhanced MRI, HCC typically shows intense arterial enhancement and delayed washout (Figure 1). On HBP images, it usually shows low signal intensity (SI) in strongly enhanced normal hepatic parenchyma because of the absence of functioning hepatocytes or decreased expression of organic anionic transporting polypeptide (OATP), which is responsible for the intracellular uptake of contrast material[12]. On the other hand, 10%-20% of HCCs appear hypovascular during the hepatic arterial phase. Approximately 10% show high SI on HBP images because of OATP overexpression[12-14].

Figure 1
Figure 1 Hepatocellular carcinoma in a 74-year-old man with hepatitis C infection. A: Precontrast T1-weighted image shows a hypointense nodule in segment 6; B: Hepatic arterial phase of gadoxetic acid-enhanced MRI shows homogeneous marked enhancement of the tumor; C: Transitional phase shows washout of the contrast medium in the tumor with capsular enhancement; D: Hepatobiliary phase shows marked hypointensity of the tumor relative to the liver parenchyma; E, F: T2-weighted image and diffusion weighted image (b = 800) show high SI of the tumor.

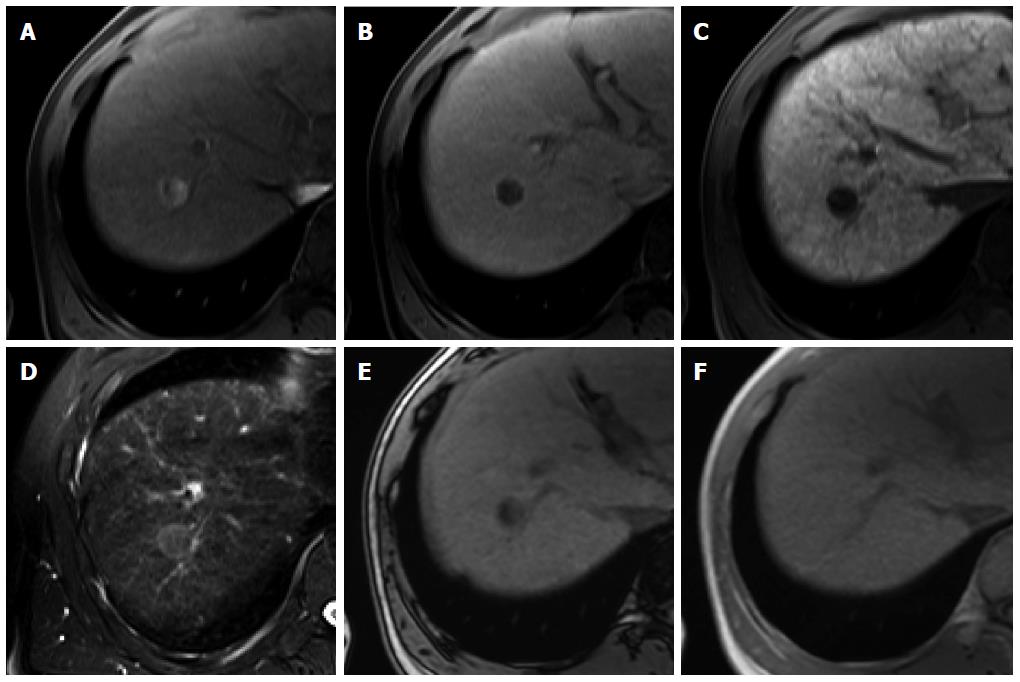
In addition, there are several ancillary features favoring the diagnosis of HCC[15]. Approximately 70% of lesions exhibit a tumor capsule or pseudocapsule[16] (Figure 2), which appears as a delayed enhancing rim, and the appearance of the capsule has been shown to be an important predictor of HCC[17]. A nodule-in-nodule appearance, suggesting the emergence of a progressed HCC within a dysplastic nodule (DN) or early HCC, is not frequently observed, although it is characteristic of HCC[18]. A mosaic appearance attributed to intratumoral heterogeneity is more common with larger HCCs, but not with tumors other than HCC[15].

Figure 2
Figure 2 Fat-containing hepatocellular carcinoma in a 57-year-old man with hepatitis B infection. A: Hepatic arterial phase using gadoxetic acid shows heterogeneously arterial enhancement with intralesional low SI area; B: Transitional phase shows washout of the contrast medium in the tumor with capsular enhancement; C: Hepatobiliary phase shows marked hypointensity of the tumor relative to the liver parenchyma; D: T2-weighted image shows high signal intensity of the tumor; E, F: Opposed phase (E) and in-phase (F) T1-weighted gradient echo images reveals area of signal drop on opposed-phase image, indicating fat-containing lesion.

On nonenhanced T1- and T2-weighted images, HCC shows variable SIs depending on the presence of iron, fat, or hemorrhage, although typically, low SI is observed on T1-weighted images and mild to moderately high SI is observed on T2-weighted images. HCC also typically demonstrates restricted diffusion. The findings of high SI on T2-weighted images and restricted diffusion are not specific to HCC, although they favor the diagnosis of malignancy and aid in the differentiation of HCC from cirrhotic nodules[15].

DIFFERENTIAL DIAGNOSIS
In patients with chronic liver disease

Regenerative and dysplastic nodules: Cirrhosis is characterized by the progressive fibrosis of the liver parenchyma and a spectrum of hepatocellular nodules that mark the progression from regenerative nodules (RNs) to low- and high-grade dysplastic nodules (DNs) to, eventually, HCC[19,20]. There is a considerable overlap among these nodules during hepatocarcinogenesis on histopathology and imaging, although the characteristic imaging findings of hepatocarcinogenesis have been relatively well established[15,20].

RNs usually exhibit iso SI or low SI on T2-weighted images and variable SIs on T1-weighted images, while DNs characteristically exhibit high SI on T1-weighted images and iso SI or low SI on T2-weighted images. This is because DNs may contain more copper or iron compared with the background liver. Because these nodules may contain varying amounts of lipids, copper, or iron, they exhibit variable SIs on T1- and T2-weighted images depending on their content. However, RNs and DNs mostly do not exhibit high SI on T2-weighted images or restricted diffusion[21]. Therefore, during the differential diagnosis of RNs or DNs from HCCs, the presence of mild to moderately high SI on T2-weighted images or restricted diffusion strongly indicates the presence of HCC.

Following the injection of gadoxetic acid, because RNs are predominantly supplied by the portal vein, most of them enhance to the same degree as the adjacent liver parenchyma, resulting in iso SI in the hepatic arterial and later phases. Occasionally, they demonstrate slightly lower enhancement, which is observed as mildly low SI in the portal and transitional phases. Meanwhile, because DNs exhibit a decreased number of portal tracts with a relatively lesser increase in the number of unpaired arteries during hepatocarcinogenesis, they mostly demonstrate iso SI or low SI in the hepatic arterial and later phases. However, some DNs may have an increased arterial supply because of neoangiogenesis and enhance more than the liver in the hepatic arterial phase; this may lead to a misdiagnosis of hypervascular HCC[20].

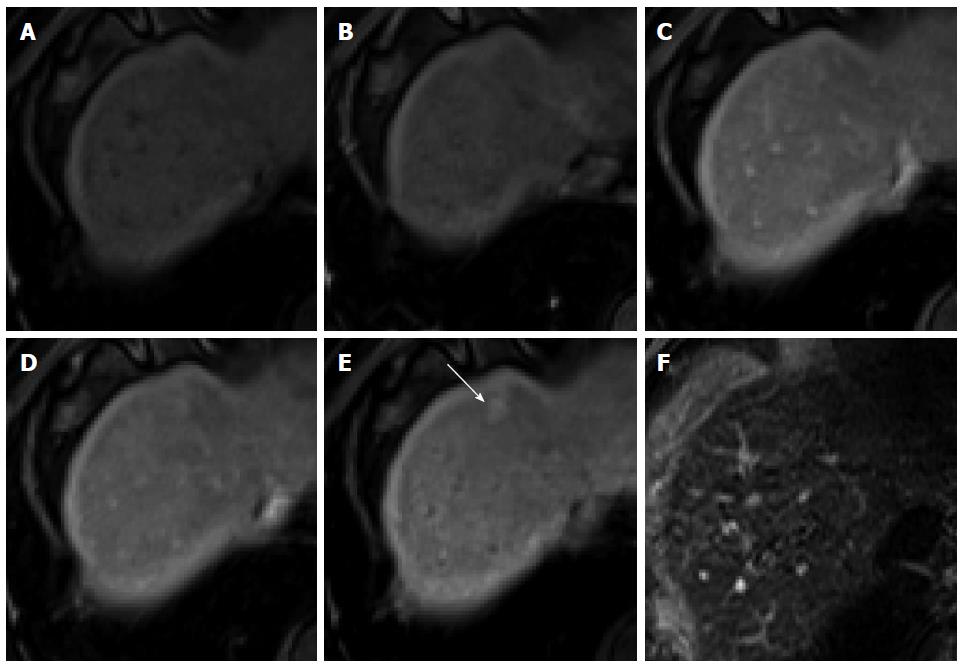
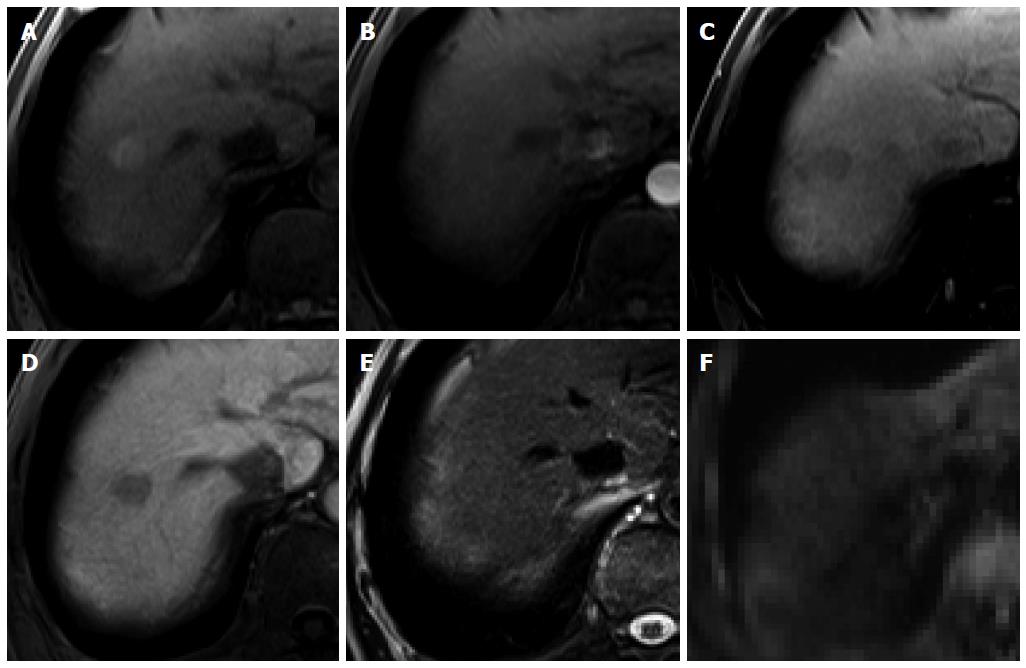
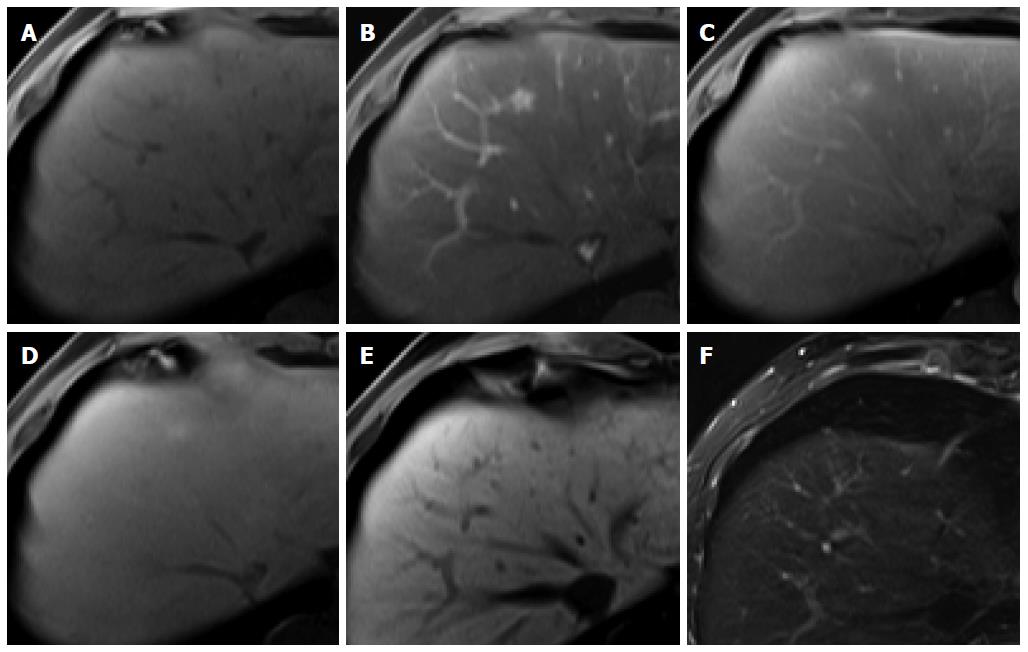
On HBP images obtained using gadoxetic acid, RNs typically show iso SI or high SI because of preserved OATP expression[20] (Figure 3). DNs usually show iso SI or low SI on HBP images because of decreased OATP expression (Figure 4). Therefore, because OATP expression decreases during hepatocarcinogenesis, iso SI to high SI on HBP images is generally suggestive of benign lesions (RNs or low-grade DNs), while low SI on HBP images is a strong predictor of premalignancy or malignancy (high-grade DNs or HCCs).

Figure 3
Figure 3 Regenerative nodule in a 61-year-old man with alcoholic liver cirrhosis. A-D: Precontrast T1-weighted image, hepatic arterial phase, portal venous phase, and transitional phase show no visible lesion in the scanned area; E: Hepatobiliary phase shows a hyperintense nodule (arrow) in hepatic S4; F: T2-weighted image shows isointensity of the tumor.
Figure 4
Figure 4 Dysplastic nodule in the same patient as Figure 1. A: precontrast T1-weighted image shows a hyperintense nodule in segment 8, suggesting high contents of iron or copper; B: Hepatic arterial phase of gadoxetic acid-enhanced MRI shows isointensity of the tumor; C, D: transitional and hepatobiliary phases show hypointensity of the tumor relative to the liver parenchyma; E, F: T2-weighted image and diffusion weighted image (b = 800) show isointensity of the tumor.

Focal nodular hyperplasia-like nodules: Focal nodular hyperplasia (FNH)-like nodules are histopathologically and immunohistochemically identical to classic FNH observed in noncirrhotic livers, although they occur in patients with chronic liver disease or cirrhotic livers[22]. Therefore, the imaging findings of FNH-like nodules are also identical to the characteristic radiological findings of classic FNH on dynamic CT and MRI. Usually, FNH-like nodules are small hypervascular lesions[23] (Figure 5). However, if hypervascular FNH-like nodules are detected in cirrhotic livers, it is often difficult to differentiate them from HCC, particularly in atypical cases[24]. Because of identical imaging features, differences between atypical FNH-like nodules and typical HCCs will be discussed later in the FNH section. On the other hand, with regard to differentiation of typical FNH-like nodules from atypical HCCs with HBP high SI, lack of delayed washout is a key imaging finding for diagnosis of NRH (Kim JW, unpublished data, 2014)[25].

Figure 5
Figure 5 Focal nodular hyperplasia-like nodule in a 45-year-old man with hepatitis B infection. A: Precontrast T1-weighted image shows isointensity of the tumor; B: Hepatic arterial phase using gadoxetic acid shows lobulating-contoured, marked enhanced nodule in segment 4; C, D: Portal venous and transitional phases show slight hyperenhancement of the tumor relative to the liver parenchyma; E: Hepatobiliary phase shows isointensity or subtle peripheral ring-like enhancement of the tumor; F: T2-weighted image shows isointensity of the tumor.

Nodular regenerative hyperplasia: Nodular regenerative hyperplasia (NRH) is a rare liver condition characterized by the widespread benign transformation of the hepatic parenchyma into small RNs. NRH may lead to the development of noncirrhotic portal hypertension[26] and is often associated with organ transplantation, myeloproliferative disease, or autoimmune processes. NRH exhibits iso SI to high SI on T1-weighted images (93.9%) and iso SI on T2-weighted images (82%), which are slightly different from the T1 and T2 SIs for FNH[27]. In one study using hepatocyte-specific MR agents with gadobenate dimeglumine[27], all NRHs showed arterial enhancement and iso SI to high SI on portal venous, equilibrium, and HBP images. Although the dynamic enhancement pattern of NRH resembles that of FNH, FNHs and FNH-like nodules show strong arterial enhancement and NRHs show mild arterial enhancement[27,28]. According to unpublished data of Kozaka et al[28], NRH appears as peripheral ring-like enhancement of the lesion on HBP images using gadoxetic acid, and they described this appearance as a doughnut-like nodule in HBP images. Therefore, arterial enhancement degree and SIs on T1- and T2-weighted images can provide differentiation of NRHs from FNHs and FNH-like nodules. Furthermore, the absence of washout and either iso to high SI or doughnut-like nodules on HBP images will distinguish this benign lesion from HCC.

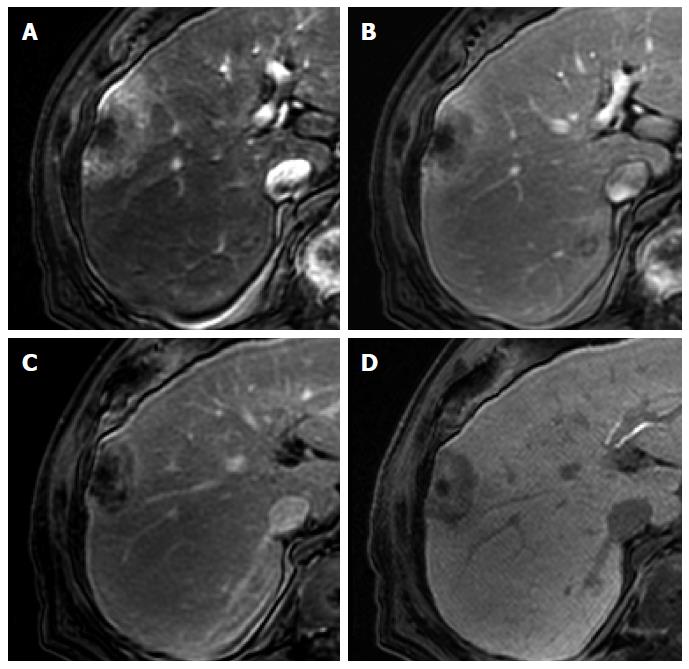
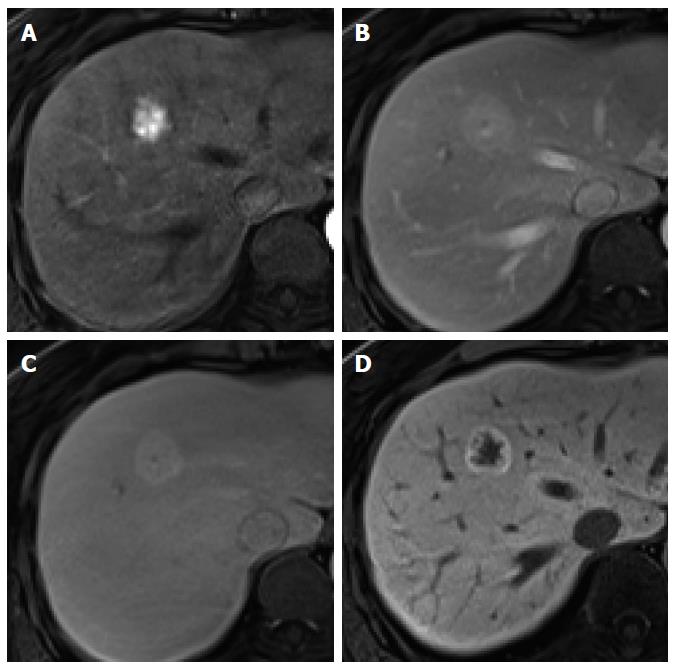
Intrahepatic cholangiocarcinoma: Intrahepatic mass-forming cholangiocarcinoma (ICC) is the second most common primary hepatic malignancy after HCC. The typical enhancement pattern of ICC (77%) is peripheral rim-like arterial enhancement with progressive and concentric fill-in enhancement[29-31] (Figure 6). However, small ICC lesions (less than 3 cm in diameter, up to 6% of ICCs) can show an atypical enhancement pattern characterized by homogeneous arterial enhancement with washout, thus mimicking HCC[30] (Figure 6). Moreover, hepatitis C virus-induced liver cirrhosis has been recognized as an important risk factor for the development of ICC[32]. It may cause difficulty in the differential diagnosis of small hypervascular ICC from HCC in patients with liver cirrhosis, particularly that secondary to hepatitis C infection. Meanwhile, on gadoxetic acid-enhanced HBP images, most ICCs (96%) show low SI. In previous studies, 32%-85% of ICCs showed a central hyperintense area with a peripheral hypointense rim, known as target appearance. Furthermore, a central high SI was described as an EOB cloud, attributed to contrast uptake by the central fibrotic stroma[30,31,33] (Figure 7). In a comparison between ICC and HCC using gadoxetic acid-enhanced MRI[33], the target appearance on HBP images was more common with ICC than with HCC (85.7% vs 17.1%) and was the best predictor for distinguishing ICC from HCC. Furthermore, HBP images were found to show an increased lesion conspicuity (lobulated shape of ICC vs globular shape of HCC) and better delineation of daughter nodules and intrahepatic metastasis[30], which may aid in ICC diagnosis.

Figure 6
Figure 6 Intrahepatic cholangiocarcinoma in an 80-year-old man. A: Hepatic arterial phase using gadoxetic acid shows peripheral arterial enhancing mass with capsular retraction at the hepatic segment 8 subcapsular location; B: Portal venous and transitional phases show target appearance with peripheral enhancement and central nonenhancement; C, D: Hepatobiliary phase also shows low signal intensity of the most outer portion, high signal intensity of mid portion, and marked low signal intensity of the center of the tumor.
Figure 7
Figure 7 Intrahepatic cholangiocarcinoma in an 80-year-old man. A: Hepatic arterial phase using gadoxetic acid shows heterogeneously arterial enhancing nodule in hepatic segment 4 dome; B, C: Portal venous and transitional phases show delayed washout; D: Hepatobiliary phase shows target appearance with peripheral low signal intensity and central high signal intensity.
In patients without chronic liver disease or with a normal liver

Focal nodular hyperplasia: FNH is the second most common benign hepatic tumor, found more commonly in healthy young and middle-aged women. Histologically, FNH is characterized by a central fibrous scar with surrounding nodules of hyperplastic hepatocytes and small bile ducts. Because of the benign nature of FNH, which usually necessitates conservative management, noninvasive diagnosis is important. Characteristic morphological features and dynamic enhancement patterns have been well demonstrated for FNH[34]. Morphologically, FNH shows a lobulated or microlobulated border without a true tumor capsule and has a central fibrous scar. Similar to the typical imaging findings observed on dynamic CT and MRI using conventional ECF agents, FNH shows intense and homogeneous arterial enhancement that subsequently fades without delayed washout and iso SI or high SI in the portal venous and transitional phases of gadoxetic acid-enhanced MRI[34,35]. Because of continuous contrast uptake by functioning hepatocytes within the tumor, the majority (91%-96%) of FNHs show iso SI or high SI on HBP images[34-37]. Iso SI or high SI on HBP images is a characteristic imaging finding of FNH, allowing accurate diagnosis[35,37-39]. Although a small number of FNHs (23%) show mixed or low SI on HBP images, peripheral ring-like enhancement of the lesion is frequently observed and is crucial for the identification of FNH[36] (Figure 8). On the other hand, the presence of a typical central scar is a reliable radiological sign for FNH diagnosis. However, a macroscopic central scar occurs in 50%-61% of FNHs and is often absent in FNHs measuring less than 3 cm[37,40]. Compared with that observed using ECF contrast agents, a central scar observed using gadoxetic acid does not typically demonstrate delayed enhancement, resulting in markedly low SI on HBP images[41]. Accordingly, FNH with a large central scar rarely shows low SI on HBP images. Because approximately 10% of HCC and less than 10% of FNH lesions show high and low SI, respectively, on HBP images[13,34,35,37], a definitive diagnosis of HCC and FNH is sometimes difficult. However, with regard to hypervascular FNH with low SI on HBP images, female sex, presence in the normal liver, characteristic morphologic features such as lobulated or microlobulated borders and a central scar, lack of delayed washout, and ring-like enhancement with central iso SI to low SI on HBP images are helpful for the diagnosis of FNH.

Figure 8
Figure 8 Focal nodular hyperplasia in a 55-year-old woman. A: Hepatic arterial phase image of gadoxetic acid-enhanced etic resonance imaging shows lobulating contoured, marked enhanced tumor; B, C: Portal venous and transitional phases show slightly hyperenhancement of the tumor relative to the liver parenchyma, and central hypointense area is suspected as central scar; D: Hepatobiliary phase shows peripheral ring-like enhancement of the tumor with larger area of markedly hypointense central scar as compared with the other phase images.

Hepatocellular adenoma: Hepatocellular adenoma (HCA) is the third most common benign hepatic tumor that particularly affects young and middle-aged women. It was recently subclassified into four groups according to the genotype and phenotype: inflammatory (50%), hepatocyte nuclear factor (NHF)-1α-mutated (35%-40%), β-catenin-mutated (10%-15%), and unclassified (< 10%)[42]. The MRI findings vary on the basis of histological findings and associated complications, and MRI has proven to be an accurate method for subtyping HCAs[43-45]. For several years, the differentiation of HCA from FNH has been a major concern, because these hypervascular tumors are frequently observed in women of a similar age. HCA requires surgical resection because of the risk of hemorrhage and malignant transformation[35,38,39]. On the other hand, on gadoxetic acid-enhanced MRI, 90% of HCAs show mild-to-moderate arterial enhancement, 72% show low SI in the transitional phase, and 93% show low SI on HBP images[35]. In particular, HNF-1α-mutated and β-catenin-mutated HCAs show arterial enhancement with washout and low SI on HBP images, mimicking HCC, while some inflammatory HCAs show arterial enhancement with persistent enhancement and high SI on HBP images, mimicking FNH[35,46]. Therefore, the majority of HCAs shows the typical enhancement pattern shown by HCC. However, the most important fact is that HCA typically occurs in noncirrhotic livers in women of child-bearing age, while HCC primarily occurs in cirrhotic livers. Notwithstanding, differentiation between HCA and HCC in noncirrhotic livers is an issue. However, a larger fat component is more typical for HNF-1α-mutated HCA[44]. A rim-like band with high SI in the periphery of the lesion on T2-weighted images (atoll sign) is observed for 13% of HCA[39,43]. Furthermore, a capsule or a pseudocapsule, which appears as a delayed enhancing rim, is observed less commonly in HCA than in HCC (Figure 9) (25%-31% vs 70%)[16,47,48]. Although there is no study on the advantages of using gadoxetic acid for the differential diagnosis of HCA and HCC, these ancillary findings will be helpful in their differentiation in noncirrhotic livers.

Figure 9
Figure 9 Hepatocellular adenoma in a 45-year-old woman. A: Hepatic arterial phase using gadoxetic acid shows moderate arterial enhancement; B: Transitional phase shows delayed washout without capsule or pseudocapsule; C: Hepatobiliary phase shows heterogeneous low signal intensity of the tumor; D: T2-weighted image shows a peripheral hyperintense band with moderate high signal intensity of residual tumor.

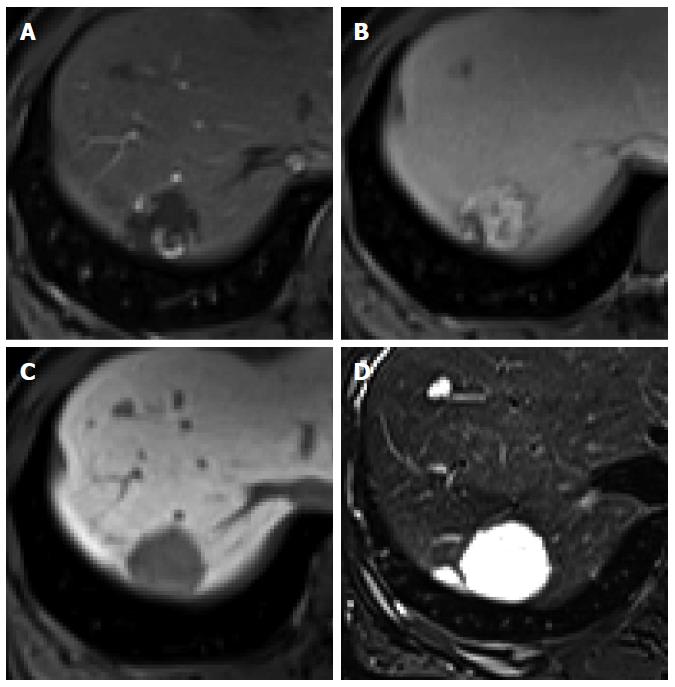
Hemangioma: Hemangioma is the most common benign hepatic tumor[49]. On dynamic CT and MRI using conventional ECF agents, a typical hemangioma shows early peripheral nodular enhancement with centripetal and prolonged enhancement (Figure 10). High-flow hemangiomas, which account for 16% of all hemangiomas and 42% of hemangiomas measuring less than 1 cm in diameter, show immediate homogeneous arterial enhancement with persistent enhancement in the portal and equilibrium phase[49]. With regard to gadoxetic acid-enhanced MRI, hemangioma shows typically low SI on HBP images because of the absence of hepatocytes in the lesion[50]. Furthermore, it shows low SI in the transitional phase (Figure 11). Because contrast uptake by hepatocytes begins as early as the portal venous phase and parenchymal enhancement gradually increases in the transitional phase and HBP, hemangioma shows a relatively decreased SI compared with the parenchyma, exhibiting washout in the transitional phase[50]. Although this has been described as “pseudowashout”[51], hemangioma shows SI equivalent to that of the portal vein in all phases, with a gradual decrease in SI from the portal phase to HBP (no rapid washout)[50]. Moreover, hemangioma shows typically bright and high SI on T2-weighted images and high SI on diffusion-weighted images with high apparent diffusion coefficient value[51,52]. Therefore, high-flow hemangioma on gadoxetic acid-enhanced MRI, which shows arterial hyperenhancement with pseudowashout, can be confused for HCC. However, bright and high SI on T2-weighted images, high apparent diffusion coefficient value, and SI equivalent to that of the portal vein in all phases may be helpful for the differentiation of hemangioma from HCC.

Figure 10
Figure 10 Hepatic hemangioma in a 45-year-old woman. A: Hepatic arterial phase using gadoxetic acid shows peripheral nodular enhancement of the tumor in segment 7; B: Transitional phase shows centripetal and prolonged enhancement; C: Hepatobiliary phase shows hypointense defect relative to hepatic parenchyma; D: T2-weighted image shows bright and high signal intensity.
Figure 11
Figure 11 Hepatic hemangioma in a 54-year-old man. A: Hepatic arterial phase in gadoxetic acid-enhanced MRI shows homogeneous marked enhancement of the tumor in segment 3; B: Transitional phase shows slightly low signal intensity of the tumor relative to the liver parenchyma; C: Hepatobiliary phase shows more markedly low signal intensity of the tumor; D: T2-weighted image shows bright and high signal intensity of the tumor.

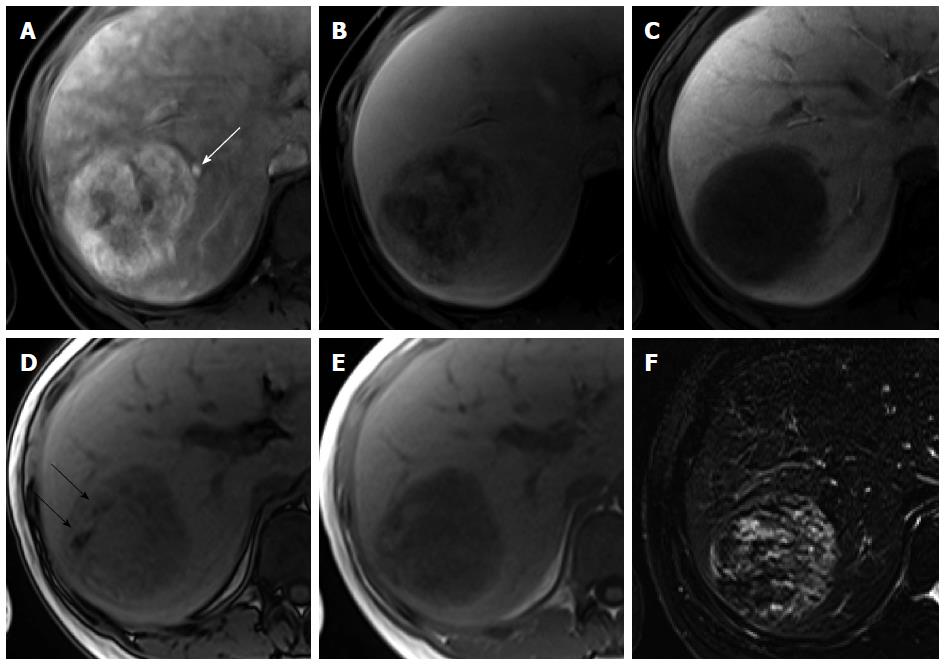
Angiomyolipoma: Angiomyolipoma (AML) is a benign, nonencapsulated mesenchymal tumor comprising varying proportions of three tissue elements: blood vessels, smooth muscle, and mature adipose tissue. The presence of fat tissue is the most important radiological feature of AML, although it is not specific for AML. The fat component of AML varies from less than 10% to more than 90% of the tumor volume, resulting in a varied imaging appearance and leading to an erroneous diagnosis in most cases. In addition, the epithelioid type of AML, which contains no or a minimal amount of macroscopic fat, demonstrates arterial enhancement and delayed washout, mimicking HCC[53]. Therefore, AML has been commonly misdiagnosed as HCC. On dynamic CT and MRI using conventional ECF agents, the fatty areas of AML are well vascularized and show early enhancement, whereas steatotic foci in HCC are relatively avascular and show less contrast enhancement[54]. With regard to the vascular components of AML, tortuous central tumoral vessels and early draining veins were found to be pathognomonic features of AML[55]. On the other hand, only one study differentiated between AML and HCC using gadoxetic acid-enhanced MRI[56]. Kim et al[56] reported that 100% of AMLs and 85% of HCCs showed arterial enhancement and delayed washout on MRI using gadoxetic acid. Compared with HCC, AML was found to show homogeneous low SI on HBP images more frequently (83% vs 41%) (Figure 12), while the degree of enhancement for this lesion on HBP images was found to be much lower than that for the spleen (92% vs 30%). They explained that AML is devoid of hepatocytes, leading to a more homogeneously lower SI on HBP images, while HCC may contain some dysplastic hepatocytes, leading to a more heterogeneously higher SI on HBP images. Therefore, HBP of gadoxetic acid-enhanced MRI would be the most beneficial sequence for discriminating AML from HCC. In addition, because AML is common in women, younger patients, and patients with a normal liver, the occurrence of lesions in young women with a normal liver would be a helpful clue for its differential diagnosis.

Figure 12
Figure 12 Angiomyolipoma in a 33-year-old woman. A: Hepatic arterial phase using gadoxetic acid shows heterogeneous arterial enhancement of the tumor. Early venous drainage to the right hepatic vein is seen (white arrow); B: Transitional phase shows heterogeneously low signal intensity; C: Hepatobiliary phase shows homogeneously low signal intensity; D, E: Opposed phase (D) and in-phase (E) T1-weighted gradient echo images reveal hypointense mass with area of signal drop on opposed-phase image (black arrows), indicating fat-containing lesion; F: T2-weighted image shows heterogeneous signal intensity of the tumor.

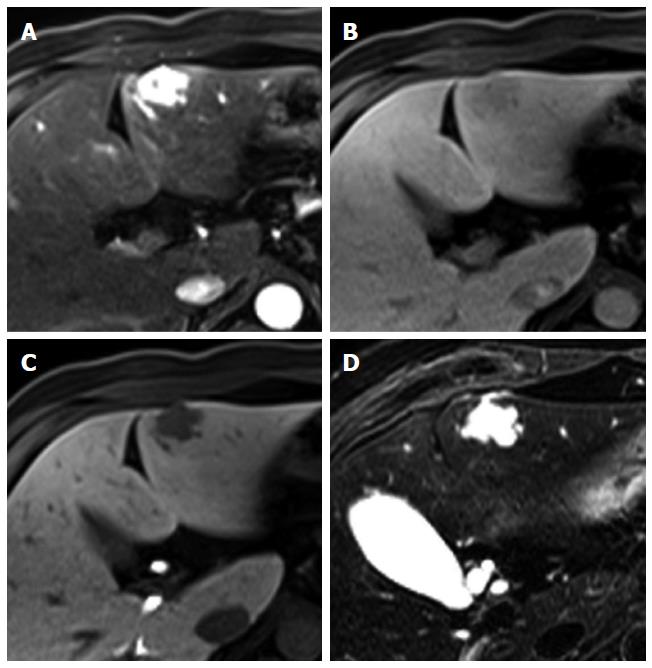
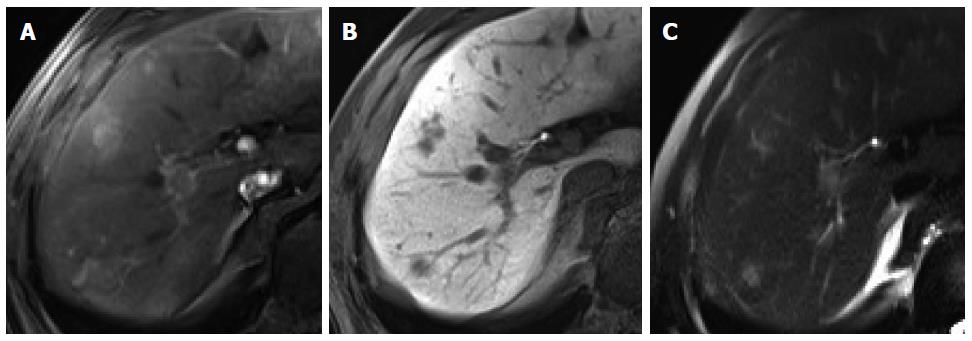
Focal eosinophilic infiltration: Focal eosinophilic infiltration (FEI) is a focal hepatic lesion caused by eosinophil-induced tissue damage. It is associated with various eosinophilia-related conditions such as parasitic infections, allergic reactions, hypereosinophilic syndrome, and internal malignancies. On imaging, FEI lesions appear as small, ill-defined, nonspherical lesions, with low attenuation in the portal phase during dynamic CT[57]. Nevertheless, radiological differentiation of FEI from hepatic metastasis is difficult because of its multiplicity and higher incidence in patients with an underlying malignancy[58,59]. Furthermore, arterial hypervascularity is infrequently observed in FEI[60]. On gadoxetic acid-enhanced MRI in particular, we observed that FEI showed arterial enhancement [70%; rim (37.1%) and homogeneous (22.9%) enhancement] and low SI in the portal venous phase, transitional phase, and HBP (80%, 88.6%, and 100%, respectively), resulting in 45.7% of lesions showing the typical enhancement pattern of HCC[61] (Figure 13). However, FEI was found to show characteristically mixed or intermingled low SI, irregular margins, and nonspherical shapes on HBP images, which would be helpful for characterizing this lesion[62]. Size discrepancy on HBP images relative to the size on T1- or T2-weighted images is another characteristic finding of FEI, although there are studies on the differentiation of FEI from metastasis using gadoxetic acid[58,59,62]. In addition, iso SI on T1-weighted images is a useful MRI finding for the diagnosis of FEI[59].

Figure 13
Figure 13 Focal eosinophilic infiltration in a 52-year-old man. A: Hepatic arterial phase of gadoxetic acid-enhanced MRI shows two irregular homogeneously enhancing nodular lesions in segments 7 and 8; B: Hepatobiliary phase shows low signal intensities with ill-defined margin and nonspherical shape; C: Heavily T2-weighted image shows smaller size of the lesions in S8, compared to (B).

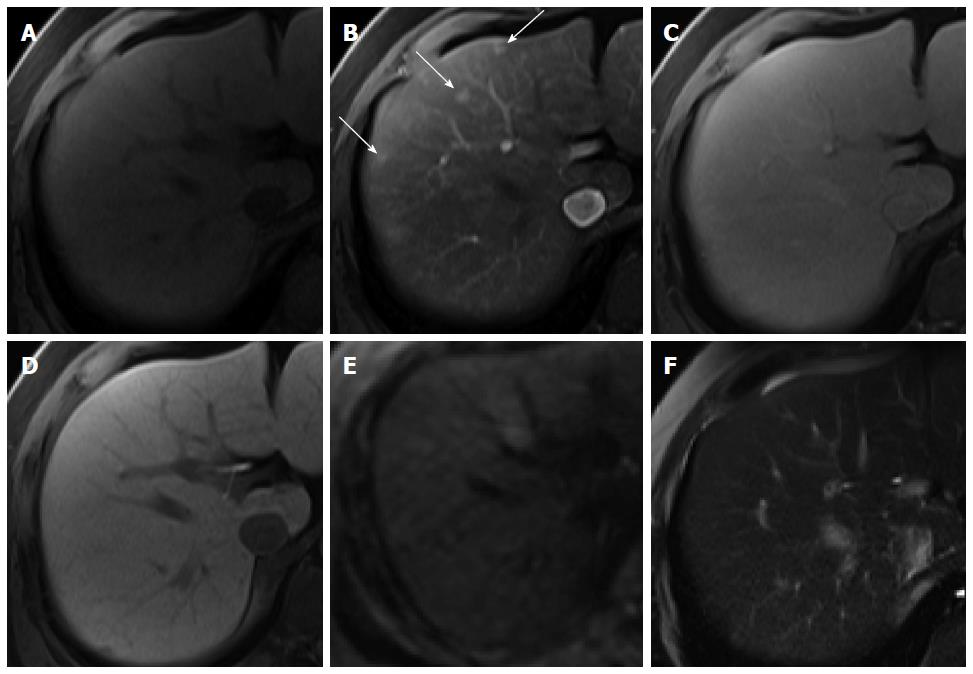
Hypervascular pseudolesions: Hypervascular pseudolesions, also known as arterioportal shunts, are typically wedge-shaped lesions with arterial enhancement in a subcapsular location. Typical lesions are easy to recognize and diagnose[63]. Meanwhile, subcentimeter-sized, small hypervascular pseudolesions tend to be nodular in shape[64] and are one of the primary lesions mimicking HCCs, resulting in difficulties in differential diagnosis. In HBP of gadoxetic acid-enhanced MRI, most hypervascular pseudolesions (94.3%) show iso SI compared with the surrounding liver tissue (Figure 14), which can be attributed to the intact hepatocyte function of these lesions[65], whereas up to 13% of nodular hypervascular pseudolesions show low SI on HBP images[64], also commonly demonstrated by HCCs. However, SI on HBP images is significantly lower for HCCs than for pseudolesions. Therefore, even though hypervascular pseudolesions rarely show low SI on HBP images, this finding may be helpful for accurate differentiation from HCC.

Figure 14
Figure 14 Hypervascular pseudolesion in a 49-year-old man with normal liver. A: Precontrast T1-weighted image shows no focal hepatic lesion; B: Hepatic arterial phase using gadoxetic acid shows several arterial enhancing nodular lesions in the liver (arrows); C-F: Transitional, hepatobiliary, T2-weighted, and diffusion weighted images show no signal change.

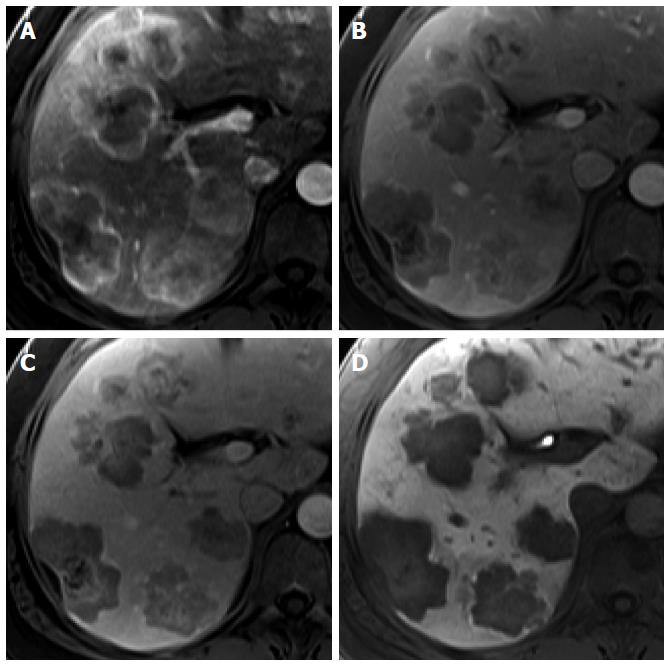
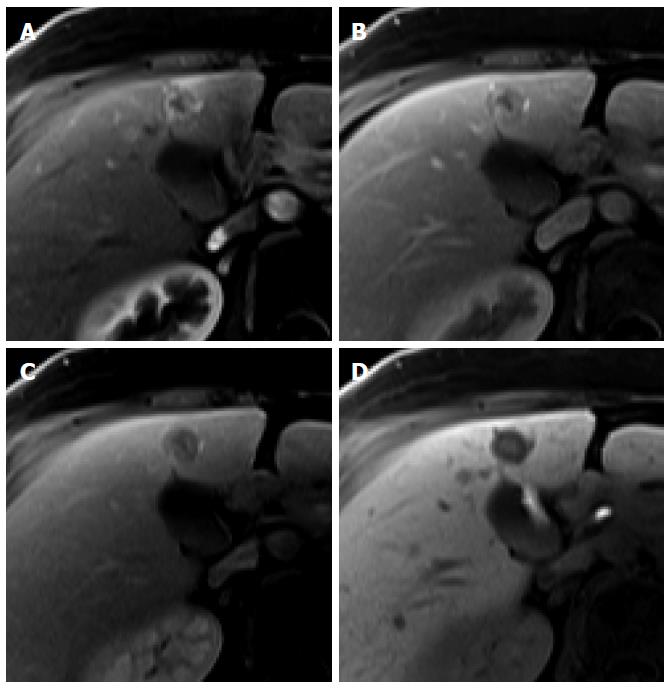
Metastasis: Metastases are the most common malignant hepatic tumor. Metastases usually manifest as multiple discrete nodules or masses but occasionally manifest as a solitary nodule or mass[66]. Hepatic metastases from adenocarcinoma, such as colorectal cancer, are usually hypovascular and have arterial rim-like enhancement. Characteristically, neuroendocrine tumor, renal cell carcinoma, melanoma, and breast cancer are well known for hypervascular metastasis, showing arterial enhancement with delayed washout, like HCC. Although there have been few studies on enhancement pattern using gadoxetic acid, they have been commonly identified as defects on HBP images, owing to no functioning hepatocytes within the tumor[67]. However, in colorectal cancer liver metastasis, homogeneous defects on HBP were not common (27.8%) and heterogeneous defects on HBP were most common (63.3%)[68] (Figure 15). In breast cancer liver metastasis, this commonly manifested as a target sign (62%) with central high SI and peripheral low SI rim on the HBP, like ICC, because of contrast pooling at the central fibrotic area[67] (Figure 16). Therefore, hepatic metastases may appear as homogeneous defects, heterogeneous defects, or with target appearance on HBP images and the most common finding on HBP may vary from tumor to tumor. Meanwhile, the presence of multiple focal lesions in the non-cirrhotic liver of a patient with known malignancy, a homogeneous or heterogeneous defect, or target appearance on HBP image favor the diagnosis of metastasis.

Figure 15
Figure 15 Hepatic metastasis from colon cancer in a 74-year-old man. A: Hepatic arterial phase using gadoxetic acid shows multiple arterial rim-like enhancing tumors with lobulating margin; B, C: Portal venous and transitional phases show heterogeneously low signal intensity of the tumors; D: Hepatobiliary phase shows peripheral hypointense rim with subtle high signal intensity of the center.
Figure 16
Figure 16 Hepatic metastasis from breast cancer in a 61-year-old woman. A: Hepatic arterial phase using gadoxetic acid shows arterial rim-like enhancement; B, C: Portal venous and transitional phases show delayed washout of periphery of the tumor with central nonenhancement; D: Hepatobiliary phase shows target appearance with subtle high signal intensity of the center and peripheral low signal intensity rim.
CONCLUSION

In conclusion, we have described the key differentiating features for HCCs and lesions mimicking HCCs on gadoxetic acid-enhanced MRI for patients with and without chronic liver disease. HBP images obtained using gadoxetic acid provide useful information for the detection and characterization of focal hepatic lesions, although it should be noted that the appearance on HBP itself does not replace the information provided by the static and dynamic phases. However, the enhancement patterns observed during dynamic phases in gadoxetic acid-enhanced MRI may be different from those observed during MRI using conventional ECF agents, leading to confusion in diagnosis. Therefore, in addition to the contrast enhancement patterns on dynamic phase and HBP images, ancillary findings such as tumor appearance in each static phase and on other sequences such as T1- and T2-weighted images, along with clinical information, can aid in precise diagnosis.

Footnotes

P- Reviewer: Qin JM S- Editor: Qi Y L- Editor: Logan S E- Editor: Wang CH

References
1.  Nordenstedt H, White DL, El-Serag HB. The changing pattern of epidemiology in hepatocellular carcinoma. Dig Liver Dis. 2010;42 Suppl 3:S206-S214.  [PubMed]  [DOI]  [Cited in This Article: ]  [Cited by in Crossref: 367]  [Cited by in F6Publishing: 397]  [Article Influence: 26.5]  [Reference Citation Analysis (0)]
2.  Ferlay J, Shin HR, Bray F, Forman D, Mathers C, Parkin DM. Estimates of worldwide burden of cancer in 2008: GLOBOCAN 2008. Int J Cancer. 2010;127:2893-2917.  [PubMed]  [DOI]  [Cited in This Article: ]  [Cited by in Crossref: 11128]  [Cited by in F6Publishing: 11733]  [Article Influence: 838.1]  [Reference Citation Analysis (4)]
3.  European Association For The Study Of The Liver; European Organisation For Research And Treatment Of Cancer. EASL-EORTC clinical practice guidelines: management of hepatocellular carcinoma. J Hepatol. 2012;56:908-943.  [PubMed]  [DOI]  [Cited in This Article: ]  [Cited by in Crossref: 4059]  [Cited by in F6Publishing: 4440]  [Article Influence: 341.5]  [Reference Citation Analysis (2)]
4.  Bruix J, Sherman M. Management of hepatocellular carcinoma: an update. Hepatology. 2011;53:1020-1022.  [PubMed]  [DOI]  [Cited in This Article: ]  [Cited by in Crossref: 5972]  [Cited by in F6Publishing: 6438]  [Article Influence: 459.9]  [Reference Citation Analysis (1)]
5.  Colli A, Fraquelli M, Casazza G, Massironi S, Colucci A, Conte D, Duca P. Accuracy of ultrasonography, spiral CT, magnetic resonance, and alpha-fetoprotein in diagnosing hepatocellular carcinoma: a systematic review. Am J Gastroenterol. 2006;101:513-523.  [PubMed]  [DOI]  [Cited in This Article: ]
6.  Lee YJ, Lee JM, Lee JS, Lee HY, Park BH, Kim YH, Han JK, Choi BI. Hepatocellular carcinoma: diagnostic performance of multidetector CT and MR imaging-a systematic review and meta-analysis. Radiology. 2015;275:97-109.  [PubMed]  [DOI]  [Cited in This Article: ]  [Cited by in Crossref: 292]  [Cited by in F6Publishing: 369]  [Article Influence: 36.9]  [Reference Citation Analysis (0)]
7.  Seale MK, Catalano OA, Saini S, Hahn PF, Sahani DV. Hepatobiliary-specific MR contrast agents: role in imaging the liver and biliary tree. Radiographics. 2009;29:1725-1748.  [PubMed]  [DOI]  [Cited in This Article: ]  [Cited by in Crossref: 299]  [Cited by in F6Publishing: 283]  [Article Influence: 18.9]  [Reference Citation Analysis (0)]
8.  Huppertz A, Haraida S, Kraus A, Zech CJ, Scheidler J, Breuer J, Helmberger TK, Reiser MF. Enhancement of focal liver lesions at gadoxetic acid-enhanced MR imaging: correlation with histopathologic findings and spiral CT--initial observations. Radiology. 2005;234:468-478.  [PubMed]  [DOI]  [Cited in This Article: ]
9.  Baek CK, Choi JY, Kim KA, Park MS, Lim JS, Chung YE, Kim MJ, Kim KW. Hepatocellular carcinoma in patients with chronic liver disease: a comparison of gadoxetic acid-enhanced MRI and multiphasic MDCT. Clin Radiol. 2012;67:148-156.  [PubMed]  [DOI]  [Cited in This Article: ]  [Cited by in Crossref: 53]  [Cited by in F6Publishing: 56]  [Article Influence: 4.0]  [Reference Citation Analysis (0)]
10.  Haradome H, Grazioli L, Tinti R, Morone M, Motosugi U, Sano K, Ichikawa T, Kwee TC, Colagrande S. Additional value of gadoxetic acid-DTPA-enhanced hepatobiliary phase MR imaging in the diagnosis of early-stage hepatocellular carcinoma: comparison with dynamic triple-phase multidetector CT imaging. J Magn Reson Imaging. 2011;34:69-78.  [PubMed]  [DOI]  [Cited in This Article: ]  [Cited by in Crossref: 90]  [Cited by in F6Publishing: 97]  [Article Influence: 6.9]  [Reference Citation Analysis (0)]
11.  Kim HJ, Lee SS, Byun JH, Kim JC, Yu CS, Park SH, Kim AY, Ha HK. Incremental value of liver MR imaging in patients with potentially curable colorectal hepatic metastasis detected at CT: a prospective comparison of diffusion-weighted imaging, gadoxetic acid-enhanced MR imaging, and a combination of both MR techniques. Radiology. 2015;274:712-722.  [PubMed]  [DOI]  [Cited in This Article: ]  [Cited by in Crossref: 90]  [Cited by in F6Publishing: 95]  [Article Influence: 8.6]  [Reference Citation Analysis (0)]
12.  Kitao A, Zen Y, Matsui O, Gabata T, Kobayashi S, Koda W, Kozaka K, Yoneda N, Yamashita T, Kaneko S. Hepatocellular carcinoma: signal intensity at gadoxetic acid-enhanced MR Imaging--correlation with molecular transporters and histopathologic features. Radiology. 2010;256:817-826.  [PubMed]  [DOI]  [Cited in This Article: ]  [Cited by in Crossref: 258]  [Cited by in F6Publishing: 275]  [Article Influence: 18.3]  [Reference Citation Analysis (0)]
13.  Kim JY, Kim MJ, Kim KA, Jeong HT, Park YN. Hyperintense HCC on hepatobiliary phase images of gadoxetic acid-enhanced MRI: correlation with clinical and pathological features. Eur J Radiol. 2012;81:3877-3882.  [PubMed]  [DOI]  [Cited in This Article: ]  [Cited by in Crossref: 49]  [Cited by in F6Publishing: 58]  [Article Influence: 4.5]  [Reference Citation Analysis (0)]
14.  Lee SA, Lee CH, Jung WY, Lee J, Choi JW, Kim KA, Park CM. Paradoxical high signal intensity of hepatocellular carcinoma in the hepatobiliary phase of Gd-EOB-DTPA enhanced MRI: initial experience. Magn Reson Imaging. 2011;29:83-90.  [PubMed]  [DOI]  [Cited in This Article: ]  [Cited by in Crossref: 38]  [Cited by in F6Publishing: 38]  [Article Influence: 2.5]  [Reference Citation Analysis (0)]
15.  Choi JY, Lee JM, Sirlin CB. CT and MR imaging diagnosis and staging of hepatocellular carcinoma: part II. Extracellular agents, hepatobiliary agents, and ancillary imaging features. Radiology. 2014;273:30-50.  [PubMed]  [DOI]  [Cited in This Article: ]  [Cited by in Crossref: 324]  [Cited by in F6Publishing: 372]  [Article Influence: 37.2]  [Reference Citation Analysis (0)]
16.  Ichikawa T, Federle MP, Grazioli L, Nalesnik M. Hepatocellular adenoma: multiphasic CT and histopathologic findings in 25 patients. Radiology. 2000;214:861-868.  [PubMed]  [DOI]  [Cited in This Article: ]
17.  Khan AS, Hussain HK, Johnson TD, Weadock WJ, Pelletier SJ, Marrero JA. Value of delayed hypointensity and delayed enhancing rim in magnetic resonance imaging diagnosis of small hepatocellular carcinoma in the cirrhotic liver. J Magn Reson Imaging. 2010;32:360-366.  [PubMed]  [DOI]  [Cited in This Article: ]  [Cited by in Crossref: 91]  [Cited by in F6Publishing: 94]  [Article Influence: 6.3]  [Reference Citation Analysis (0)]
18.  Goshima S, Kanematsu M, Matsuo M, Kondo H, Kato H, Yokoyama R, Hoshi H, Moriyama N. Nodule-in-nodule appearance of hepatocellular carcinomas: comparison of gadolinium-enhanced and ferumoxides-enhanced magnetic resonance imaging. J Magn Reson Imaging. 2004;20:250-255.  [PubMed]  [DOI]  [Cited in This Article: ]
19.  Parente DB, Perez RM, Eiras-Araujo A, Oliveira Neto JA, Marchiori E, Constantino CP, Amorim VB, Rodrigues RS. MR imaging of hypervascular lesions in the cirrhotic liver: a diagnostic dilemma. Radiographics. 2012;32:767-787.  [PubMed]  [DOI]  [Cited in This Article: ]  [Cited by in Crossref: 28]  [Cited by in F6Publishing: 29]  [Article Influence: 2.2]  [Reference Citation Analysis (0)]
20.  Choi JY, Lee JM, Sirlin CB. CT and MR imaging diagnosis and staging of hepatocellular carcinoma: part I. Development, growth, and spread: key pathologic and imaging aspects. Radiology. 2014;272:635-654.  [PubMed]  [DOI]  [Cited in This Article: ]  [Cited by in Crossref: 371]  [Cited by in F6Publishing: 334]  [Article Influence: 30.4]  [Reference Citation Analysis (1)]
21.  Park YN, Kim MJ. Hepatocarcinogenesis: imaging-pathologic correlation. Abdom Imaging. 2011;36:232-243.  [PubMed]  [DOI]  [Cited in This Article: ]  [Cited by in Crossref: 39]  [Cited by in F6Publishing: 28]  [Article Influence: 2.0]  [Reference Citation Analysis (0)]
22.  Yoneda N, Matsui O, Kitao A, Kita R, Kozaka K, Koda W, Kobayashi S, Gabata T, Ikeda H, Sato Y. Hepatocyte transporter expression in FNH and FNH-like nodule: correlation with signal intensity on gadoxetic acid enhanced magnetic resonance images. Jpn J Radiol. 2012;30:499-508.  [PubMed]  [DOI]  [Cited in This Article: ]  [Cited by in Crossref: 33]  [Cited by in F6Publishing: 37]  [Article Influence: 2.8]  [Reference Citation Analysis (0)]
23.  Lee YH, Kim SH, Cho MY, Shim KY, Kim MS. Focal nodular hyperplasia-like nodules in alcoholic liver cirrhosis: radiologic-pathologic correlation. AJR Am J Roentgenol. 2007;188:W459-W463.  [PubMed]  [DOI]  [Cited in This Article: ]
24.  Kobayashi S, Matsui O, Kamura T, Yamamoto S, Yoneda N, Gabata T, Terayama N, Sanada J. Imaging of benign hypervascular hepatocellular nodules in alcoholic liver cirrhosis: differentiation from hypervascular hepatocellular carcinoma. J Comput Assist Tomogr. 2007;31:557-563.  [PubMed]  [DOI]  [Cited in This Article: ]
25.  Kim JW, Lee CH, Park YS, Lee J, Choi JW, Kim KA, Park CM.  Can we differentiate hepatocellular carcinoma with paradoxical uptake on hepatobiliary phase from focal nodule hyperplasia or FNH-like nodule in Gd-EOB-DTPA-enhanced MR imaging? Proceedings of the 100th Radiological Society of North America Conference; 2014 Nov 30-Dec 05. Chicago, USA: Radiological Society of North America Conference 2014; .  [PubMed]  [DOI]  [Cited in This Article: ]
26.  Hartleb M, Gutkowski K, Milkiewicz P. Nodular regenerative hyperplasia: evolving concepts on underdiagnosed cause of portal hypertension. World J Gastroenterol. 2011;17:1400-1409.  [PubMed]  [DOI]  [Cited in This Article: ]  [Cited by in CrossRef: 128]  [Cited by in F6Publishing: 105]  [Article Influence: 7.5]  [Reference Citation Analysis (0)]
27.  Morana G, Grazioli L, Kirchin MA, Bondioni MP, Faccioli N, Guarise A, Schneider G. Solid hypervascular liver lesions: accurate identification of true benign lesions on enhanced dynamic and hepatobiliary phase magnetic resonance imaging after gadobenate dimeglumine administration. Invest Radiol. 2011;46:225-239.  [PubMed]  [DOI]  [Cited in This Article: ]  [Cited by in Crossref: 66]  [Cited by in F6Publishing: 71]  [Article Influence: 5.1]  [Reference Citation Analysis (0)]
28.  Kozaka K, Matsui O, Kobayashi S, Sanada J, Koda W, Minami T, Kitao A, Inoue D, Yoneda N, Yoshida K, Gabata T.  O25-5; Unclassified hepatocellular nodule in the cirrhosis: A nodule with doughnut-like appearance on hepatobiliary phase of Gd-EOB-DTPA enhanced MRI and portal venous supply: A retrospective study - its prevalence, prognosis and pathology. Proceedings of the 15th Asian Oceanian Congress of Radiology; 2014 Sep 24-28. Kobe, Japan: Asian Oceanian Congress of Radiology 2014; .  [PubMed]  [DOI]  [Cited in This Article: ]
29.  Péporté AR, Sommer WH, Nikolaou K, Reiser MF, Zech CJ. Imaging features of intrahepatic cholangiocarcinoma in Gd-EOB-DTPA-enhanced MRI. Eur J Radiol. 2013;82:e101-e106.  [PubMed]  [DOI]  [Cited in This Article: ]  [Cited by in Crossref: 50]  [Cited by in F6Publishing: 51]  [Article Influence: 3.9]  [Reference Citation Analysis (0)]
30.  Kang Y, Lee JM, Kim SH, Han JK, Choi BI. Intrahepatic mass-forming cholangiocarcinoma: enhancement patterns on gadoxetic acid-enhanced MR images. Radiology. 2012;264:751-760.  [PubMed]  [DOI]  [Cited in This Article: ]  [Cited by in Crossref: 127]  [Cited by in F6Publishing: 137]  [Article Influence: 10.5]  [Reference Citation Analysis (0)]
31.  Kim SH, Lee CH, Kim BH, Kim WB, Yeom SK, Kim KA, Park CM. Typical and atypical imaging findings of intrahepatic cholangiocarcinoma using gadolinium ethoxybenzyl diethylenetriamine pentaacetic acid-enhanced magnetic resonance imaging. J Comput Assist Tomogr. 2012;36:704-709.  [PubMed]  [DOI]  [Cited in This Article: ]  [Cited by in Crossref: 51]  [Cited by in F6Publishing: 54]  [Article Influence: 4.5]  [Reference Citation Analysis (0)]
32.  El-Serag HB, Engels EA, Landgren O, Chiao E, Henderson L, Amaratunge HC, Giordano TP. Risk of hepatobiliary and pancreatic cancers after hepatitis C virus infection: A population-based study of U.S. veterans. Hepatology. 2009;49:116-123.  [PubMed]  [DOI]  [Cited in This Article: ]  [Cited by in Crossref: 199]  [Cited by in F6Publishing: 210]  [Article Influence: 13.1]  [Reference Citation Analysis (0)]
33.  Chong YS, Kim YK, Lee MW, Kim SH, Lee WJ, Rhim HC, Lee SJ. Differentiating mass-forming intrahepatic cholangiocarcinoma from atypical hepatocellular carcinoma using gadoxetic acid-enhanced MRI. Clin Radiol. 2012;67:766-773.  [PubMed]  [DOI]  [Cited in This Article: ]  [Cited by in Crossref: 76]  [Cited by in F6Publishing: 81]  [Article Influence: 6.2]  [Reference Citation Analysis (0)]
34.  Zech CJ, Grazioli L, Breuer J, Reiser MF, Schoenberg SO. Diagnostic performance and description of morphological features of focal nodular hyperplasia in Gd-EOB-DTPA-enhanced liver magnetic resonance imaging: results of a multicenter trial. Invest Radiol. 2008;43:504-511.  [PubMed]  [DOI]  [Cited in This Article: ]  [Cited by in Crossref: 179]  [Cited by in F6Publishing: 189]  [Article Influence: 11.1]  [Reference Citation Analysis (0)]
35.  Grazioli L, Bondioni MP, Haradome H, Motosugi U, Tinti R, Frittoli B, Gambarini S, Donato F, Colagrande S. Hepatocellular adenoma and focal nodular hyperplasia: value of gadoxetic acid-enhanced MR imaging in differential diagnosis. Radiology. 2012;262:520-529.  [PubMed]  [DOI]  [Cited in This Article: ]  [Cited by in Crossref: 214]  [Cited by in F6Publishing: 200]  [Article Influence: 15.4]  [Reference Citation Analysis (0)]
36.  van Kessel CS, de Boer E, ten Kate FJ, Brosens LA, Veldhuis WB, van Leeuwen MS. Focal nodular hyperplasia: hepatobiliary enhancement patterns on gadoxetic-acid contrast-enhanced MRI. Abdom Imaging. 2013;38:490-501.  [PubMed]  [DOI]  [Cited in This Article: ]  [Cited by in Crossref: 36]  [Cited by in F6Publishing: 37]  [Article Influence: 3.4]  [Reference Citation Analysis (0)]
37.  Suh CH, Kim KW, Kim GY, Shin YM, Kim PN, Park SH. The diagnostic value of Gd-EOB-DTPA-MRI for the diagnosis of focal nodular hyperplasia: a systematic review and meta-analysis. Eur Radiol. 2015;25:950-960.  [PubMed]  [DOI]  [Cited in This Article: ]  [Cited by in Crossref: 52]  [Cited by in F6Publishing: 43]  [Article Influence: 3.9]  [Reference Citation Analysis (0)]
38.  Purysko AS, Remer EM, Coppa CP, Obuchowski NA, Schneider E, Veniero JC. Characteristics and distinguishing features of hepatocellular adenoma and focal nodular hyperplasia on gadoxetate disodium-enhanced MRI. AJR Am J Roentgenol. 2012;198:115-123.  [PubMed]  [DOI]  [Cited in This Article: ]  [Cited by in Crossref: 67]  [Cited by in F6Publishing: 72]  [Article Influence: 5.5]  [Reference Citation Analysis (0)]
39.  Grieser C, Steffen IG, Kramme IB, Bläker H, Kilic E, Perez Fernandez CM, Seehofer D, Schott E, Hamm B, Denecke T. Gadoxetic acid enhanced MRI for differentiation of FNH and HCA: a single centre experience. Eur Radiol. 2014;24:1339-1348.  [PubMed]  [DOI]  [Cited in This Article: ]
40.  Grazioli L, Morana G, Federle MP, Brancatelli G, Testoni M, Kirchin MA, Menni K, Olivetti L, Nicoli N, Procacci C. Focal nodular hyperplasia: morphologic and functional information from MR imaging with gadobenate dimeglumine. Radiology. 2001;221:731-739.  [PubMed]  [DOI]  [Cited in This Article: ]
41.  Karam AR, Shankar S, Surapaneni P, Kim YH, Hussain S. Focal nodular hyperplasia: central scar enhancement pattern using Gadoxetate Disodium. J Magn Reson Imaging. 2010;32:341-344.  [PubMed]  [DOI]  [Cited in This Article: ]  [Cited by in Crossref: 34]  [Cited by in F6Publishing: 36]  [Article Influence: 2.4]  [Reference Citation Analysis (0)]
42.  Bioulac-Sage P, Blanc JF, Rebouissou S, Balabaud C, Zucman-Rossi J. Genotype phenotype classification of hepatocellular adenoma. World J Gastroenterol. 2007;13:2649-2654.  [PubMed]  [DOI]  [Cited in This Article: ]  [Cited by in CrossRef: 73]  [Cited by in F6Publishing: 56]  [Article Influence: 3.1]  [Reference Citation Analysis (0)]
43.  van Aalten SM, Thomeer MG, Terkivatan T, Dwarkasing RS, Verheij J, de Man RA, Ijzermans JN. Hepatocellular adenomas: correlation of MR imaging findings with pathologic subtype classification. Radiology. 2011;261:172-181.  [PubMed]  [DOI]  [Cited in This Article: ]  [Cited by in Crossref: 166]  [Cited by in F6Publishing: 151]  [Article Influence: 10.8]  [Reference Citation Analysis (0)]
44.  Laumonier H, Bioulac-Sage P, Laurent C, Zucman-Rossi J, Balabaud C, Trillaud H. Hepatocellular adenomas: magnetic resonance imaging features as a function of molecular pathological classification. Hepatology. 2008;48:808-818.  [PubMed]  [DOI]  [Cited in This Article: ]  [Cited by in Crossref: 244]  [Cited by in F6Publishing: 194]  [Article Influence: 11.4]  [Reference Citation Analysis (0)]
45.  Ronot M, Bahrami S, Calderaro J, Valla DC, Bedossa P, Belghiti J, Vilgrain V, Paradis V. Hepatocellular adenomas: accuracy of magnetic resonance imaging and liver biopsy in subtype classification. Hepatology. 2011;53:1182-1191.  [PubMed]  [DOI]  [Cited in This Article: ]  [Cited by in Crossref: 167]  [Cited by in F6Publishing: 169]  [Article Influence: 12.1]  [Reference Citation Analysis (0)]
46.  Agarwal S, Fuentes-Orrego JM, Arnason T, Misdraji J, Jhaveri KS, Harisinghani M, Hahn PF. Inflammatory hepatocellular adenomas can mimic focal nodular hyperplasia on gadoxetic acid-enhanced MRI. AJR Am J Roentgenol. 2014;203:W408-W414.  [PubMed]  [DOI]  [Cited in This Article: ]  [Cited by in Crossref: 54]  [Cited by in F6Publishing: 56]  [Article Influence: 5.1]  [Reference Citation Analysis (0)]
47.  Arrivé L, Fléjou JF, Vilgrain V, Belghiti J, Najmark D, Zins M, Menu Y, Tubiana JM, Nahum H. Hepatic adenoma: MR findings in 51 pathologically proved lesions. Radiology. 1994;193:507-512.  [PubMed]  [DOI]  [Cited in This Article: ]
48.  Kojiro M. Histopathology of liver cancers. Best Pract Res Clin Gastroenterol. 2005;19:39-62.  [PubMed]  [DOI]  [Cited in This Article: ]
49.  Vilgrain V, Boulos L, Vullierme MP, Denys A, Terris B, Menu Y. Imaging of atypical hemangiomas of the liver with pathologic correlation. Radiographics. 2000;20:379-397.  [PubMed]  [DOI]  [Cited in This Article: ]
50.  Tamada T, Ito K, Yamamoto A, Sone T, Kanki A, Tanaka F, Higashi H. Hepatic hemangiomas: evaluation of enhancement patterns at dynamic MRI with gadoxetate disodium. AJR Am J Roentgenol. 2011;196:824-830.  [PubMed]  [DOI]  [Cited in This Article: ]  [Cited by in Crossref: 39]  [Cited by in F6Publishing: 38]  [Article Influence: 2.7]  [Reference Citation Analysis (0)]
51.  Doo KW, Lee CH, Choi JW, Lee J, Kim KA, Park CM. „Pseudo washout” sign in high-flow hepatic hemangioma on gadoxetic acid contrast-enhanced MRI mimicking hypervascular tumor. AJR Am J Roentgenol. 2009;193:W490-W496.  [PubMed]  [DOI]  [Cited in This Article: ]  [Cited by in Crossref: 111]  [Cited by in F6Publishing: 111]  [Article Influence: 7.4]  [Reference Citation Analysis (0)]
52.  Nam SJ, Park KY, Yu JS, Chung JJ, Kim JH, Kim KW. Hepatic cavernous hemangiomas: relationship between speed of intratumoral enhancement during dynamic MRI and apparent diffusion coefficient on diffusion-weighted imaging. Korean J Radiol. 2012;13:728-735.  [PubMed]  [DOI]  [Cited in This Article: ]  [Cited by in Crossref: 10]  [Cited by in F6Publishing: 11]  [Article Influence: 0.8]  [Reference Citation Analysis (0)]
53.  Xu PJ, Shan Y, Yan FH, Ji Y, Ding Y, Zhou ML. Epithelioid angiomyolipoma of the liver: cross-sectional imaging findings of 10 immunohistochemically-verified cases. World J Gastroenterol. 2009;15:4576-4581.  [PubMed]  [DOI]  [Cited in This Article: ]  [Cited by in CrossRef: 34]  [Cited by in F6Publishing: 31]  [Article Influence: 1.9]  [Reference Citation Analysis (0)]
54.  Yan F, Zeng M, Zhou K, Shi W, Zheng W, Da R, Fan J, Ji Y. Hepatic angiomyolipoma: various appearances on two-phase contrast scanning of spiral CT. Eur J Radiol. 2002;41:12-18.  [PubMed]  [DOI]  [Cited in This Article: ]
55.  Wang SY, Kuai XP, Meng XX, Jia NY, Dong H. Comparison of MRI features for the differentiation of hepatic angiomyolipoma from fat-containing hepatocellular carcinoma. Abdom Imaging. 2014;39:323-333.  [PubMed]  [DOI]  [Cited in This Article: ]  [Cited by in Crossref: 21]  [Cited by in F6Publishing: 23]  [Article Influence: 2.1]  [Reference Citation Analysis (0)]
56.  Kim R, Lee JM, Joo I, Lee DH, Woo S, Han JK, Choi BI. Differentiation of lipid poor angiomyolipoma from hepatocellular carcinoma on gadoxetic acid-enhanced liver MR imaging. Abdom Imaging. 2015;40:531-541.  [PubMed]  [DOI]  [Cited in This Article: ]  [Cited by in Crossref: 24]  [Cited by in F6Publishing: 25]  [Article Influence: 2.5]  [Reference Citation Analysis (0)]
57.  Yoo SY, Han JK, Kim YH, Kim TK, Choi BI, Han MC. Focal eosinophilic infiltration in the liver: radiologic findings and clinical course. Abdom Imaging. 2003;28:326-332.  [PubMed]  [DOI]  [Cited in This Article: ]
58.  Kim YK, Lee YH, Kim CS, Lee MW. Differentiating focal eosinophilic liver disease from hepatic metastases using unenhanced and gadoxetic acid-enhanced MRI. Abdom Imaging. 2011;36:425-432.  [PubMed]  [DOI]  [Cited in This Article: ]  [Cited by in Crossref: 6]  [Cited by in F6Publishing: 6]  [Article Influence: 0.4]  [Reference Citation Analysis (0)]
59.  Lee MH, Kim SH, Kim H, Lee MW, Lee WJ. Differentiating focal eosinophilic infiltration from metastasis in the liver with gadoxetic acid-enhanced magnetic resonance imaging. Korean J Radiol. 2011;12:439-449.  [PubMed]  [DOI]  [Cited in This Article: ]  [Cited by in Crossref: 17]  [Cited by in F6Publishing: 17]  [Article Influence: 1.2]  [Reference Citation Analysis (0)]
60.  Byun JH, Yang DH, Yoon SE, Won HJ, Shin YM, Jeong YY, Jang SJ. Contrast-enhancing hepatic eosinophilic abscess during the hepatic arterial phase: a mimic of hepatocellular carcinoma. AJR Am J Roentgenol. 2006;186:168-173.  [PubMed]  [DOI]  [Cited in This Article: ]
61.  Lee J, Park CM, Kim KA, Lee CH, Choi JW. MR findings of focal eosinophilic liver disease using gadoxetic acid. Magn Reson Imaging. 2010;28:1327-1334.  [PubMed]  [DOI]  [Cited in This Article: ]
62.  Ahn SJ, Choi JY, Kim KA, Kim MJ, Baek SE, Kim JH, Song HT. Focal eosinophilic infiltration of the liver: gadoxetic acid-enhanced magnetic resonance imaging and diffusion-weighted imaging. J Comput Assist Tomogr. 2011;35:81-85.  [PubMed]  [DOI]  [Cited in This Article: ]  [Cited by in Crossref: 11]  [Cited by in F6Publishing: 12]  [Article Influence: 0.9]  [Reference Citation Analysis (0)]
63.  Hwang SH, Yu JS, Kim KW, Kim JH, Chung JJ. Small hypervascular enhancing lesions on arterial phase images of multiphase dynamic computed tomography in cirrhotic liver: fate and implications. J Comput Assist Tomogr. 2008;32:39-45.  [PubMed]  [DOI]  [Cited in This Article: ]  [Cited by in Crossref: 34]  [Cited by in F6Publishing: 35]  [Article Influence: 2.1]  [Reference Citation Analysis (0)]
64.  Motosugi U, Ichikawa T, Sou H, Sano K, Tominaga L, Muhi A, Araki T. Distinguishing hypervascular pseudolesions of the liver from hypervascular hepatocellular carcinomas with gadoxetic acid-enhanced MR imaging. Radiology. 2010;256:151-158.  [PubMed]  [DOI]  [Cited in This Article: ]  [Cited by in Crossref: 152]  [Cited by in F6Publishing: 152]  [Article Influence: 10.1]  [Reference Citation Analysis (0)]
65.  Sun HY, Lee JM, Shin CI, Lee DH, Moon SK, Kim KW, Han JK, Choi BI. Gadoxetic acid-enhanced magnetic resonance imaging for differentiating small hepatocellular carcinomas (& lt; or =2 cm in diameter) from arterial enhancing pseudolesions: special emphasis on hepatobiliary phase imaging. Invest Radiol. 2010;45:96-103.  [PubMed]  [DOI]  [Cited in This Article: ]  [Cited by in Crossref: 181]  [Cited by in F6Publishing: 181]  [Article Influence: 12.1]  [Reference Citation Analysis (0)]
66.  Kanematsu M, Kondo H, Goshima S, Kato H, Tsuge U, Hirose Y, Kim MJ, Moriyama N. Imaging liver metastases: review and update. Eur J Radiol. 2006;58:217-228.  [PubMed]  [DOI]  [Cited in This Article: ]
67.  Ha S, Lee CH, Kim BH, Park YS, Lee J, Choi JW, Kim KA, Park CM. Paradoxical uptake of Gd-EOB-DTPA on the hepatobiliary phase in the evaluation of hepatic metastasis from breast cancer: is the “target sign” a common finding? Magn Reson Imaging. 2012;30:1083-1090.  [PubMed]  [DOI]  [Cited in This Article: ]  [Cited by in Crossref: 29]  [Cited by in F6Publishing: 27]  [Article Influence: 2.1]  [Reference Citation Analysis (0)]
68.  Kim A, Lee CH, Kim BH, Lee J, Choi JW, Park YS, Kim KA, Park CM. Gadoxetic acid-enhanced 3.0T MRI for the evaluation of hepatic metastasis from colorectal cancer: metastasis is not always seen as a “defect” on the hepatobiliary phase. Eur J Radiol. 2012;81:3998-4004.  [PubMed]  [DOI]  [Cited in This Article: ]  [Cited by in Crossref: 23]  [Cited by in F6Publishing: 23]  [Article Influence: 1.8]  [Reference Citation Analysis (0)]