INTRODUCTION
Colorectal cancer is the third leading cause of cancer and the fourth leading cause of cancer-related deaths worldwide[1,2]. Morbidity and mortality from colorectal cancer are increasing with continuing urbanization of the population. Apart from genetic causes, life and environmental factors determine the relative risk of the occurrence and development of colon cancer. Although the diagnostics for colon cancer have greatly improved, the molecular mechanisms of the disease are poorly understood[3,4]. Treatments for colon cancer include surgery, chemotherapy, and radiotherapy, or a combination of these treatments[5]. Chemotherapy is an effective treatment for colon cancer, but traditional chemotherapy has many serious side effects, including significant pain. At present, approximately half of the patients with a primary tumor can be cured by surgery, depending on the tumor location[6].
Gambogic acid (GA) is the major active ingredient in gamboge, which is extracted from various Garcinia species, including Garcinia hanburyi Hook f. (Tenghuang)[7]. GA has various biologic activities, such as anti-pyretic, analgesic, anti-inflammatory[7], autophagic[8] and anti-tumor activities[8-10]. Some research studies have shown that GA can inhibit the growth of many tumor cells both in vitro and in vivo, including cells in lung cancer[11,12], liver cancer[13,14], breast cancer[15-17], gastric cancer[18,19], pancreatic cancer[20], leukemia[21-23], melanoma[24], and glioblastoma[25]. GA is currently being investigated in clinical trials in China[25-27]. However, the effect of GA on the growth of human colon cancer cells remains unclear.
Apoptosis is the most important pathway for the anti-tumor effects of many compounds. GA has been shown to induce apoptosis by increasing nuclear condensation and DNA fragmentation[28,29], elevating levels of Bax and decreasing levels of Bcl-2[29,30], activating caspase-8, -9 and -3[31-33], suppressing NF-κB[33,34], and inhibiting matrix metalloproteinase-2 and -9[35] both in vitro and in vivo[22,36]. The aim of this study was to investigate the potential anti-cancer effects of GA on human colon cancer cells and identify the related molecular mechanisms.
MATERIALS AND METHODS
Chemicals and reagents
GA and 3-(4,5-dimethylthiazol-2-yl)-2,5-diphenyltetrazolium bromide (MTT) were purchased from Sigma-Aldrich (St. Louis, MO, United States). Terminal deoxynucleotidyl transferase dUTP nick end labeling (TUNEL) and Hoechst 33342 staining kits were obtained from Beyotime Institute of Biotechnology (Haimen, China). Annexin V/propidium iodide (PI) was purchased from Biosea (Beijing, China). Real-time (RT)-PCR primers were purchased from Genscript Corp. (Piscataway, NJ, United States). M-MLV reverse transcriptase and reagents for RT-PCR were purchased from Promega Corp. (Madison, WI, United States). Antibodies against Fas, Fas ligand (FasL), Fas-associated with death domain protein (FADD), caspase-8, cytochrome c, apoptotic protease activating factor (Apaf)-1, caspase-9, caspase-3, GAPDH, and β-actin were obtained from Cell Signaling Technology Inc. (Danvers, MA, United States). Trizol and fluorescence-conjugated secondary antibodies were obtained from Invitrogen (of Thermo Fisher Scientific, Waltham, MA, United States). Other chemicals were purchased at the highest purity grade.
Cell culture
Human colon cancer cell line HT-29 was purchased from American Type Culture Collection (Manassas, VA, United States). The cells were cultured in complete RPMI-1640 medium (Hyclone of GE Healthcare, Little Chalfont, Buckinghamshire, United Kingdom) supplemented with 10% heat-inactivated bovine serum (Gibco of Thermo Fisher Scientific, Waltham, MA, United States), 100 U/mL penicillin, and 100 μg/mL streptomycin at 37 °C with 5% CO2 in a humidified atmosphere.
MTT assay of cell proliferation
HT-29 cells were seeded into a 96-well culture plate at 5000 cells/well for 16 h for attachment. The cells were then treated with GA (0.00, 0.31, 0.62, 1.25, 2.50 5.00, or 10.00 μmol/L) for 24, 48 or 72 h. MTT dye was added to each well at 37 °C and incubated for 4 h. The supernatant was then removed and the purple-colored formazan precipitates were dissolved in 150 μL of dimethyl sulfoxide and absorbance at 490 nm was measured on a multi-well plate reader. The background absorbance (medium without the cells) was subtracted. Percent viability was calculated using the formula: [(drug-treated group/control group) × 100]. Each assay was repeated three times, and the final results are expressed as mean ± SE.
Apoptotic cell detection by TUNEL and Hoechst 33342 staining
For TUNEL staining, HT-29 cells were incubated with GA (0.00, 1.25, 2.50 or 5.00 μmol/L) for 48 h in 96-well plates; the attached cells were then washed with PBS and fixed in freshly prepared 4% formaldehyde for 30 min. The cells were then washed twice with PBS and incubated with digoxigenin-conjugated dUTP in a terminal deoxynucleotidyl transferase-catalyzed reaction for 1 h at 37 °C in a humidified atmosphere. After the cells were immersed in stop/wash buffer for 10 min at room temperature and washed with PBS, they were incubated with anti-digoxigenin antibody-conjugated peroxidase for 30 min. Apoptotic cells with condensed and fragmented nuclei were stained brown after incubation with 3, 3′-diaminobenzidine for 5 min.
For Hoechst 33342 staining, HT-29 cells cultured on glass coverslips in 6-well plates were treated and fixed as described above. After rinsing twice with PBS, the cells were incubated in Hoechst 33342 staining solution for 5 min. Cells were washed twice with PBS and mounted using an antifade mounting medium. Apoptosis was detected by fluorescence microscopy.
Cellular ultrastructure analysis by transmission electron microscopy
HT-29 cells were incubated for 48 h with 0.0 or 2.5 μmol/L GA, harvested with trypsin, centrifuged, and washed with PBS. Cell samples were fixed in 2.5% (v/v) glutaraldehyde in 0.1 mol/L phosphate buffer (pH 7.4), post-fixed in 2% (w/v) buffered osmium tetroxide for 2 h, and dehydrated in ethanol. Specimens were embedded in Epon (Sigma-Aldrich), and thin sections were cut using an ultramicrotome and double stained with uranyl acetate and lead citrate.
Apoptosis quantification by flow cytometry
After incubation with GA (0.00, 1.25, 2.50 or 5.00 μmol/L) for 48 h, HT-29 cells were collected with trypsin, centrifuged, washed with PBS, stained with Annexin V-FITC and propidium iodide (PI) according to the manufacturer’s protocol, and then analyzed using a FACScan flow cytometer (Becton, Dickinson and Company, Franklin Lakes, NJ, United States). Quantification was conducted from histogram plots, where early apoptotic cells stained with Annexin V-FITC are presented in the lower right quadrant and late apoptotic cells stained with both Annexin V-FITC and PI are presented in the upper right quadrant.
RNA isolation and quantitative RT-PCR analysis
Total RNA was extracted using Trizol and the concentration and purity were determined by measuring the optical density. RNA from each sample (1 μg) was used to generate cDNA using M-MLV reverse transcriptase according to manufacturer’s specifications. After an initial denaturation step at 95 °C for 10 min using SYBR Green PCR Master Mix (Applied Biosystems of Thermo Fisher Scientific, Waltham, MA, United States), RT-PCR was cycled between 95 °C for 15 s and 60 °C for 1 min for 40 cycles. Amplification was performed using a 7500 Fast Real-Time PCR System (Applied Biosystems) and products were routinely checked using dissociation curve software. Transcript quantities were compared by the relative Ct method, and the amounts of caspase-8, -9 and -3 were normalized to the endogenous control (GAPDH). The relative value to the control sample was given by 2-∆∆CT. RT-PCR primer sequences were as follows: caspase-8, (forward) 5′-GCCTCCCTCAAGTTCCT-3′, (reverse) 5′-CCTGGAGTCTCTGGAATAACA-3′; caspase-9, (forward) 5′-CGAACTAACAGGCAAGCAGC-3′, (reverse) 5′-ACCTCACCAAATCCTCCAGAAC-3′; caspase-3, (forward) 5′-TGGTTCATCCAGTCGCTTTG-3′, (reverse) 5′-CATTCTGTTGCCACCTTTCG-3′.
Western blot analysis
Following treatment with GA (0.00, 1.25, 2.50 or 5.00 μmol/L) for 48 h, HT-29 cells were washed twice with ice-cold PBS and collected in lysis buffer. The supernatant was collected by centrifuging at 13500 rpm for 20 min. Total protein concentration was quantified using a Bradford assay, and 120 μg of protein from each sample was separated on 10%, 12%, and 15% SDS-PAGE gels, and transferred onto nitrocellulose membranes. The nitrocellulose membranes were blocked with 5% non-fat milk powder (w/v) at room temperature for 2 h, then incubated with a primary antibody against Fas (1:500), FasL (1:500), FADD (1:500), caspase-8 (1:500), cytochrome c (1:500), Apaf-1 (1:500), caspase-9 (1:500), caspase-3 (1:500), GAPDH (1:1000), or β-actin (1:500), at 4 °C overnight. After washing, the membranes were incubated with fluorescence-conjugated secondary antibody (1:10000 anti-rabbit or anti-mouse; Invitrogen) at room temperature for 50 min. β-actin was used as an internal control to monitor protein loading and transfer of proteins from the gel to the membrane. Western blot bands were quantified using the Odyssey infrared imaging system (LI-COR Biosciences, Lincoln, NE, United States). All results are representative of three independent experiments.
Xenograft assays in nude mice
Five-week-old BALB/c nude mice (n = 30) used for in vivo experiments were purchased from Vital River Laboratories (Beijing, China). The animal experimental protocol was approved by the ethics committee of Heilongjiang Province’s Hospital (protocol number: 2008-010). The mice were housed in independent venting cases in a specific-pathogen free animal facility, with 6 mice in each case. The room temperature was keep at 20-25 °C, humidity at 40%-70%, with a 12 h/12 h light/dark cycle. All animal procedures were in accordance with the Animal Research: Reporting of In Vivo Experiment guidelines. HT-29 cells (2 × 10⁶ cells/mouse) were implanted by subcutaneous injection into the right armpit of the mice. When well-established HT-29 xenografts were palpable with a tumor size of 75 mm3, mice were randomized into control and treatment groups, each containing 6 animals. All animals were checked twice a day. The animals in the GA group received caudal vein injections of GA (in saline; 5, 10 or 20 mg/kg) twice weekly for four weeks, whereas animals in negative and positive groups were given injections of the same volume of 0.9% saline and 10 mg/kg docetaxel, respectively, once weekly (0.1 mL/10 g).
All animals were weighed twice weekly, and mortality was monitored during the experimental period to assess toxicity of the treatments. Tumor volume was also measured twice weekly and calculated as: 0.5 × ab2[24,37], where a and b refer to the longer and shorter dimensions, respectively. Relative tumor volume (RTV) was calculated according to the equation: Vt/V0, where V0 is the tumor volume and Vt is the tumor volume on day t. At the end of the experiment, all mice were euthanized and the subcutaneous tumors were weighed. The inhibition ratio of tumor weight (IRTW) was calculated as: [(tumor weight of treatment group/tumor weight of saline group) × 100]. There were no animal deaths during the experiment and all tumor-implanted animals were humanely euthanized at the end of the experiment by overdose of pentobarbital (50 mg/kg; ip). The criteria for the humane endpoint were a tumor size > 20 mm in diameter with its weight more than 10% of the animal’s body weight and/or the presence of ulceration, necrosis, or infection.
Statistical analysis
All statistical analyses were performed using SPSS software (Chicago, IL, United States). One-way analysis of variance (ANOVA) was used for comparison among groups, and two-way ANOVA was used for comparing two independent variables among groups followed by a Tukey’s post hoc test. Data are shown as mean ± SE; P < 0.05 was considered to be significant.
RESULTS
GA-induced morphologic changes and anti-proliferation of HT-29 cells
HT-29 cellular morphology was observed and examined under a phase contrast microscope. Control cells showed a normal morphology with typical polygonal and cobblestone monolayer appearance, plump cell body, clear cell boundary, and transparent cytoplasm (data not shown). In the presence of GA, HT-29 cells appeared round with small wrinkles and broken debris, suggesting GA-induced toxicity.
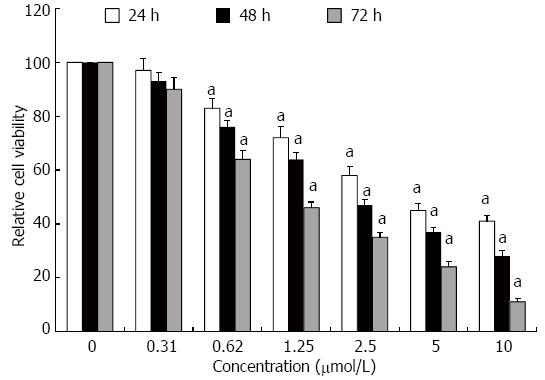
Proliferation of HT-29 cells was assessed using the MTT assay (Figure 1). GA inhibited proliferation of HT-29 cells in a dose- and time-dependent manner, which was significant for concentrations of GA ≥ 0.62 μmol/L at all times points (P < 0.05).
Figure 1 Gambogic acid-induced anti-proliferation of HT-29 cells.
Relative cell viability (%) was evaluated by MTT assay after treatment for 24, 48 and 72 h. All data were normalized to 0 μmol/L, which was considered as 100%. aP < 0.05 vs 0 μmol/L.
GA-induced apoptosis of HT-29 cells
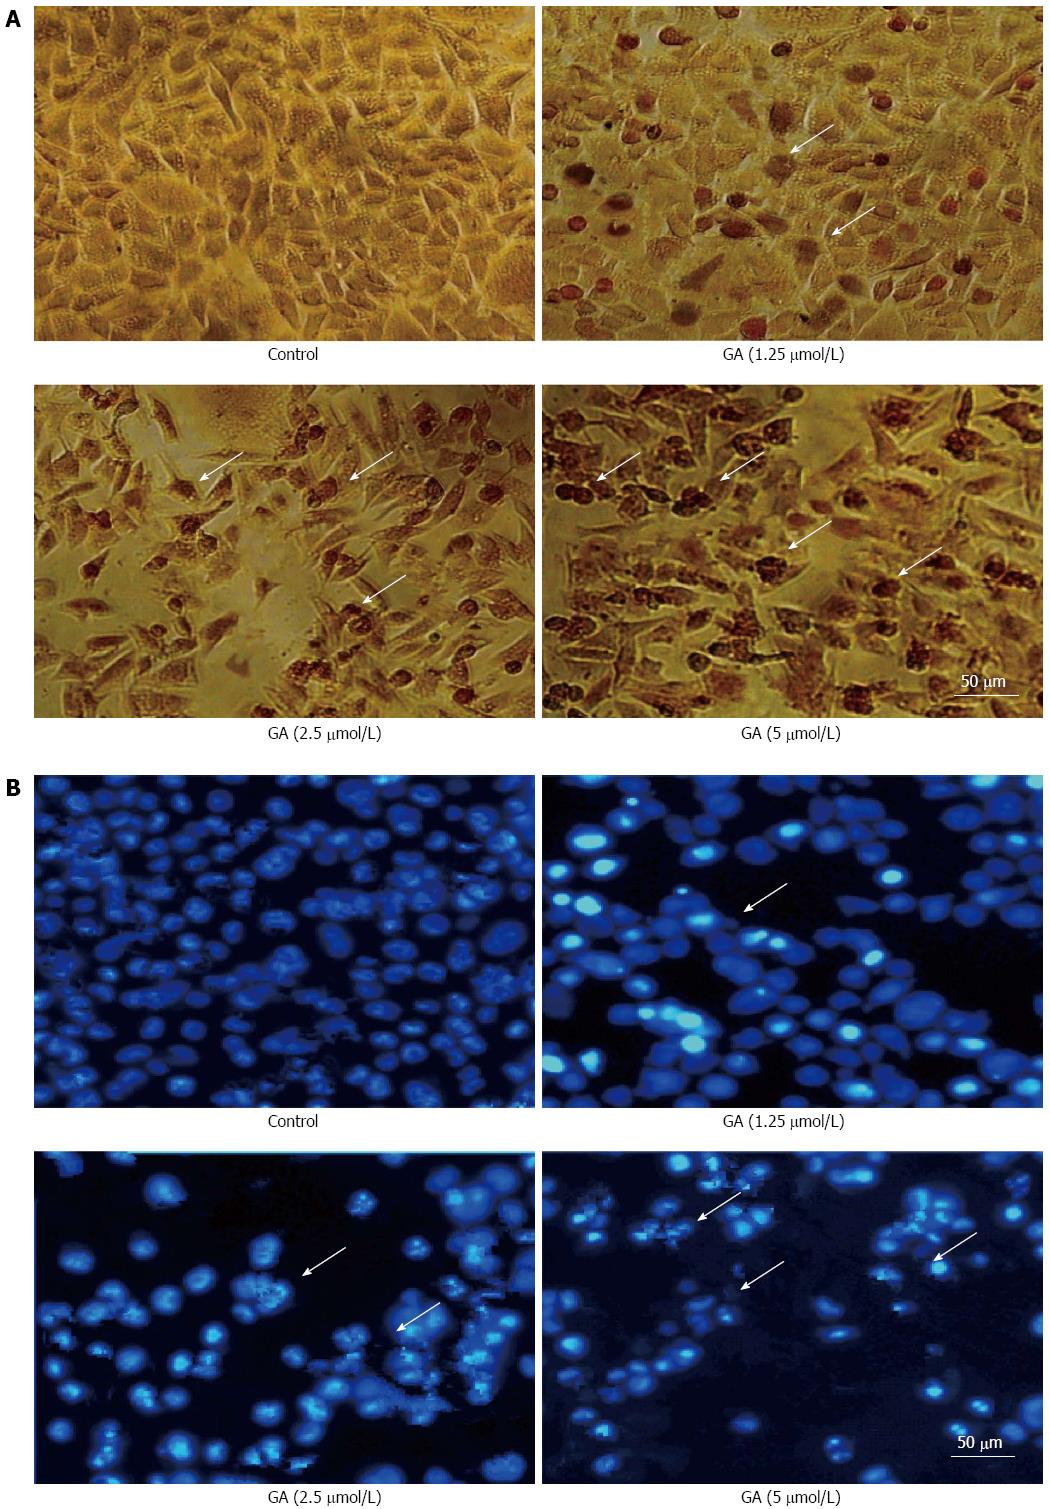
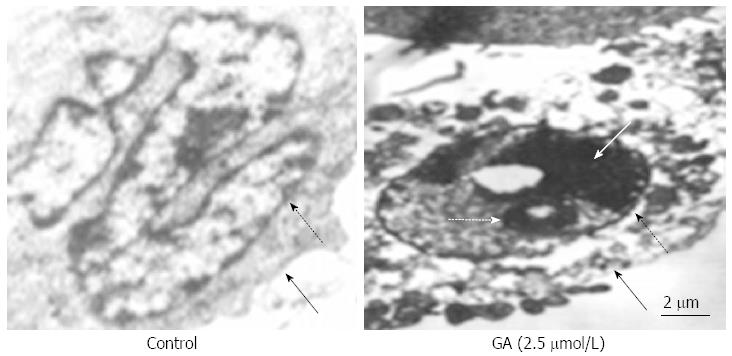
Treatment of GT-29 cells with GA induced apoptosis as observed by TUNEL (Figure 2A) and Hoechst 33342 (Figure 2B) staining. Apoptotic HT-29 cells displayed round and shrunken cell bodies with condensed and fragmented nuclei. Transmission electron microscopy investigation revealed that HT-29 cells treated for 48 h with 2.5 μmol/L GA showed an abnormal subcellular morphology (Figure 3). The nuclear/cytoplasmic ratio was decreased, cells and nucleoli were shrunken, microvilli appeared on the cell membrane surface, apoptotic bodies appeared around the nuclear membrane, the nucleus was condensed and fragmented, the electron density deepened, and vacuolization in the cytoplasm became obvious.
Figure 2 Gambogic acid-induced apoptosis.
Apoptotic HT-29 cells (arrows) were observed by A: Terminal deoxynucleotidyl transferase dUTP nick end labeling; and B: Hoechst 33342 staining after treatment with gambogic acid (GA) for 48 h.
Figure 3 Ultrastructure of HT-29 cells.
Transmission electron microscopy revealed ultrastructural changes in HT-29 cells after treatment with 2.5 μmol/L gambogic acid (GA) for 48 h; dashed black arrow shows the nuclear membrane; black arrow shows the cellular membrane; dashed white arrow shows the apoptotic body; and the white arrow shows the condensed nucleus.
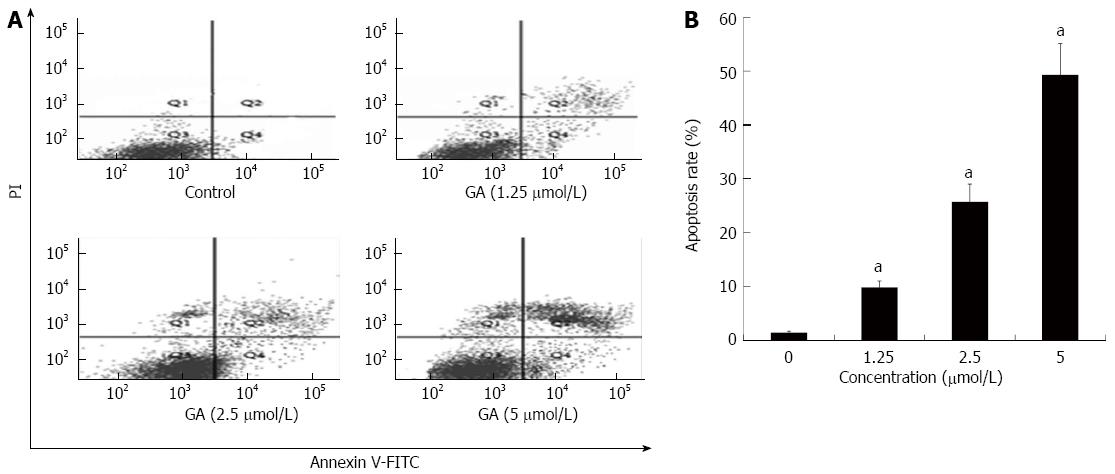
Flow cytometric analysis was conducted to quantify GA-induced apoptosis; representative results are shown in Figure 4A. As shown in Figure 4B, only a small number of apoptotic cells (lower and upper right quadrants) was detected in the control group. Apoptosis rates at 48 h after treatment with 1.25, 2.50 and 5.00 μmol/L GA were 9.8% ± 1.2%, 25.7% ± 3.3% and 49.3% ± 5.8%, respectively, which were significantly higher than that in the control condition (1.4% ± 0.3%; P < 0.05 for all).
Figure 4 Quantification of gambogic acid-induced apoptosis by flow cytometry.
A: HT-29 cells were treated for 48 h and sorted by flow cytometry to detect early (FITC-stained, lower right quadrant) and late [FITC- and propidium iodide (PI)-stained, upper right quadrant] apoptotic cells; B: The experiment was repeated three times and the average percentage of apoptotic cells (mean ± SE) is shown. aP < 0.05 vs 0 μmol/L. GA: Gambogic acid.
GA increases mRNA expression of caspase-8, -9 and -3
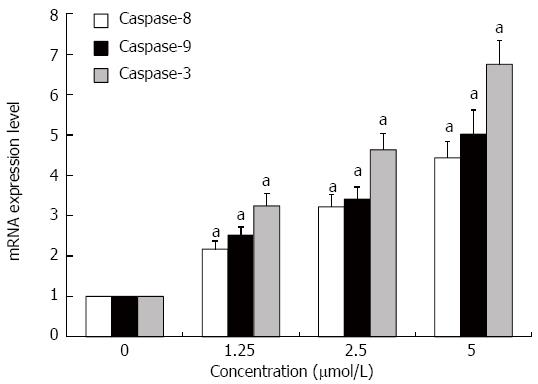
The expression levels of caspase-8, -9 and -3 mRNAs in HT-29 cells were significantly increased after treatment with GA for 48 h as assessed by quantitative RT-PCR (P < 0.05 for all) (Figure 5).
Figure 5 Gambogic acid increases the expression of caspase-9, -8 and -3 mRNAs in HT-29 cells.
HT-29 cells were treated for 48 h and mRNA expression was analyzed by quantitative real-time PCR. Expression levels were normalized to GAPDH and are relative to 0 μmol/L. aP < 0.05 vs 0 μmol/L.
Effects of GA on the death receptor and mitochondrial pathways in HT-29 cells
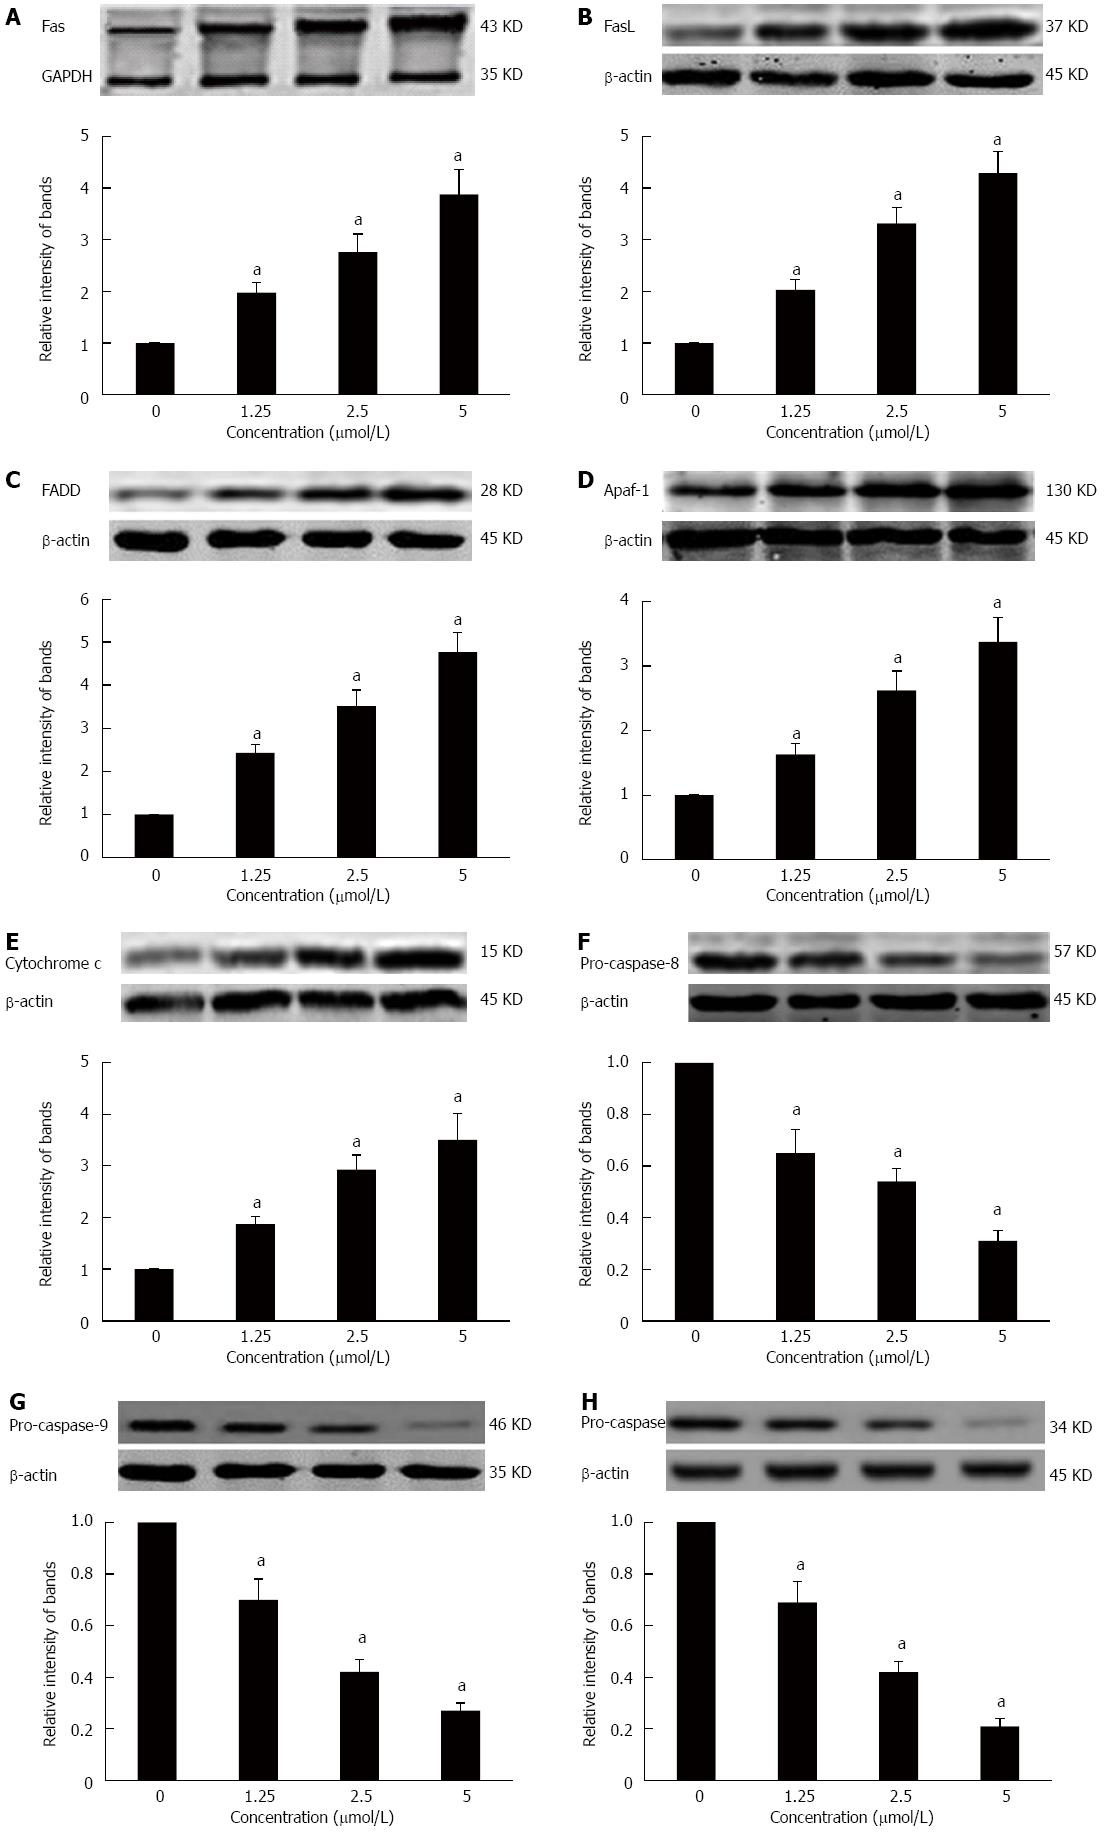
To further elucidate the molecular mechanism of GA-induced apoptosis in HT-29 cells, we examined the expression of proteins in the death receptor (extrinsic) and mitochondrial (intrinsic) apoptotic pathways. HT-29 cells treated for 48 h with GA expressed significantly higher levels of Fas, FasL, FADD, Apaf-1, and cytochrome c (P < 0.05) (Figure 6A-E). At the same time, levels of pro-caspase-8, -9 -3 were significantly decreased (P < 0.05) (Figure 6F-H).
Figure 6 Effects of gambogic acid on the expression of apoptosis-related factors in HT-29 cells.
HT-29 cells were treated with gambogic acid (GA) for 48 h and Western blot was performed to measure levels of Fas receptor (A); Fas ligand (FasL) (B); FADD (C); apaf-1 (D); cytochrome c (E); pro-caspase-8 (F); pro-caspase-9 (G); and pro-caspase-3 (H). Data are reported as the mean ± SE of at least three experiments. aP < 0.05 vs 0 μmol/L.
GA significantly inhibits growth of HT-29 tumors in a nude mouse xenograft model
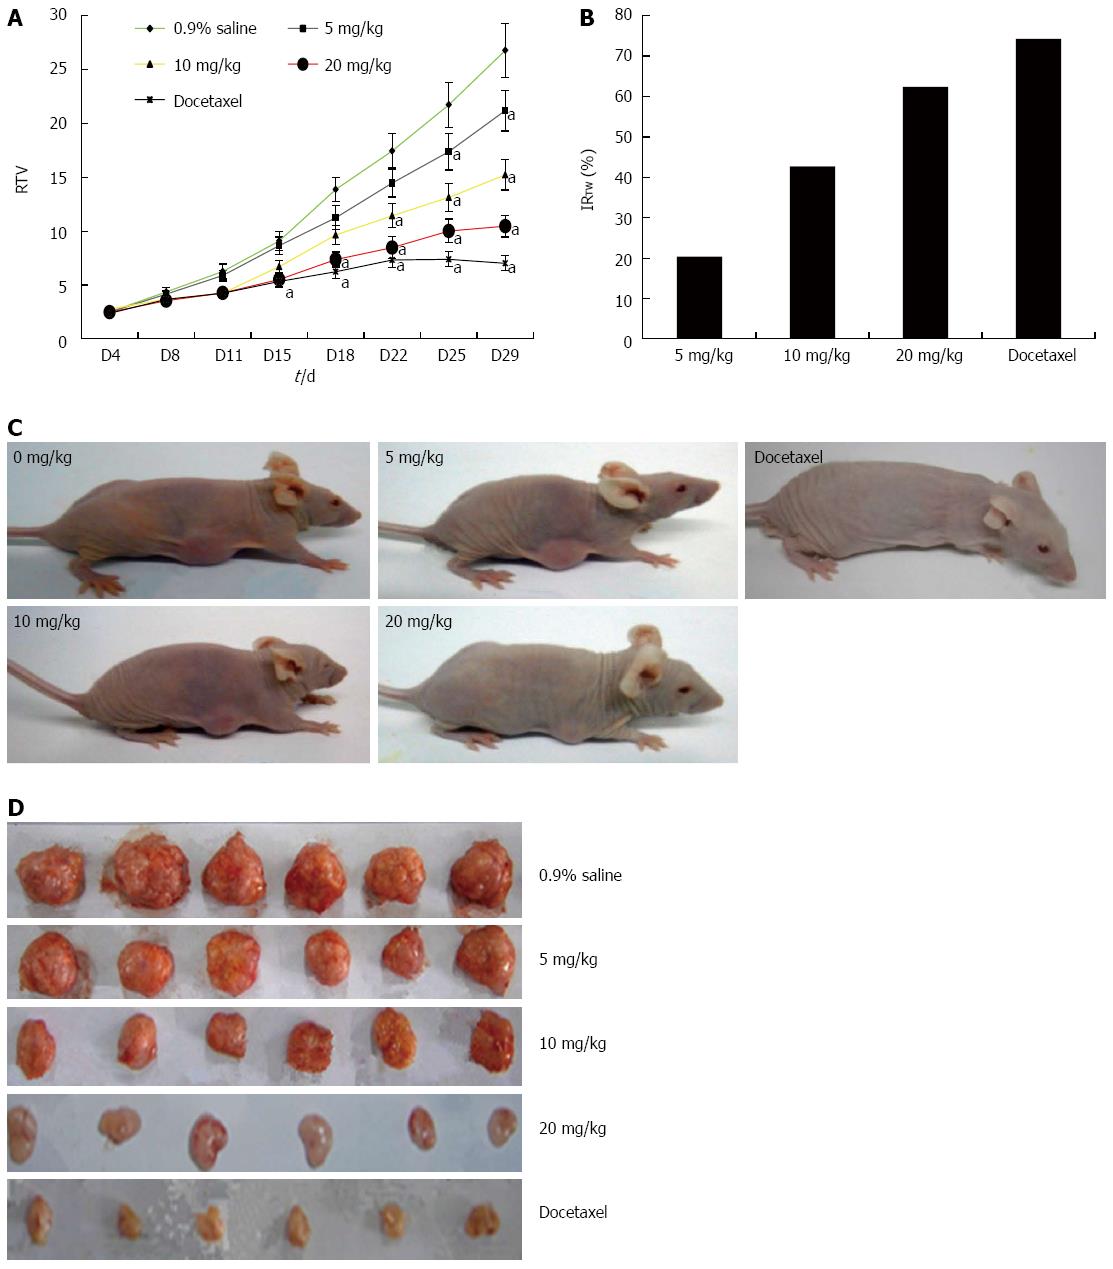
The potential anti-tumor effect of GA in vivo was assessed using a human tumor xenograft mouse model. Compared with tumor growth in saline-treated mice, there was a dose-dependent decrease in tumor volume in mice treated with GA for the entire period of observation (Figure 7). Furthermore, there was a decrease in tumor weight on day 29 when the mice were euthanized, as evidenced by an increase in the IRTW. GA was well tolerated at doses up to 20 mg/kg, with no signs of toxicity in this xenograft tumor model; loss of body weight after treatment was less than 10% in all treatment groups (data not shown).
Figure 7 Gambogic acid inhibits the proliferation of HT-29 cells in BALB/c nude mice.
A: Relative tumor volume (RTV) (mean ± SE) over the 29 d experiment; B: Inhibition ratio of tumor weight (IRTW) from subcutaneously implanted HT-29 cells; Representative photographs of nude mice (C) and tumor samples (D) from the saline-, gambogic acid-, and docetaxel-treated groups. aP < 0.05 vs saline.
DISCUSSION
This study demonstrates a dose- and time-dependent anti-proliferative effect of GA on human colon cancer cells in vitro and in an in vivo model. GA-induced apoptosis was previously reported in some other cell types, with relatively low toxicity and minimal side effects in normal cells[31,38,39]. As a physiologic mechanism, apoptosis kills cancer cells without imposing damage to normal cells or surrounding tissues[40]. Thus, inducing apoptosis in cancer cells has been a key mechanism for cancer treatment[41].
Apoptosis is a form of programmed cell death that typically leads to caspase activation via two major routes, the extrinsic death receptor and the intrinsic mitochondrial pathways[42]. Fas (CD95 or APO-1)[43] is a 36-kDa cell surface protein that belongs to the death receptor family, and has a pivotal role in apoptosis of breast[44], hepatocellular[45,46], colorectal[47,48] and nasopharyngeal[49] cancer cells via activation by its natural ligand, FasL. The death-inducing signaling complex (DISC) is rapidly formed after Fas stimulation, which consists of oligomerized Fas, FADD and pro-caspase-8. After binding to the DISC, pro-caspase-8 homodimers undergo a conformational change, and autocatalytic processing induces the generation of active caspase-8, leading to the activation of caspase-3. This caspase cascade leads to DNA damage and cell apoptosis[50-54]. In our study, we observed GA-induced increases in Fas, FasL, FADD, caspase-8 and caspase-3 expression, indicating that GA triggers apoptosis via the death receptor pathway.
Many factors, such as environmental stimuli and drugs, can induce mitochondrial dysfunction, leading to apoptosis via intrinsic pathways. Cytochrome c is released from dysfunctional mitochondria and accumulates in the cytoplasm where it binds to Apaf-1; pro-caspase-9 binds to Apaf-1 oligomers and leads to the formation of the apoptosome, followed by caspase-3 activation[55-57]. GA inhibits proliferation and induces apoptosis in many carcinoma cells via mitochondrial-dependent pathways[29-33]. Our data also show that GA induces upregulation of cytochrome c and Apaf-1, while downregulating pro-caspase-9 and -3. This result further supports an apoptotic effect of GA on HT-29 cells via the mitochondrial pathway.
GA has been long used for its anti-pyretic, analgesic and anti-inflammatory effects. However, the effect of GA on the growth of human colon cancer cells is still not very clear. From our tests, we can conclude that the death receptor and mitochondrial pathways are involved in the anti-tumor effect of GA in HT-29 cells. Our results, together with other studies, will provide a reference for clinical trials, though further studies are necessary.
COMMENTS
Background
Colorectal cancer is the third leading cause of cancer and the fourth leading cause of cancer-related deaths worldwide. Chemotherapy is an effective treatment for colon cancer, but traditional chemotherapy has many serious side effects, including significant pain.
Research frontiers
Gambogic acid (GA) is the major active ingredient in gamboge, extracted from various Garcinia species, including Garcinia hanburyi Hook f. (Tenghuang). GA has various biologic activities, including anti-pyretic, analgesic, anti-inflammatory, autophagic and anti-tumor activities. However, little is known regarding the effect of GA on the growth of human colon cancer cells.
Innovations and breakthroughs
This study is the first to report the effects of GA on the human colon cancer cell line HT-29. We observed a dose- and time-dependent anti-proliferative effect of GA on the cells. GA-induced apoptosis of HT-29 cells may be mediated by activation of the death receptor and mitochondrial pathways, as observed by increased expression of apoptosis-related proteins. In vivo, GA significantly inhibited the growth of HT-29 tumors in a nude mouse xenograft model.
Applications
The results of this study suggest that GA inhibits HT-29 proliferation via induction of apoptosis and that the effects may be mediated by death receptor and mitochondrial pathways. The results will provide a reference for clinical trials, though further studies are necessary.
Terminology
Apoptosis is a programmed cell death process that cells undergo in response to certain signals.
Peer-review
This is a nice piece of work, where authors report that GA inhibits HT-29 proliferation via induction of apoptosis and these effects are possibly mediated by death receptor (extrinsic) and mitochondrial (intrinsic) pathways.


