Published online Dec 7, 2014. doi: 10.3748/wjg.v20.i45.17065
Revised: March 31, 2014
Accepted: April 27, 2014
Published online: December 7, 2014
Processing time: 337 Days and 23.8 Hours
AIM: To elucidate the correlation between hepatic blood flow and liver function in alcoholic liver cirrhosis (AL-LC).
METHODS: The subjects included 35 patients with AL-LC (34 men, 1 woman; mean age, 58.9 ± 10.7 years; median age, 61 years; range: 37-76 years). All patients were enrolled in this study after obtaining written informed consent. Liver function was measured with tests measuring albumin (Alb), prothrombin time (PT), brain natriuretic peptide (BNP), branched amino acid and tyrosine ratio (BTR), branched chain amino acid (BCAA), tyrosine, ammonia (NH3), cholinesterase (ChE), immunoreactive insulin (IRI), total bile acid (TBA), and the retention rate of indocyanine green 15 min after administration (ICG R15). Hepatic blood flow, hepatic arterial tissue blood flow (HATBF), portal venous tissue blood flow (PVTBF), and total hepatic tissue blood flow (THTBF) were simultaneously calculated using xenon computed tomography.
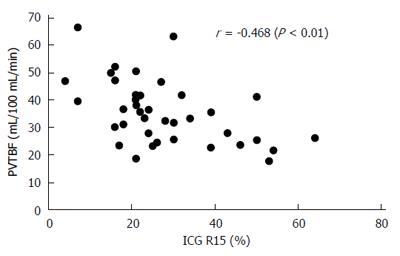
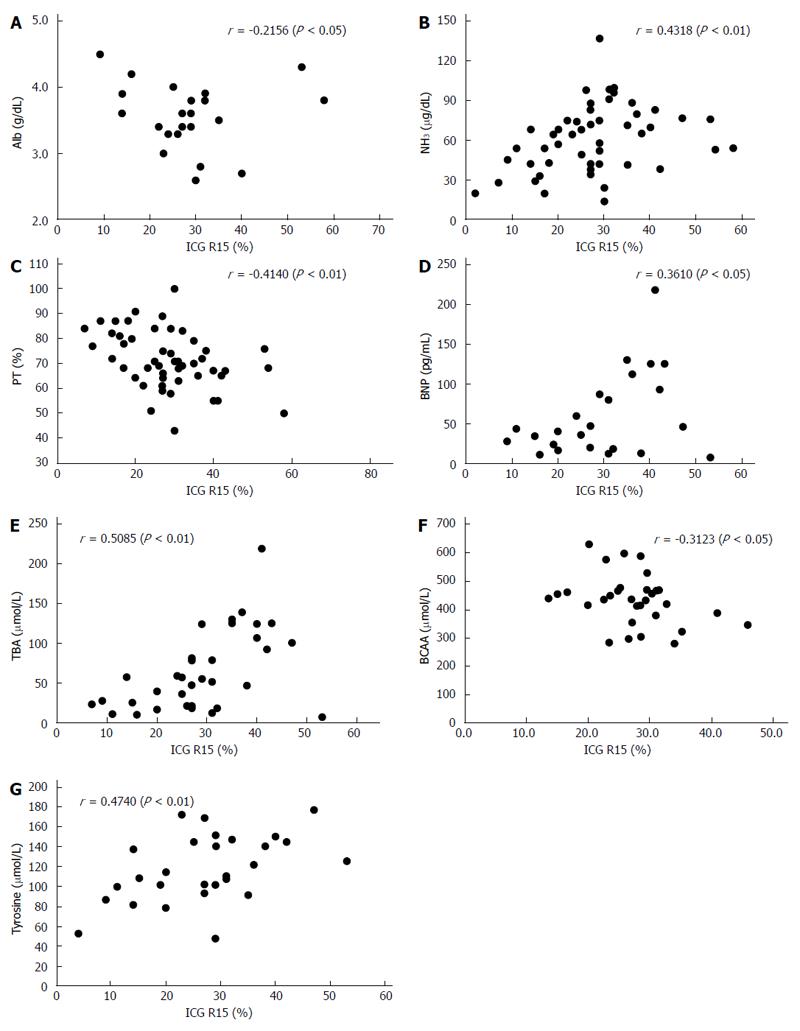
RESULTS: PVTBF, HATBF and THTBF were 30.2 ± 10.4, 20.0 ± 10.7, and 50.3 ± 14.9 mL/100 mL/min, respectively. Alb, PT, BNP, BTR, BCAA, tyrosine, NH3, ChE, IRI, TBA, and ICG R15 were 3.50 ± 0.50 g/dL, 72.0% ± 11.5%, 63.2 ± 56.7 pg/mL, 4.06 ± 1.24, 437.5 ± 89.4 μmol/L, 117.7 ± 32.8 μmol/L, 59.4 ± 22.7 μg/dL, 161.0 ± 70.8 IU/L, 12.8 ± 5.0 μg/dL, 68.0 ± 51.8 μmol/L, and 28.6% ± 13.5%, respectively. PVTBF showed a significant negative correlation with ICG R15 (r = -0.468, P <0.01). No significant correlation was seen between ICG 15R, HATBF and THTBF. There was a significant correlation between PVTBF and Alb (r = 0.2499, P < 0.05), and NH3 tended to have an inverse correlation with PVTBF (r = -0.2428, P = 0.0894). There were also many significant correlations between ICG R15 and liver function parameters, including Alb, NH3, PT, BNP, TBA, BCAA, and tyrosine (r = -0.2156, P < 0.05; r = 0.4318, P < 0.01; r = 0.4140, P < 0.01; r = 0.3610, P < 0.05; r = 0.5085, P < 0.001; r = 0.4496, P < 0.01; and r = 0.4740, P < 0.05, respectively).
CONCLUSION: Our investigation showed that there is a close correlation between liver function and hepatic blood flow.
Core tip: Hepatic blood flow (HBF) generally decreases with disease progression in chronic liver disease. Additionally, collateral vessels appear and liver function, such as liver synthesis and disposal capability, declines in liver cirrhosis (LC). Notably, in LC it is known that liver function deteriorates in almost direct proportion to progression of liver disease parameters such as Child-Pugh classification. Thus, in order to assess the state of chronic liver disease it is very important to evaluate HBF. The aim of the present study was to measure liver function and HBF using xenon computed tomography, and to elucidate the correlation between HBF and liver function in alcoholic LC.
- Citation: Takahashi H, Shigefuku R, Yoshida Y, Ikeda H, Matsunaga K, Matsumoto N, Okuse C, Sase S, Itoh F, Suzuki M. Correlation between hepatic blood flow and liver function in alcoholic liver cirrhosis. World J Gastroenterol 2014; 20(45): 17065-17074
- URL: https://www.wjgnet.com/1007-9327/full/v20/i45/17065.htm
- DOI: https://dx.doi.org/10.3748/wjg.v20.i45.17065
In general, liver function gradually deteriorates as chronic liver disease (CLD) progresses. Notably, in patients with liver cirrhosis (LC), liver function deteriorates in almost direct proportion to liver disease progression such as an increase in Child-Pugh classification. Additionally, hepatic blood flow (HBF) gradually decreases as CLD progresses. Thus, to assess the state of CLD, it is very important to evaluate HBF. However, it is difficult to evaluate HBF because the liver receives blood from both the portal vein and hepatic artery, and these systems are known to use independent mechanisms for blood flow adjustment.
Xenon computed tomography (Xe-CT) is a convenient and noninvasive method combining xenon gas inhalation with CT to quantify and visualize tissue blood flow (TBF). It is widely used in neurosurgical practice to evaluate cerebral TBF[1,2]. Xe-CT can also be used to obtain separate noninvasive measurements of hepatic arterial tissue blood flow (HATBF) and portal venous tissue blood flow (PVTBF) to detect changes in HBF caused by CLD progression[3-13]. Xe-CT using a dual blood supply model has been used to evaluate HATBF and PVTBF separately[3,8,9]. HBF obtained by Xe-CT corresponds to TBF, not intravascular blood flow because Xe gas can penetrate the hepatocytes. HBF can be obtained by other modalities such as perfusion CT, perfusion magnetic resonance imaging (MRI), and enhanced ultrasound, and these are the methods used to measure intravascular blood flow in the liver.
Recently, HBF has been evaluated using various noninvasive methods such as ultrasonography (US), computed tomography (CT), and MRI. In methods such as color Doppler US[14-17] and angiography[18], intravascular HBF is calculated by measuring flow velocities and vessel diameters of the portal vein and hepatic artery. Furthermore, TBF measurement has been attempted using enhanced CT and MRI[14,19,20]. Hepatic TBF has been evaluated in patients with CLD using Xe-CT[3-13].
HBF generally decreases with disease progression in CLD. There are many reports about correlations between HBF and severity of liver disease, especially LC. Additionally, collateral vessels appear and liver function, such as liver synthesis and disposal capability, declines in LC. Thus, in order to assess the state of CLD it is very important to evaluate HBF. However, the correlation between HBF and liver function remains unclear. This study aimed to measure liver function and HBF using Xe-CT and to elucidate the correlation between HBF and liver function in alcoholic LC (AL-LC).
Between October 2001 and September 2012, we performed Xe-CT on 556 patients. Of 556 patients, 35 with AL-LC (34 men, 1 woman; mean age, 58.9 ± 10.7 years; median age, 61 years; range 37-76 years) who provided written informed consent in advance were enrolled in this study (Table 1). They had no severe heart, renal and respiratory disease apart from liver cirrhosis. After confirmation of the above criteria and absence of hepatocellular carcinoma to exclude the influence of intrahepatic flow, Xe-CT was performed on admission. All study protocols were conducted in accordance with the ethics guidelines of the Declaration of Helsinki and approved by the ethics committee at our institution (approval No. 480).
| Characteristics | |
| Patients (n) | |
| Gender | |
| Male | 34 |
| Female | 1 |
| Age (yr) | |
| Average | 58.9 ± 10.7 |
| Range | 37-76 |
| Median | 61 |
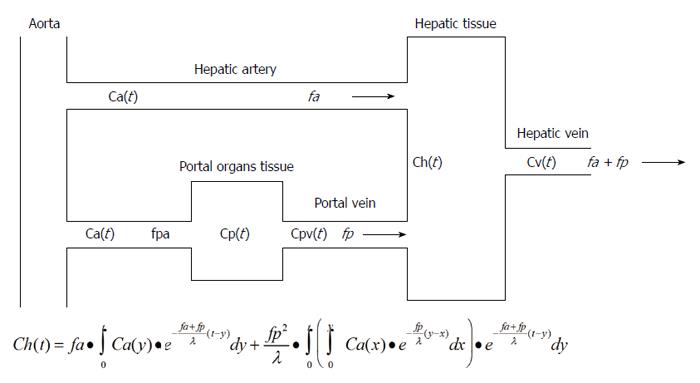
Xe is an inert gas that is present in the atmosphere in trace amounts. A high atomic weight and X-ray mass absorption coefficient for the element Xe facilitate the measurement of changes in tissue concentrations of Xe with CT. In Xe-CT, changes in Xe concentrations over time are measured in the hepatic tissue and spleen. By applying the Fick principle[21], a single blood supply model (inflow: arterial only, outflow: venous) can be fitted to a dual blood supply model (inflow: arterial and portal venous) to separately determine HATBF (mL/100 mL/min) and PVTBF (mL/100 mL/min) (Figure 1). Total hepatic tissue blood flow (THTBF) is the sum of HATBF and PVTBF.
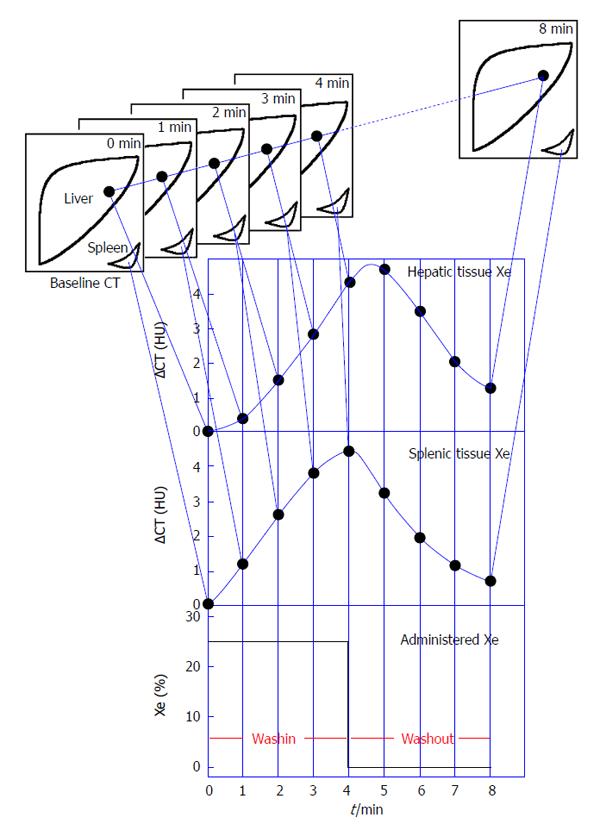
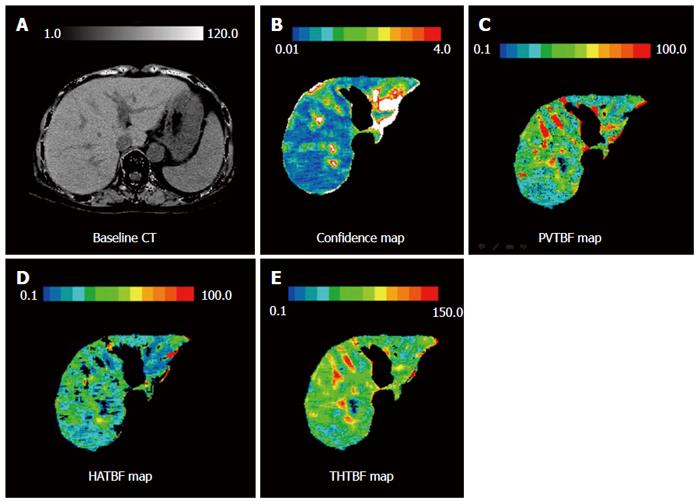
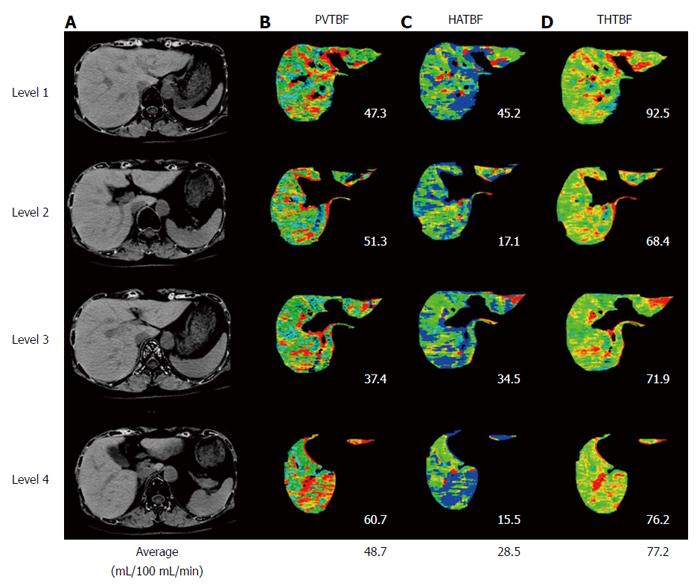
The imaging devices, protocol, and processing were the same as previously reported[9,10]. We used 25% stable Xe gas in conjunction with an AZ-726 Xe gas inhalation system (Anzai Medical Co., Ltd., Tokyo, Japan). The wash-in and wash-out periods were both 4 min. The entire liver was examined by CT at 1-min intervals at 4 levels, including the porta hepatis (9 scans in total, including the baseline scan) (Figure 2). Using an AZ-7000W image processing system (Anzai Medical Co., Ltd.), PVTBF, HATBF, and THTBF were calculated, and these maps were created. The time course change rate for the arterial Xe concentration, which was needed to calculate PVTBF and HATBF, was derived using the time course of the Xe concentration in the spleen tissue. An Aquilion CT scanner (Toshiba Medical Systems Corporation, Tokyo, Japan) was used, with exposure factors of 120 kV, 150 mA, and 13.8 mGy. Confidence values indicated the difference between theoretical and actual changes in CT values over time and were used as an index of reliability (Figure 3). Regions of interest (ROI) were chosen at 4 levels, and areas with low reliability were automatically excluded (Figure 3). The mean of the 4 levels was used to determine PVTBF and HATBF in each patient, and THTBF was calculated as the sum of PVTBF and HATBF (Figure 4). Xe-CT was performed on admission. The analysts of the Xe-CT data were blinded to the results of the clinical information.
Liver function tests were measured on admission. Liver function tests included the following parameters: albumin (Alb) (g/dL), prothrombin time (PT) (%), brain natriuretic peptide (BNP) (pg/mL), branched amino acid and tyrosine ratio (BTR), branched chain amino acid (BCAA) (μmol/L), tyrosine (μmol/L), ammonia (NH3 μg/dL), cholinesterase (ChE IU/L), immunoreactive insulin (IRI μU/mL), total bile acid (TBA μmol/L), and the retention rate of indocyanine green 15 min after administration (ICG R15) (%). ICG (Diagnogreen®, Daiichi Sankyo Co., Tokyo, Japan; 0.5 mg/kg body weight) was administered via a peripheral vein, and venous blood was sampled before and 15 min after injection. Specimens were analyzed for ICG concentrations on a spectrophotometer at 805 nm.
Each parameter is expressed as mean ± SD. The Pearson product-moment correlation coefficient was used to examine correlations between TBF parameters and liver function tests. The Pearson product-moment correlation coefficient is a measure of the linear correlation between two variables. It is defined as covariance of the two variables divided by the product of standard deviations. All statistical tests were performed with the statistical software, GraphPad Prism (GraphPad Software, Inc., La Jolla, California, United States). P values < 0.05 were considered statistically significant.
Hepatic TBF as measured by Xe-CT, ICG R15, and liver function is summarized in Table 2.
| PVTBF | (mL/100 mL/min) | 30.2 ± 10.4 |
| HATBF | (mL/100 mL/min) | 20.0 ± 10.7 |
| THTBF | (mL/100 mL/min) | 50.3 ± 14.9 |
| Alb | (g/dL) | 3.50 ± 0.50 |
| PT | 72.0% ± 11.5% | |
| ChE | (IU/L) | 161 ± 70.8 |
| BNP | (pg/mL) | 63.2 ± 56.7 |
| TBA | (μmol/L) | 68.0 ± 51.8 |
| NH3 | (μg/dL) | 59.4 ± 22.7 |
| ICG R15 | 28.6% ± 13.5% | |
| BTR | 4.06 ± 1.24 | |
| BCAA | (μmol/L) | 437.5 ± 89.4 |
| Tyrosine | (μmol/L) | 117.7 ± 32.8 |
| IRI | (μg/dL) | 12.8 ± 5.0 |
PVTBF showed a significant negative correlation with ICG R15 (r = -0.468, P < 0.01, Figure 5). No significant correlation was seen between ICG 15R and HATBF and THTBF.
The correlations between hepatic TBF as measured by Xe-CT, ICG R15, and liver function are summarized in Table 3, Figure 6, and Figure 7. There was a significant correlation between PVTBF and Alb (r = 0.2499, P < 0.05), and NH3 tended to have an inverse correlation with PVTBF (r = -0.2428, P = 0.0894) (Table 3 and Figure 6). There were also many significant correlations between ICG R15 and liver function parameters, including Alb, NH3, PT, BNP, TBA, BCAA, and tyrosine (r = -0.2156, P < 0.05; r = 0.4318, P < 0.01; r = 0.4140, P < 0.01; r = 0.3610, P < 0.05; r = 0.5085, P < 0.001; r = -0.3123, P < 0.05; and r = 0.4740, P < 0.05, respectively) (Table 3 and Figure 7).
| PVBTF | HATBF | THTBA | ICG R15 | |||||
| r | P value | r | P value | r | P value | r | P value | |
| Alb (g/dL) | 0.2499 | < 0.05 | -0.0251 | NS | 0.0452 | NS | -0.2156 | < 0.05 |
| NH3 (μg/dL) | -0.2428 | 0.0894 | -0.1479 | NS | -0.1307 | NS | 0.4318 | < 0.01 |
| PT | 0.1475 | NS | 0.1947 | NS | 0.0690 | NS | -0.4140 | < 0.01 |
| BNP (pg/mL) | -0.0231 | NS | -0.0231 | NS | 0.0330 | NS | 0.3610 | < 0.05 |
| TBA (μmol/L) | -0.1810 | NS | -0.0160 | NS | 0.0483 | NS | 0.5085 | < 0.01 |
| T Chol (mg/dL) | -0.0618 | NS | 0.2007 | NS | 0.0483 | NS | 0.4195 | < 0.05 |
| ChE (IU/L) | -0.0613 | NS | 0.0704 | NS | 0.0197 | NS | -0.0952 | NS |
| BTR | -0.1329 | NS | 0.2103 | NS | 0.0801 | NS | -0.2378 | NS |
| BCAA (μmol/L) | -0.3123 | NS | 0.2031 | NS | -0.0220 | NS | -0.3123 | < 0.05 |
| Tyrosine (μmol/L) | 0.0644 | NS | -0.0317 | NS | -0.0078 | NS | 0.4740 | < 0.01 |
| IRI (μg/dL) | -0.0377 | NS | 0.0509 | NS | -0.0509 | NS | 0.1251 | NS |
Some methods that can be used to measure HBF include organ-reflectance spectrophotometry and hydrogen clearance[22,23], direct catheter insertion[18,24], continuous spectral Doppler US[16,17], dynamic CT[20], and dynamic MRI[14]. HBF gradually decreases as liver disease progresses in all patients with CLD including alcoholic liver disease[7,9,16,17,20,22,23], nonalcoholic fatty liver disease[8,9,12,13], and liver disease related to hepatitis C virus[6,7,9,13].
Liver function gradually deteriorates as CLD progresses. In particular, liver function deteriorates in almost direct proportion to liver disease progression in patients with LC. Additionally, a hyperdynamic state appears as CLD progresses, especially in LC, and total plasma volume gradually increases[24]. In the portal venous system, including the celiac artery and superior mesenteric artery in particular, splenic arterial flow prominently increases and accounts for a considerable amount of the portal venous system volume[24]. Conversely, HBF generally decreases with disease progression[16-18,20,22,23,25-27], and we have reported results similar to those previously reported[6-9,12]. In addition, portal flow decreases in inverse proportion to ICG R15[14,20]. We also previously reported that portal flow gradually decreases in patients with LC as the Child-Pugh score increases or disease stage advances[7,9]. Berzigotti reported that HBF estimations by Doppler US and ICG are significantly correlated[28]. This study showed that ICG R15 can be a more valuable and precise index that reflects both HBF and liver function because there were many significant correlations between ICG R15 and liver function in our investigation. Presently, we have a renewed sense of the importance of ICG R15.
In general, portal/hepatic arterial flow ratio (P/A) is approximately 2[29]. However, there is a compensatory mechanism called the hepatic arterial buffer response[24-27], which maintains total HBF by increasing hepatic arterial flow in response to decreasing portal flow[24-27]. This hepatic hemodynamic alteration, particularly the decrease of portal flow, causes collateral vessel development, especially the emergence of esophagogastric varices (EGV). The portal vein acts as a functional vessel, and the hepatic artery acts as a feeding vessel[29]. Portal flow transports fatty acids, glycerin, glucose, amino acids, and other compounds on one hand, and bilirubin, ammonia, aromatic amino acids, and other compounds on the other hand into the hepatocytes to metabolize. One is to synthesize and the other is to discard. Portal flow is important in metabolism. In this study, unlike HATBF and THTBF, PVTBF had a stronger correlation with liver function and disease status. PVTBF has predominance and plays an important role in HBF. Furthermore, PVTBF has an active hemodynamic change. Conversely, HATBF has a passive hemodynamic change.
Generally, when HBF decreases, a compensatory mechanism is called upon for O2 concentration maintenance. This results in an increase of O2 extraction (oxygen desaturation). However, if HBF further decreases, that mechanism cannot compensate adequately for O2 concentration maintenance, and a decrease in oxygen consumption follows[22,23]. The decrease in HBF and oxygen consumption induces oxidant stress and cytokines that trigger inflammation. As a consequence, fibrosis progresses and HBF further decreases, thus creating a vicious cycle[23]. As CLD progresses, liver synthesis and disposal capability decline. Hayashi et al[22] reported a significant positive correlation between HBF and local oxygen consumption in alcoholic liver disease and low levels of HBF and local oxygen consumption (even in the alcoholic fatty liver), which gradually decreased as CLD progressed. Moreover, they reported a significant positive correlation between ICG R15 and local oxygen consumption in alcoholic liver disease, suggesting a close association between HBF and local oxygen consumption and, by extension, liver-sparing ability in CLD. Additionally, portal flow increases and intestinal hemodynamics improve as a result of interrupted blood flow to the collateral vessels. By inference, these phenomena may result in increased estimated hepatic oxygen consumption, hepatocyte function, and synthesis.
There are some reports which relate HBF to liver function. Noiret et al[30] reported that the redistribution of organ blood flow associated with severe cirrhosis was sufficient to cause hyperammonemia, even when the hepatic detoxification function and the ammonia production were set to normal. They noted that interventions that reduce the fraction of shunting may be future targets of therapy to control hyperammonemia severity. Maruyama et al[31] reported that patients with hepatofugal flow had a significantly higher incidence of ascites than those with hepatopetal flow, higher Child-Pugh classification, and higher incidence of decompensated liver and rectal varices. Two reports suggest that depending on the severity of portal hypertension, decrease of HBF can lead to deteriorated liver function in spite of relative preservation of hepatocellular function. In addition, we reported that PVTBF increased after endoscopic injection sclerotherapy for EGV, and HATBF decreased in response to an increase in PVTBF[12]. In the future, we will elucidate whether hemodynamic alteration leads to the amelioration of liver function.
In conclusion, there is a significant close correlation between PVTBF, ICG R15, and liver function.
The authors wish to thank the technical assistants at the Imaging Center of St. Marianna University School of Medicine Hospital for their assistance.
Hepatic blood flow (HBF) generally decreases with disease progression in chronic liver disease (CLD). Additionally, collateral vessels appear and liver function, such as liver synthesis and disposal capability, declines in liver cirrhosis (LC).
Notably, in LC it is known that liver function deteriorates in almost direct proportion to progression of liver disease parameters such as Child-Pugh classification. Thus, in order to assess the state of CLD it is very important to evaluate HBF.
The aim of the present study was to measure liver function and HBF using xenon computed tomography, and elucidate the correlation between HBF and liver function in alcoholic LC.
The study is an interesting exploration of how hepatic perfusion may relate to liver function.
P- Reviewer: Abbott DE, Jie SH, Zhang YP S- Editor: Gou SX L- Editor: Logan S E- Editor: Ma S
| 1. | Gur D, Good WF, Wolfson SK, Yonas H, Shabason L. In vivo mapping of local cerebral blood flow by xenon-enhanced computed tomography. Science. 1982;215:1267-1268. [RCA] [PubMed] [DOI] [Full Text] [Cited by in Crossref: 115] [Cited by in RCA: 104] [Article Influence: 2.4] [Reference Citation Analysis (0)] |
| 2. | Leopold D, Zinreich SJ, Simon BA, Cullen MM, Marcucci C. Xenon-enhanced computed tomography quantifies normal maxillary sinus ventilation. Otolaryngol Head Neck Surg. 2000;122:422-424. [RCA] [PubMed] [DOI] [Full Text] [Cited by in Crossref: 9] [Cited by in RCA: 10] [Article Influence: 0.4] [Reference Citation Analysis (0)] |
| 3. | Sase S, Suzuki M, Ikeda H, Takahashi H, Okuse N, Maeyama S, Shibata I. Quantitative multilevel mapping of hepatic blood flow by xenon computed tomography using aorta. J Comput Assist Tomogr. 2003;27:647-651. [RCA] [PubMed] [DOI] [Full Text] [Cited by in Crossref: 9] [Cited by in RCA: 9] [Article Influence: 0.4] [Reference Citation Analysis (0)] |
| 4. | Ikeda H, Suzuki M, Kobayashi M, Takahashi H, Matsumoto N, Maeyama S, Iino S, Sase S, Itoh F. Xenon computed tomography shows hemodynamic change during the progression of chronic hepatitis C. Hepatol Res. 2007;37:104-112. [RCA] [PubMed] [DOI] [Full Text] [Cited by in Crossref: 10] [Cited by in RCA: 9] [Article Influence: 0.5] [Reference Citation Analysis (0)] |
| 5. | Takahashi H, Suzuki M, Ikeda H, Kobayashi M, Sase S, Yotsuyanagi H, Maeyama S, Iino S, Itoh F. Evaluation of quantitative portal venous, hepatic arterial, and total hepatic tissue blood flow using xenon CT in alcoholic liver cirrhosis: comparison with liver cirrhosis C. Alcohol Clin Exp Res. 2007;31:S43-S48. [RCA] [PubMed] [DOI] [Full Text] [Cited by in Crossref: 15] [Cited by in RCA: 15] [Article Influence: 0.8] [Reference Citation Analysis (0)] |
| 6. | Kobayashi M, Suzuki M, Ikeda H, Takahashi H, Matsumoto N, Maeyama S, Sase S, Iino S, Itoh F. Assessment of hepatic steatosis and hepatic tissue blood flow by xenon computed tomography in nonalcoholic steatohepatitis. Hepatol Res. 2009;39:31-39. [RCA] [PubMed] [DOI] [Full Text] [Cited by in Crossref: 16] [Cited by in RCA: 18] [Article Influence: 1.1] [Reference Citation Analysis (0)] |
| 7. | Takahashi H, Suzuki M, Ikeda H, Kobayashi M, Sase S, Yotsuyanagi H, Maeyama S, Iino S, Itoh F. Evaluation of quantitative portal venous, hepatic arterial, and total hepatic tissue blood flow using xenon CT in alcoholic liver cirrhosis-comparison with liver cirrhosis related to hepatitis C virus and nonalcoholic steatohepatitis. Alcohol Clin Exp Res. 2010;34 Suppl 1:S7-S13. [RCA] [PubMed] [DOI] [Full Text] [Cited by in Crossref: 14] [Cited by in RCA: 17] [Article Influence: 1.0] [Reference Citation Analysis (0)] |
| 8. | Sase S, Monden M, Oka H, Dono K, Fukuta T, Shibata I. Hepatic blood flow measurements with arterial and portal blood flow mapping in the human liver by means of xenon CT. J Comput Assist Tomogr. 2002;26:243-249. [RCA] [PubMed] [DOI] [Full Text] [Cited by in Crossref: 27] [Cited by in RCA: 26] [Article Influence: 1.1] [Reference Citation Analysis (0)] |
| 9. | Sase S, Takahashi H, Ikeda H, Kobayashi M, Matsumoto N, Suzuki M. Determination of time-course change rate for arterial xenon using the time course of tissue xenon concentration in xenon-enhanced computed tomography. Med Phys. 2008;35:2331-2338. [RCA] [PubMed] [DOI] [Full Text] [Cited by in Crossref: 11] [Cited by in RCA: 11] [Article Influence: 0.6] [Reference Citation Analysis (0)] |
| 10. | Shigefuku R, Takahashi H, Kobayashi M, Ikeda H, Matsunaga K, Okuse C, Matsumoto N, Maeyama S, Sase S, Suzuki M. Pathophysiological analysis of nonalcoholic fatty liver disease by evaluation of fatty liver changes and blood flow using xenon computed tomography: can early-stage nonalcoholic steatohepatitis be distinguished from simple steatosis? J Gastroenterol. 2012;47:1238-1247. [RCA] [PubMed] [DOI] [Full Text] [Cited by in Crossref: 20] [Cited by in RCA: 23] [Article Influence: 1.6] [Reference Citation Analysis (0)] |
| 11. | Sase S, Takahashi H, Shigefuku R, Ikeda H, Kobayashi M, Matsumoto N, Suzuki M. Measurement of blood flow and xenon solubility coefficient in the human liver by xenon-enhanced computed tomography. Med Phys. 2012;39:7553-7559. [RCA] [PubMed] [DOI] [Full Text] [Cited by in Crossref: 5] [Cited by in RCA: 5] [Article Influence: 0.4] [Reference Citation Analysis (0)] |
| 12. | Takahashi H, Suzuki M, Shigefuku R, Okano M, Hiraishi T, Takagi R, Noguchi Y, Hattori N, Hatsugai M, Nakahara K. Xenon computed tomography can evaluate the improvement of hepatic hemodynamics before and after endoscopic injection sclerotherapy. J Gastroenterol. 2013;48:1353-1361. [RCA] [PubMed] [DOI] [Full Text] [Cited by in Crossref: 5] [Cited by in RCA: 6] [Article Influence: 0.5] [Reference Citation Analysis (0)] |
| 13. | Shigefuku R, Takahashi H, Kato M, Yoshida Y, Suetani K, Noguchi Y, Hatsugai M, Nakahara K, Ikeda H, Kobayashi M. Evaluation of hepatic tissue blood flow using xenon computed tomography with fibrosis progression in nonalcoholic fatty liver disease: comparison with chronic hepatitis C. Int J Mol Sci. 2014;15:1026-1039. [RCA] [PubMed] [DOI] [Full Text] [Full Text (PDF)] [Cited by in Crossref: 8] [Cited by in RCA: 9] [Article Influence: 0.8] [Reference Citation Analysis (0)] |
| 14. | Annet L, Materne R, Danse E, Jamart J, Horsmans Y, Van Beers BE. Hepatic flow parameters measured with MR imaging and Doppler US: correlations with degree of cirrhosis and portal hypertension. Radiology. 2003;229:409-414. [RCA] [PubMed] [DOI] [Full Text] [Cited by in Crossref: 229] [Cited by in RCA: 222] [Article Influence: 9.7] [Reference Citation Analysis (0)] |
| 15. | Bernatik T, Strobel D, Hahn EG, Becker D. Doppler measurements: a surrogate marker of liver fibrosis? Eur J Gastroenterol Hepatol. 2002;14:383-387. [RCA] [PubMed] [DOI] [Full Text] [Cited by in Crossref: 53] [Cited by in RCA: 52] [Article Influence: 2.2] [Reference Citation Analysis (0)] |
| 16. | Fujita Y, Watanabe M, Sasao K, Wakui N, Shinohara M, Ishii K, Sumino Y. Investigation of liver parenchymal flow using contrast-enhanced ultrasound in patients with alcoholic liver disease. Alcohol Clin Exp Res. 2004;28:169S-173S. [RCA] [PubMed] [DOI] [Full Text] [Cited by in Crossref: 14] [Cited by in RCA: 11] [Article Influence: 0.5] [Reference Citation Analysis (0)] |
| 17. | Hirata M, Kurose K, Minami H, Kumagi T, Akbar SM, Michitaka K, Horiike N, Onji M. Clinical characteristics of portal hemodynamics in alcoholic liver cirrhosis. Alcohol Clin Exp Res. 2004;28:148S-152S. [RCA] [PubMed] [DOI] [Full Text] [Cited by in Crossref: 6] [Cited by in RCA: 6] [Article Influence: 0.3] [Reference Citation Analysis (0)] |
| 18. | Chiandussi L, Greco F, Sardi G, Vaccarino A, Ferraris CM, Curti B. Estimation of hepatic arterial and portal venous blood flow by direct catheterization of the vena porta through the umbilical cord in man. Preliminary results. Acta Hepatosplenol. 1968;15:166-171. [PubMed] |
| 19. | Materne R, Smith AM, Peeters F, Dehoux JP, Keyeux A, Horsmans Y, Van Beers BE. Assessment of hepatic perfusion parameters with dynamic MRI. Magn Reson Med. 2002;47:135-142. [RCA] [PubMed] [DOI] [Full Text] [Cited by in Crossref: 192] [Cited by in RCA: 189] [Article Influence: 7.9] [Reference Citation Analysis (0)] |
| 20. | Van Beers BE, Leconte I, Materne R, Smith AM, Jamart J, Horsmans Y. Hepatic perfusion parameters in chronic liver disease: dynamic CT measurements correlated with disease severity. AJR Am J Roentgenol. 2001;176:667-673. [RCA] [PubMed] [DOI] [Full Text] [Cited by in Crossref: 254] [Cited by in RCA: 263] [Article Influence: 10.5] [Reference Citation Analysis (1)] |
| 21. | Visscher MB, Johnson JA. The Fick principle: analysis of potential errors in its conventional application. J Appl Physiol. 1953;5:635-638. [PubMed] |
| 22. | Hayashi N, Kasahara A, Kurosawa K, Sasaki Y, Fusamoto H, Sato N, Kamada T. Oxygen supply to the liver in patients with alcoholic liver disease assessed by organ-reflectance spectrophotometry. Gastroenterology. 1985;88:881-886. [PubMed] |
| 23. | Kasahara A, Hayashi N, Kurosawa K, Sasaki Y, Sato N, Kamada T. Hepatic hemodynamics and oxygen consumption in alcoholic fatty liver assessed by organ-reflectance spectrophotometry and the hydrogen clearance method. Hepatology. 1986;6:87-91. [RCA] [PubMed] [DOI] [Full Text] [Cited by in Crossref: 11] [Cited by in RCA: 11] [Article Influence: 0.3] [Reference Citation Analysis (0)] |
| 24. | Witte CL, Witte MH, Krone CL. Contrasting hemodynamic patterns of portal hypertension. Ann Surg. 1972;176:68-79. [RCA] [PubMed] [DOI] [Full Text] [Cited by in Crossref: 13] [Cited by in RCA: 13] [Article Influence: 0.2] [Reference Citation Analysis (0)] |
| 25. | Newby DE, Hayes PC. Hyperdynamic circulation in liver cirrhosis: not peripheral vasodilatation but ‘splanchnic steal’. QJM. 2002;95:827-830. [RCA] [PubMed] [DOI] [Full Text] [Cited by in Crossref: 56] [Cited by in RCA: 57] [Article Influence: 2.4] [Reference Citation Analysis (0)] |
| 26. | Richter S, Mücke I, Menger MD, Vollmar B. Impact of intrinsic blood flow regulation in cirrhosis: maintenance of hepatic arterial buffer response. Am J Physiol Gastrointest Liver Physiol. 2000;279:G454-G462. [PubMed] |
| 27. | Gülberg V, Haag K, Rössle M, Gerbes AL. Hepatic arterial buffer response in patients with advanced cirrhosis. Hepatology. 2002;35:630-634. [RCA] [PubMed] [DOI] [Full Text] [Cited by in Crossref: 105] [Cited by in RCA: 119] [Article Influence: 5.0] [Reference Citation Analysis (1)] |
| 28. | Berzigotti A, Reverter E, García-Criado A, Abraldes JG, Cerini F, García-Pagán JC, Bosch J. Reliability of the estimation of total hepatic blood flow by Doppler ultrasound in patients with cirrhotic portal hypertension. J Hepatol. 2013;59:717-722. [RCA] [PubMed] [DOI] [Full Text] [Cited by in Crossref: 16] [Cited by in RCA: 19] [Article Influence: 1.5] [Reference Citation Analysis (0)] |
| 29. | Tygstrup N, Winkler K, Mellemgaard K, Andreassen M. Determination of the hepatic arterial blood flow and oxygen supply in man by clamping the hepatic artery during surgery. J Clin Invest. 1962;41:447-454. [RCA] [PubMed] [DOI] [Full Text] [Cited by in Crossref: 112] [Cited by in RCA: 113] [Article Influence: 4.0] [Reference Citation Analysis (0)] |
| 30. | Noiret L, Baigent S, Jalan R. Arterial ammonia levels in cirrhosis are determined by systemic and hepatic hemodynamics, and by organ function: a quantitative modelling study. Liver Int. 2014;34:e45-e55. [RCA] [PubMed] [DOI] [Full Text] [Cited by in Crossref: 14] [Cited by in RCA: 14] [Article Influence: 1.2] [Reference Citation Analysis (0)] |
| 31. | Maruyama H, Kamezaki H, Kondo T, Sekimoto T, Shimada T, Takahashi M, Okugawa H, Yokosuka O. Effects of inferior mesenteric vein flow in patients with cirrhosis. Clin Gastroenterol Hepatol. 2013;11:1648-1654. [RCA] [PubMed] [DOI] [Full Text] [Cited by in Crossref: 6] [Cited by in RCA: 8] [Article Influence: 0.6] [Reference Citation Analysis (0)] |


