CT COLONOGRAPHY
In recent years the role of CT colonography as an alternative to endoscopy has been widely studied. CT colonography became popular because of recent studies showing its good clinical performance, safety profile, and cost effectiveness in screening for colorectal cancer. Low X-ray energy is sufficient to achieve diagnostic CT colonography images, resulting in a low radiation dose to the patient[1,2]. CT colonography allows evaluation not only of the colon, but also visualization of extracolonic organs (e.g., liver, lung bases). Mainenti et al[3] identified extracolonic findings, such as liver metastases, pulmonary metastases, mesenteric and mesocolic infiltration, and lymph nodes metastases with an accuracy of 93% using preoperative CT colonography. Three-dimensional (3D) reconstructions enable accurate quantification of the size of lesions or identification of metastases[4]. CT scan can detect polyps or tumors with high sensitivity and specificity. For screening purposes, the sensitivity of CT colonography for adenomatous polyps was 93.8% for polyps larger than 10 mm in diameter, 93.9% for polyps at least 8 mm in diameter, and 88.7% for polyps at least 6 mm in diameter[5].
The presence of an advanced colorectal cancer sometimes limits the evaluation of the colon proximal to the lesion using colonsocopy. Distension of the bowel lumen is probably the most important factor for CT colonography quality. The strength of contrast-enhanced CT colonography in diagnosing the exact site of colorectal cancers and synchronous colon lesions relies on the high technical quality of the examination[6]. Flor et al[7] verified that an obstructing colorectal cancer does not affect colon distension, this allowing visualization with CT colonography.
CT colonography is useful in cases of incomplete preoperative colonoscopy because CT colonography can evaluate the colon proximal to the tumor, which cannot be seen with the endoscope. Patients with colorectal cancer have synchronous lesions in 5%-11% of cases[8-10]. Synchronous lesions in different anatomic segments should be diagnosed preoperatively, because the second lesion will also require surgical treatment. A CT air enema image summarizes in a single image the precise location and number of colonic lesions. The CT air enema image is easily read as it closely resembles the familiar imaging of a double contrast barium enema.
T staging by CT colonography
CT colonography provides important information for the preoperative assessment of T stage in patients with colorectal cancer. Colorectal cancer is seen as a rough appearance of the bowel wall, especially in patients with advanced lesions. When there is increased density in adjacent fatty tissue, the tumors have often infiltrated at least to the subserosa. Deformity of the intestinal wall is associated with muscular or subserosal invasion. A rough appearance of the soft tissue around the intestinal wall, such as irregular or spicular projections into the peri-colonic adipose tissue, is usually associated with a T3/T4 stage tumor.
Wall deformities are classified by degree, and are associated with a specific T stage. Nagata et al[11] classified bowel wall deformities seen on CT air enema images into five types: no deformity, slight, moderate, and severe deformities, and proposed that each type of wall deformity represents a specific T stage. They then used a modified classification to differentiate among Tis, T1, T2 and T3/T4, and demonstrated an overall accuracy of 77.6%. Utano at al[12] classified intestinal wall deformities into arc type, trapezoid type, and apple-core type. Trapezoidal wall deformity was defined as involving ≥ 50% of the circumference of the lumen. Arc type, trapezoid type, and apple-core lesions were primarily associated with T1, T2, and T3/T4, respectively. When these criteria were used, the overall accuracy for T stage was 79%. They stated that a rough appearance was specific for T3/T4 lesions, but not sensitive. Filippone et al[13] reported that, in contrast-enhanced CT colonography, the overall accuracy of T staging using transverse image alone was 73%. The accuracy using both transverse and multiplanar reconstructed images improved to 83%.
Flor et al[14] reported that the accuracy for T3 or higher lesions using a wall deformity ≥ 50% (apple-core) on CT air enema was 93% and for fat abnormalities adjacent to the lesion on multiplanar reconstructions was 55%. They found that the presence of wall deformity ≥ 50%, regardless of the presence of fat abnormalities adjacent to the lesion, is highly predictive of stage T3 or higher[13]. Dual-energy CT with iodine mapping may be useful to detect colorectal cancer without bowel preparation or bowel distension. Since this is a less invasive approach, dual-energy CT may be a sensible option for elderly patient with colorectal cancer[15].
N staging by CT colonography
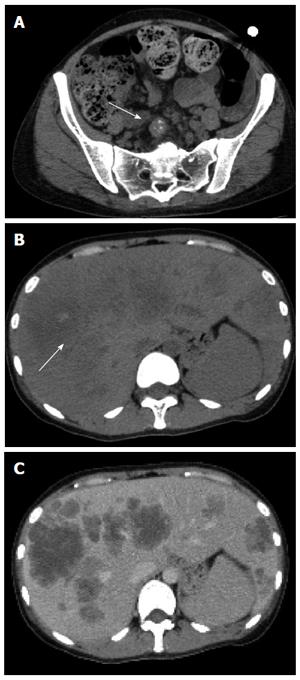
When lymph nodes have an irregular border or central necrosis, or form a collection or group with a tendency to adhere to each other, radiologists usually suspect metastatic lymphadenopathy. Metastatic lymph nodes in colorectal cancer often present with calcification, and CT scan is superior to detect calcified metastatic lymph nodes (Figure 1A). Metastatic lymph nodes tend to be more than 1cm in diameter and have a circular appearance. Large lymph nodes do not necessarily contain metastases. In the case of mucinous carcinoma, the inside of a metastatic lymph node shows low concentration due to mucus retention. When lymph nodes contain a very small amount of tumor, their form and density are usually unchanged, making it difficult or impossible to diagnose on imaging studies. Thus, metastatic lymph nodes are not detected as an abnormality, leading to a low diagnosis rate. The overall accuracy of the assessment of N stage on contrast enhanced CT colonography images has been reported from 59% to 71%[3,13]. Fractal dimension and heterogeneity could serve as new indicators of nodal status, and, aided by image analysis techniques, they might serve as objective criteria for discriminating between benign and malignant nodes in addition to long- and short-axis diameter, nodal density, solidity and area. Quantitative analysis holds promise for improving the prediction of lymph node status in rectal cancer[16].
Figure 1 Thirty year-old female with liver metastases from colorectal cancer.
A: Contrast-enhanced CT scan image. A lymph node metastasis often appears with calcifications, and CT is superior to detect these calcifications; B: Plain CT image. Arrow shows calcification of the tumor. Calcification is often seen in liver metastases; C: Contrast-enhanced CT scan image. Calcification is difficult to detect on contrast-enhanced CT. CT: Computed tomography.
Diagnosis of metastatic lesions by CT
CT scan is useful for the diagnosis of metastatic lesions in patients with colorectal cancer. CT is helpful for detecting metastatic lesions in the lung or liver as well as intra-peritoneal lesions. Intravenous contrast medium is mandatory for staging by CT scan. CT scan is superior in spatial resolution compared to other examinations. It is possible to create reconstructed or 3D images using the volume data from a CT scan. CT scan is useful not only for visualizing the presence of metastases in the liver but also to grasp the anatomical relations with the main blood vessels inside the liver. Liver metastases are detected by CT scan with a sensitivity of 85% and a specificity of 97%[17].
Liver metastases from colorectal cancer are depicted as hypoattenuated lesions on plain CT scan. The border of liver metastases on plain CT is usually indistinct. The density of the liver metastases is heterogeneous. The frequency of calcifications is about 10%-30% in liver metastases of the colorectal cancer (Figure 1B and C). Liver metastases from colorectal cancer are usually hypovascular. Ring enhancement is accepted in the arterial phase on enhanced CT, and is depicted as a low-density area in the portal venous phase. Multi-detector row CT detects many lesions, but a large number of these lesions does not allow a definitive diagnosis.
Pulmonary nodules identified by CT scan may include many benign lesions. Only one quarter of unspecified pulmonary lesions found on CT are demonstrated to be metastases, therefore the high sensitivity of CT does not always confer a benefit to the patient. This concept is supported by a recent study showing that preoperative staging chest CT is not beneficial for patients with colorectal cancer who do not have liver or lymph node metastases on abdominal and pelvic CT who had a negative initial colorectal cancer finding[1].
Dose reduction and image quality was evaluated in abdominal CT scans reconstructed with model-based iterative reconstruction compared with adaptive statistical iterative reconstruction in patients with cancer who have colorectal liver metastases. Model-based iterative reconstruction performed better than adaptive statistical iterative reconstruction at providing diagnostically acceptable CT images in the detection of colorectal liver metastases[18].
Anatomical relations with the main blood vessels
Laparoscopic colorectal surgery is a minimally invasive procedure, but a complicated technique. Therefore, prior to surgical resection, it is important to determine detailed anatomical information of a tumor. Laparoscopic colorectal surgery has been shown to have advantages over open surgery[19,20]. Imaging of vascular anatomy with 3D CT facilitates laparoscopic surgery, especially for right-sided lesions[21]. The mesenteric vessels have many branching patterns. The variation in the branching of the superior mesenteric artery and the superior mesenteric vein makes lymph node dissection in right-sided lesions difficult. Despite these well-known advantages, the laparoscopic resection of colorectal cancer still has significant limitations, including a limited operative field of view and lack of tactile sensation.
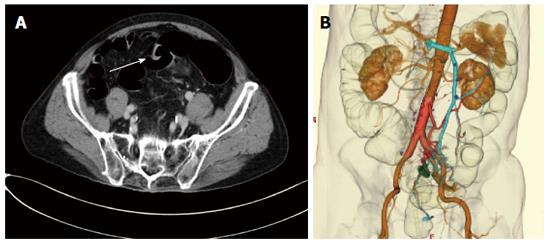
The inability to manipulate tissue and the limited visibility of the operative field hinder the identification of vessels and procedure-specific anatomical landmarks. This results in longer operating times and an increased risk of visceral and vascular injuries, especially for anatomical vascular variations and in obese patients. Intraoperative bleeding, difficulties in identifying the correct anatomy, and limited vision are major causes of intraoperative conversion of laparoscopic resection to open surgery[22]. Matsuki et al[23] devised a 3D-CT volume rendering imaging technique to analyze the vascular anatomy, referred to as visual CT Laparoscopy. Integrated 3D imaging clearly demonstrates the distribution of arteries feeding the colorectal cancer and the anatomical location of colorectal cancer and arterial and venous systems (Figure 2). Measurement of the distance between the aortic bifurcation and the origin of the inferior mesenteric artery and that between the base of the inferior mesenteric artery and the origin of the left colic artery on integrated 3D imaging contributed to safe, prompt ligation of the vessels and excision of lymph nodes. Preoperative 3D-CT is useful for understanding the anatomy to ensure a safe, precise operation.
Figure 2 Eighty year-old male with liver metastases from colorectal cancer.
A: Axial image shows a sigmoid cancer. It is depicted as square-like wall deformity (arrow); B: Three-dimensional CT imaging shows the feeding artery and draining vein. The left colic and sigmoid arteries become clear from the aortic root. CT: Computed tomography.
MAGNETIC RESONANCE IMAGING
T staging by MRI
Thin-section MRI with a phased array coil is widely used for T staging of rectal cancer, and is an established modality for the preoperative imaging of rectal cancer[24,25]. MRI can diagnose rectal wall laminar structure and show the details of the relationship of the tumor with the meso-rectal fascia and surrounding organs[26,27]. In locally advanced colon cancers, high resolution MRI might be useful. Patients with locally advanced colon cancer can be identified by MRI[28]. According to the criteria of American College of Radiology, MRI, as well as CT scan, is recommended for T staging of patients with colon cancer[29]. Endo-rectal ultrasound and endo-rectal MRI are established modalities for evaluation of the integrity of the rectal wall layers. However, these modalities have disadvantages due to their limited field of view, operator dependent sensitivity and high cost[30,31]. There is no consensus about whether an endorectal coil or a phased-array coil should be used routinely. With 3.0-Tesla MRI most imaging can be performed with only a pelvic phased array coil[24].
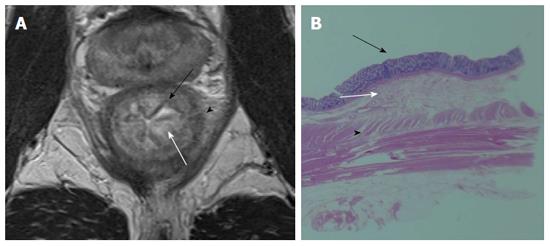
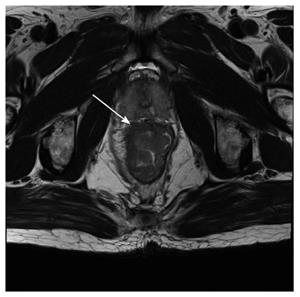
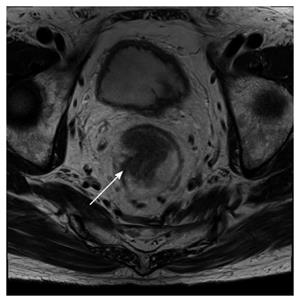
The current consensus does not favor the use of intravenous contrast material for the staging of primary rectal cancer[32,33]. The use of rectal contrast material in the staging of primary rectal cancer is controversial. Generally, 60-100 mL of warm ultrasound gel is inserted into the rectum using a balloon tube[34]. This technique may be useful for patients with polypoid tumors, small tumors (< 3 cm), or a history of prior resection or radiation therapy. However, in the evaluation of large tumors it does not provide any additional information[33]. Diffusion-weighted imaging is a promising sequence for evaluation of patients with primary rectal cancer. However, Feng et al[35] reported that there were no significant differences in diagnostic accuracy, sensitivity, or specificity between diffusion-weighted imaging and T2-weighted imaging regarding T-staging. High-resolution T2-weighted imaging is the key sequence for evaluation of primary rectal cancer. On T2-weighted imaging , the rectal wall mucosa is visualized by low signal intensity, the submucosa by high intensity, the muscularis propia by low intensity, the meso-rectum by high intensity, and the meso-rectal fascia by linear low signal intensity (Figure 3). Initially, some studies reported a high accuracy for MR imaging in T staging. However, these results have not been widely reproduced. Limitations include difficulty in differentiating fibrosis from tumor infiltration, which compromises the ability to distinguish early stage T3 tumors from stage T2 tumors[36] (Figures 4 and 5).
Figure 3 Mucosa is visualized by low signal intensity (black arrow), submucosa by high intensity (white arrow), and muscularis propria by low intensity (arrow head) on T2-weighted image (A) and pathological correlation between the resected specimen and magnetic resonance imaging (B).
Figure 4 Fifty-eight-year-old male with a pathologically-confirmed T3 tumor.
T2-weighted image demonstrates that the tumor invaded beyond the muscularis propria (arrow).
Figure 5 Seventy-four-year-old male with a pathologically-confirmed T2 tumor.
It is difficult to differentiate fibrosis from tumor infiltration beyond the muscularis propria (arrow).
The category pT3 was subdivided according to the histological measurement of the maximal tumor invasion beyond the outer border of the muscularis propria: pT3a (up to 5 mm) and pT3b (more than 5 mm). Lymph node negative pT3a and pT2 patients showed similar 5-year survival rates (91.2% vs 93.6%, respectively) as well as lymph node positive pT3a and pT2 patients (77.8% vs 82.8%, respectively)[37].
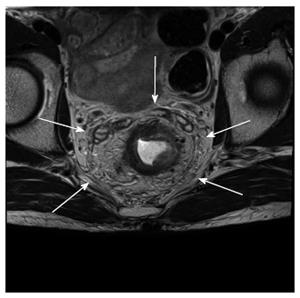
Another important point is the circumferential resection margin. MRI can differentiate malignant tissue from the muscularis propria with a clear delineation of the meso-rectal fascia (Figure 6). This information determines the circumferential resection margin for a total meso-rectal excision. Total meso-rectal excision is currently the standard surgical treatment of rectal cancer, and involves resection of the rectum and meso-rectum with an intact meso-rectal fascia. The frequency of recurrence is higher in patients with a positive circumferential resection margin (19%-22%) than in patients with a negative circumferential resection margin (3%-5%)[38]. The circumferential resection margin status is significantly associated with distant metastatic disease and predicts disease-free survival and local recurrence[39]. Consequently, reliable preoperative circumferential resection margin evaluation is vital to surgical planning.
Figure 6 Sixty-two-year-old male with rectal cancer.
The circumferential resection margin. Mesorectal fascia is visualized as a linear low signal intensity on T2-weighted imaging.
N staging by MRI
Many MR imaging studies of patients with colorectal cancer have used size as a criterion for predicting nodal involvement, although there is little consistency in the size used to discriminate between benign and malignant lymph nodes. A cutoff of a 10 mm maximal diameter gives high specificity but low sensitivity[17,40], but no particular size cutoff is useful in predicting lymph node status.
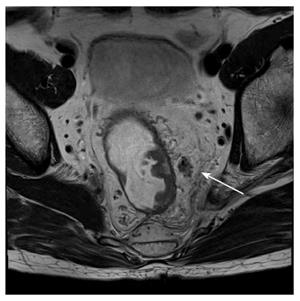
Prediction of lymph node involvement in patients with rectal cancer with MR imaging has improved by using the border irregularity and mixed intensity signal intensity of lymph nodes instead of size criteria (Figure 7). Superior accuracy was obtained and resulted in sensitivities 80%-85% and specificities 97%-98%[41,42].
Figure 7 Sixty-three-year-old male with a metastatic lymph node.
T2-weighted image demonstrates an ill-defined and mixed intensity pararectal lymph node.
Lymph node uptake of ultra-small particles of iron oxide has been proposed as a method for the accurate identification of normal and metastatic lymph nodes. Three-dimensional T2*-weighted imaging for border irregularity, short- and long-axis diameter, and estimated percentage (30%, 30%-50%, or 50%) of the white region within the lymph node is useful for predicting the presence of tumor in lymph nodes with ultra-small particles of iron oxide-enhanced MRI[43,44].
Diagnosis of liver metastases by MRI
Gadolinium ethoxybenzyl diethlenetriamine pentaacetic acid (Gd-EOB-DTPA) is a hepatocyte-specific contrast medium specifically taken up in the delayed phase, thereby providing increased lesion liver contrast. Small particles of iron oxide targets Kupffer cells and causes a marked signal loss on T2-weighted imaging. Gd-EOB-DTPA-enhanced MRI and small particles of iron oxide-enhanced MRI were more accurate than contrast-enhanced CT and contrast-enhanced-US for evaluation of liver metastasis in patients with colorectal cancer[45]. Kim et al[46] reported slightly better diagnostic accuracy with Gd-EOB--DTPA enhanced MRI (93.8% and 92.5%) compared to small particles of iron oxide-enhanced MRI (88.8% and 87.5%) by two independent readers but without statistical significance. However, Gd-EOB--DTPA enhanced MRI is superior to small particles of iron oxide-enhanced MRI in evaluating enhancement characteristics and vascularity of liver lesions during the dynamic arterial, portal, and late phases after a bolus injection[46].
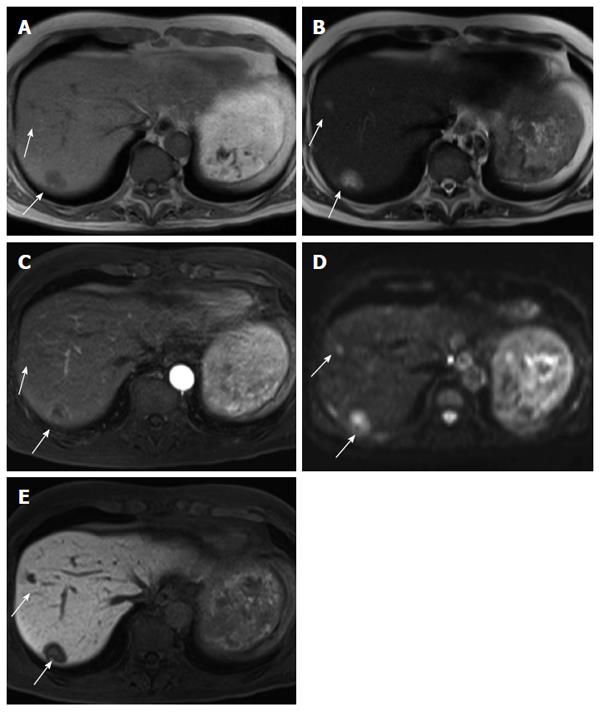
Small particles of iron oxide-enhanced MRI could be used for evaluation of patients with allergy to gadolinium-based contrast agents or for evaluation of patients with renal failure at risk of nephrogenic systemic fibrosis[47]. MRI findings of liver metastases are visualized by low intensity on T1-weighted imaging, intermediate intensity on T2-weighted imaging, marginal enhancement on early phase fat-suppressed T1-weighted imaging, high intensity on Diffusion-weighted imaging, low intensity on the hepatocyte-specific phase of Gd-EOB-DTPA-enhanced MRI (Figure 8). Small hemangiomas are often difficult to differentiate from metastases. Because hemangiomas do not take up Gd-EOB-DTPA, these lesions appear hypointense during the hepatocyte-specific phase; the same as liver metastases.
Figure 8 Sixty-four-year-old male with liver metastases (arrows).
A: Liver metastases show low intensity on T1-weighted image; B: Intermediate intensity on T2-weighted image; C: Marginal enhancement on early phase fat-suppressed T1-weighted image; D: High intensity on diffusion-weighted image; E: Low intensity on the hepatocyte-specific phase of gadolinium ethoxybenzyl diethlenetriamine pentaacetic acid-enhanced fat-saturated T1-weighted image.
High signal intensity on T2-weighted imaging provides an important clue as to the presence of a hepatic hemangioma[48]. However, some liver metastases do not show a typical enhancement pattern in the dynamic phase and demonstrate only intermediate signal intensity on T2-weighted images[49]. Gd-EOB-DTPA-enhanced shows lower arterial and higher late venous liver parenchymal enhancement and earlier washout compared with purely extracellular Gd- DTPA-enhanced MRI[50]. Most hepatic hemangiomas are hypointense relative to the surrounding liver parenchyma during the equilibrium phase and the hepatobiliary phase[51]. In a different way, Szurowska et al[52] reported that Gd-DTPA-enhanced MRI dose not improve diagnostic accuracy. They reported that unenhanced MR as a method of choice should directly follow ultrasound in course of diagnostic algorithm in differentiation of hemangiomas from other liver tumors like metastases. The T2 shine-through effect might be helpful in differentiating between hemangiomas and metastatic lesions[53].
Locally advanced rectal cancer after neoadjuvant treatment
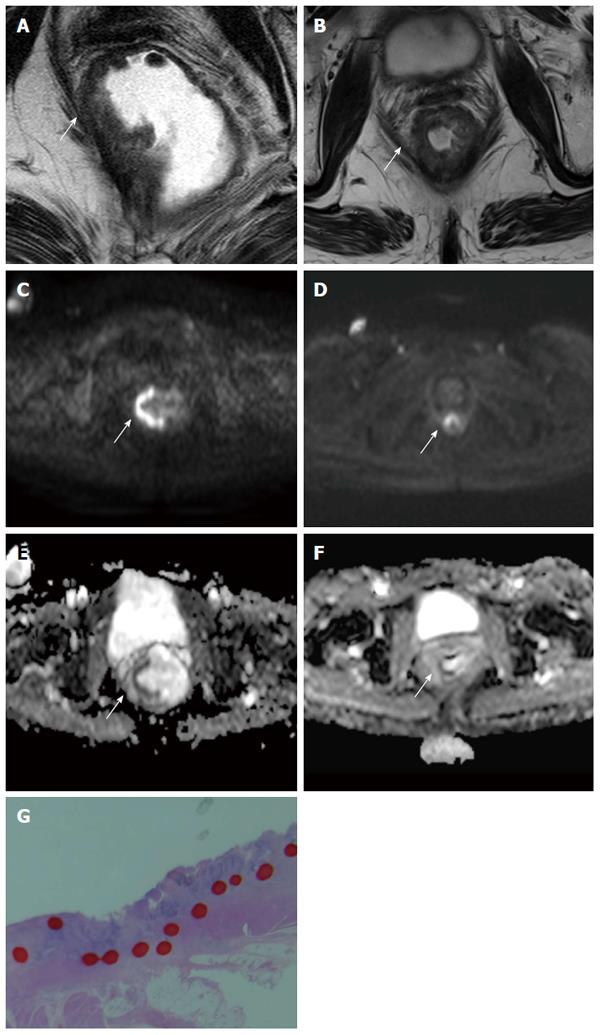
A recent meta-analysis demonstrated that MRI had inconsistent results in diagnostic performance for restaging rectal cancer after neoadjuvant treatment. Better results were demonstrated when using diffusion-weighted imaging and/or observers with > 5 years experience reading rectal/pelvic MRI[54] (Figure 9). Apparent diffusion coefficient (ADC) values of viable tumor were significantly lower than that of non-viable tumor[55]. Adding diffusion-weighted imaging to T2 weighted imaging improves the detection of tumor viability. Diffusion-weighted imaging is useful for the identification of patients with a complete response after neoadjuvant treatment[56]. MRI can provide valuable information when evaluating the eligibility of a patient to undergo minimally invasive treatment.
Figure 9 Seventy-one-year old female with advanced rectal cancer.
From (A) to (B), T2-weighted images show changes before and after chemo-radiation therapy. From (C) to (D), diffusion-weighted images show changes before and after chemo-radiation therapy. From (E) to (F), apparent diffusion coefficient maps show changes before and after chemo-radiation therapy. Tumor cell viability is visualized by diffusion-weighted images and apparent diffusion coefficient maps (arrow). The apparent diffusion coefficient value decreased obviously. This lesion pathologically confirmed remaining cancer cells. The apparent diffusion coefficient value is good indicator of cell viability; G: Area surrounded by the red dotted line confirmed remaining cancer cells in this patient.
PET/CT
PET/CT seems to be a useful tool in the evaluation of colorectal cancer by metabolically characterizing undetermined lesions suspected to be recurrent disease, to perform a complete pre-surgical staging and to identify occult metastatic disease. PET and PET/CT have been shown to change the therapy in almost a third of patients with advanced primary rectal cancer[57]. However since it is an expensive modality, its use in routine preoperative examinations is controversial. Currently, PET/CT is recommended only for the assessment of suspected recurrences of colorectal cancer and in pre-operative staging prior to metastasectomy. In contrast to plain PET/CT, PET/CT colonography is recommended in patients with obstructing colorectal cancers that cannot be traversed colonoscopically to obtain additional information[58].
T staging by PET/CT (colonography)
PET/CT is inappropriate to determine the exact depth of invasion of the primary tumor due to its limited resolution. Multi-detector row CT provides more accurate anatomical and structural information than PET. Therefore, T staging of colorectal cancer by PET/CT is almost completely reliant on CT. A standardized uptake value (SUV) max is more significantly related to tumor size than to T staging. It is important to compare the results of colonoscopy with PET/CT. And it is well known that the normal gastrointestinal tract can accumulate FDG extensively, hindering pathological focal tracer uptake or simulating the presence of a tumor. Physiological fluorodeoxyglucose gastrointestinal uptake may lead to misinterpretation. PET/CT colonography is useful for obstructive colorectal cancers that cannot be traversed colonoscopically. PET/CT colonography was able to localize synchronous colon cancers proximal to the obstruction precisely. There were no false-negative or false-positive proximal colorectal cancers by PET/CT colonography. Other preoperative examinations missed the synchronous colon cancers[58,59]. PET/CT colonography in conjunction with optical colonoscopy may be suitable strategy for staging of colorectal cancer[53].
N staging by PET/CT
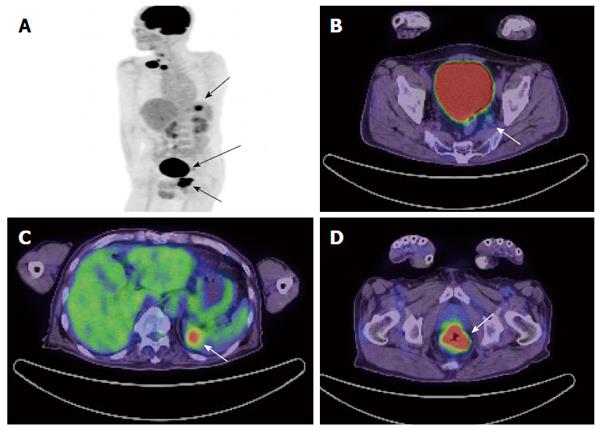
A recent meta-analysis demonstrates the diagnostic performance of PET scan in the preoperative assessment of nodal staging in patients with colorectal cancer[54]. The pooled estimates of sensitivity and specificity of PET/CT in the detection of preoperative lymph node involvement in patients with colorectal cancer were 42.9% and 87.9%, respectively. There is no definite evidence to support the routine clinical application of PET/CT to determine the lymph node involvement[60]. However, PET/CT could be used to strengthen the possibility of suspected metastatic lymph nodes detected by other imaging modalities. If SUV max is 2 or 3, pathologically metastatic lymph nodes were seen frequently (Figure 10). Clinical experience is needed to evaluate metastatic lymph nodes.
Figure 10 Sixty-four-year-old male with metastatic rectal cancer.
A: Maximum intensity projection image of PET shows the primary rectal lesion, metastasis of lateral lymph node and metastasis of spleen (arrow); B: PET/CT axial image shows a pathologically-confirmed metastasis of lateral lymph node with a SUVmax = 2.2 and diameter of 8 mm (arrow); C: PET/CT axial image shows metastasis of spleen (arrow); D: PET/CT axial image show primary rectal lesion (arrow). PET: Positron emission tomography; CT: Computed tomography; SUV: Standardized uptake value.
Liver metastases
The role of PET/CT for the detection of liver metastases is not clear. A meta-analysis of prospective studies demonstrates that the sensitivity estimates of CT, MRI and PET on a per-lesion basis were 74.4%, 80.3%, and 81.4%, respectively[61]. On a per patient basis, the sensitivities of CT, MRI and PET were 83.6%, 88.2%, and 94.1%, respectively. The per-patient sensitivity of CT was lower than that of PET (P = 0.025). However, the sensitivity of MR imaging improved after Gd-EOB-DTPA-enhanced MRI become common. Gd-EOB-DTPA-enhanced MRI has become a first line imaging modality. PET can be used as second-line modality because it is valuable in the evaluation of extra-hepatic disease[62].


