Published online Sep 15, 1996. doi: 10.3748/wjg.v2.iSuppl1.9
Revised: April 30, 1996
Accepted: September 1, 1996
Published online: September 15, 1996
- Citation: Chen JD. Spectral analysis of electrogastrogram and its clinical significance. World J Gastroenterol 1996; 2(Suppl1): 9-11
- URL: https://www.wjgnet.com/1007-9327/full/v2/iSuppl1/9.htm
- DOI: https://dx.doi.org/10.3748/wjg.v2.iSuppl1.9
In comparison with gastric manometry, the measurement of the electrogastrogram (EGG) is easier and more straightforward. Its analysis is, however, much more complicated than that of gastric manometry. Since the EGG is measured by cutaneous electrodes, it contains noise and electrical interferences from other parts of the body. Appropriate signal processing techniques have to be applied to extract useful information from the EGG. Spectral analysis is widely used for both qualitative and quantitative analysis of the EGG. The most important advantage of spectral analysis is its ability to separate the gastric signal from interferences or noise. In time domain (tracing), the interferences are superimposed on the gastric signal, hindering accurate analysis of the EGG. In frequency domain (spectrum), however, the signal and interferences are separated if their frequencies are different. The necessity of spectral analysis is raised by the fact that the EGG often contains gastric dysrhythmias and that gastric dysrhythmias are associated with gastric motor disorders. Accordingly, most investigators use EGG parameters exclusively derived from spectral analysis[1]. The most commonly used spectral parameters of the EGG are described as follows.
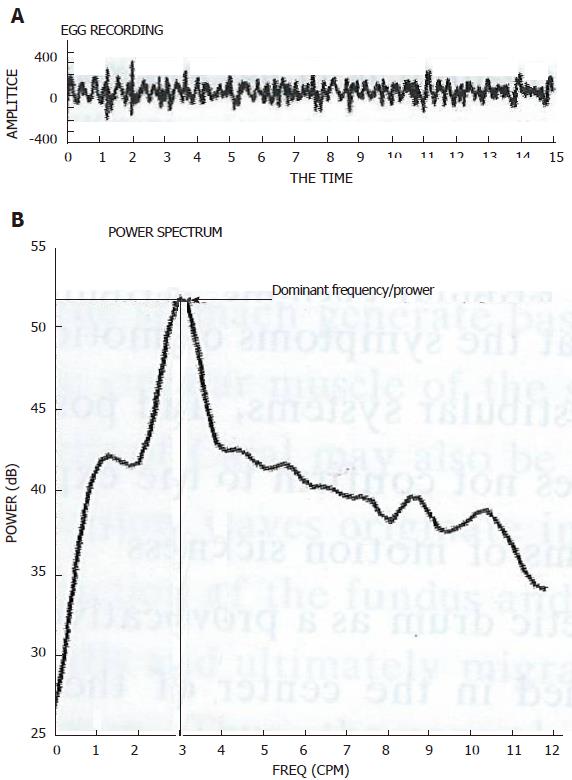
Although the EGG is a combination of the gastric signal and noise, its main component is the gastric signal. The frequency, which is believed to be of gastric origin and at which the power in the power spectrum has a peak value, is called the dominant frequency. Numerous studies have shown that the dominant frequency of the EGG accurately reflects the frequency of the gastric slow wave[2-4]. Figure 1 illustrates the definition of the dominant frequency and power of the EGG. The dominant frequency and power of the EGG can be computed from the power spectral density, which is defined as the squared magnitude of the Fourier transform of the infinite data sequence with appropriate statistical averaging. The power spectrum density is directly calculated from EGG data sequence. Table 1 summarizes the frequency components of the gastric slow waves which may be recorded in the EGG and their clinical implications. The dominant frequency of the EGG in asymptomatic, normal subjects is between 2.4 to 3.7 cycles per minute (cpm)[5]. The EGG with a dominant frequency of lower than 2.4 cpm is called bradygastria. The EGG with a dominant frequency of higher than 3.8 but lower than 9.0 cpm is called tachygastria. If there is no dominant peak in the spectrum, the EGG is called arrhythmia.
| Components | Freq (cpm) | |
| Signal | Gastric Slow Waves | 0.5-9.0 |
| Noise | Respiration | 12-24 |
| Small Bowel | 9-12 | |
| EKG | 60-80 | |
| Motion Artifacts | Whole Range |
The power in the power spectrum at the dominant frequency is called the EGG dominant power. The EGG dominant power is proportional to the regularity and amplitude of the gastric slow wave. It increases when the gastric slow wave becomes more regular or when there is an increase in the amplitude of the gastric slow wave. The absolute value of the EGG dominant power, however, may not be very meaningful. This is because it is associated with many factors, such as the position of the electrodes, the preparation of the skin, and the thickness of the abdominal wall. All these factors are difficult to control in an EGG study.
One of the most commonly used EGG parameters associated with EGG dominant power is the power ratio. The power ratio of the EGG is defined as the ratio of the dominant EGG power before and after a test meal or an intervention. In normal subjects, there is always an increase in EGG dominant power after a test meal. Different explanations have been given on the meaning of the postprandial power increase. This increase may be attributed to the increased gastric contractility and/or gastric distention. The postprandial increase of EGG dominant power seems to be a normal response of the EGG, but it is not necessarily an indicator of normal postprandial gastric motility. However, it is believed that a decrease of the EGG dominant power after a solid test meal has rarely been reported in normal subjects but frequently observed in patients with gastroparesis and patients with symptoms of nausea and vomiting. it is believed that a decrease of EGG dominant power after a normal test meal may be an indicator of postprandial gastric motility disorders. However, one should be fully aware of the consistency of the test meal, which may lead to different responses of the EGG.
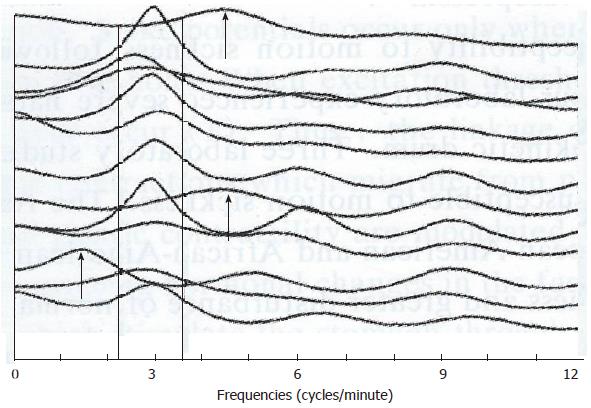
The percentage of normal slow waves is a quantative assessment of the regularity of the gastric slow wave measured from the EGG. It is defined as the percentage of time during which gastric normal slow waves are observed in the EGG. The percentage of normal gastric slow waves can be computed using one of the running spectral analysis methods, such as short time Fourier analysis or adaptive spectral analysis method[5]. One power spectrum is generated for every one or a few minutes of EGG data. The spectral peak in each spectrum is then examined visually. A spectrum is defined as normal if it has a clear peak in the 2.4 to 3.7 cpm range and abnormal if it does not show a clear peak in the 2. 4 to 3.7 cpm range. The percentage of normal slow waves is determined by computing the ratio between the number of normal spectra and the number of total spectra. Figure 2 presents an example for the computation of the percentage of normal slow waves. It is running power spectra of a 26-min EGG recording computed by the adaptive spectral analysis methos[6]. Each line in the figure from the bottom to the top stands for the power spectra of 2-min EGG data. It is seen that 10 of the 13 spectra have peaks in the range of 2.4 to 3.7 cpm. Accordingly, the percentage of normal slow waves is equal to 77%.
The percentage of gastric dysrhythmia is defined as the percentage of time during which gastric dysrhythmia is observed in the EGG. It can be computed in the same way as that for the percentage of normal gastric slow waves. If necessary, it can be further classified into the percentage of bradygrastria, the percentage of tachygastria, and the percentage of arrhythmia. For the EGG presented in Figure 2, there are three spectra which have peaks outside the normal gastric slow wave range. The percentage of gastric dysrhythmia is then equal to 23%.
Gastric dysrhythmias have been observed in a variety of clinical settings and are believed to be associated with gastric motor disorders. Thus, accurate detection of gastric dysrhythmias from the EGG is of great clinical significance. Tachygastria is associated with gastric hypomotility. The range of tachygastria frequently observed is between 2.8 and 9.0 cpm. Cautions should be made in distinguishing between tachygastria and harmonics of the fundamental frequency of the gastric slow wave. Sometimes, a review of both the running spectra and the original EGG tracing is necessary to determine whether a frequency peak at the double of the fundamental frequency if indicative of a tachygastral event.
The correlation between bradygastria and gastric motility is not yet as clear. Some investigators reported that bradygastria may be correlated with strong antral contractions, while others found it to be associated with gastric motor disorders. Some prokinetic agents such as erythromycin may decrease the frequency of the gastric slow wave to a level close to 2.0 cpm, but it may induce strong coordinated contractions in the stomach.
The instability coefficients were introduced to specify the stability of the dominant frequency and power of the EGG. It is computed based on the running power spectrum. Table 2 explains how they are defined and computed. For a 10-min EGG recording, running power spectra are computed using the adaptive spectral analysis method. The dominant frequency and power of the EGG during each 1-min period are presented in the Table. The means and the standard deviation of the dominant frequency and power during the 10-min period can be computed respectively. The instability coefficient (IC) is defined as the ratio between the standard deviation (SD) and the mean (M). IC = SD/M × 100%. In Table 2, the IC for the dominant frequency is 38%, and the IC for the dominant power is 7.8%.
| Time (min) | Frequency (cpm) | Power (dB) |
| 0-1 | 3.25 | 40.5 |
| 1-2 | 3.28 | 42.3 |
| 2-3 | 3.02 | 43.6 |
| 3-4 | 3.22 | 50.7 |
| 4-5 | 3.25 | 49.5 |
| 5-6 | 3.34 | 45.8 |
| 6-7 | 3.02 | 42.5 |
| 7-8 | 3.12 | 50.0 |
| 8-9 | 3.05 | 48.3 |
| 9-10 | 3.06 | 45.6 |
| Mean (SD) | 3.16 (0.12) | 45.9 (3.6) |
While the percentage of normal gastric slow wave specifies the regularity of the gastric slow wave, the instability coefficients reflect subtle changes of the gastric slow wave. A 100% normal EGG means that the frequency of the gastric slow wave is within the 2.4 to 3.7 cpm range during the whole recording period. However, it does not show any subtle variations of the dominant frequency within that specified range. The frequency instability coefficient is an dominant power within the recording period.
Original title: China National Journal of New Gastroenterology (1995-1997) renamed World Journal of Gastroenterology (1998-).
E- Editor: Liu WX
| 1. | Chen J, McCallum RW. EGG parameters and their clinical significance. In Electrogastrography: Principles and Applications. J Chen and RW McCallum (Editors). New York: Raven Press 1994; 49-73. |
| 2. | Smout AJ, van der Schee EJ, Grashuis JL. What is measured in electrogastrography. Dig Dis Sci. 1980;25:179-187. [RCA] [PubMed] [DOI] [Full Text] [Cited by in Crossref: 278] [Cited by in RCA: 248] [Article Influence: 5.4] [Reference Citation Analysis (1)] |
| 3. | Familoni BO, Bowes KL, Kingma YJ, Cote KR. Can transcutaneous recordings detect gastric electrical abnormalities. Gut. 1991;32:141-146. [RCA] [PubMed] [DOI] [Full Text] [Cited by in Crossref: 79] [Cited by in RCA: 91] [Article Influence: 2.6] [Reference Citation Analysis (0)] |
| 4. | Chen JD, Schirmer BD, McCallum RW. Serosal and cutaneous recordings of gastric myoelectrical activity in patients with gastroparesis. Am J Physiol. 1994;266:G90-G98. [PubMed] |
| 5. | Chen J, McCallum RW. Electrogastrography: Principles and Applications. New York: Raven Press 1994; . |
| 6. | Chen J, Vandewalle J, Sansen W, Vantrappen G, Janssens J. Adaptive method for cancellation of respiratory artefact in electrogastric measurements. Med Biol Eng Comput. 1989;27:57-63. [RCA] [PubMed] [DOI] [Full Text] [Cited by in Crossref: 60] [Cited by in RCA: 46] [Article Influence: 1.2] [Reference Citation Analysis (0)] |


