Published online Sep 15, 1996. doi: 10.3748/wjg.v2.i3.155
Revised: July 1, 1996
Accepted: August 16, 1996
Published online: September 15, 1996
AIM: To study the quantitative ultrastructure of neuroendocrine cells of the gastric mucosa in normal and pathological conditions, including the duodenal ulcer (DU) and Zollinger-Ellison syndrome (ZES).
METHODS: The neuroendocrine cells of the gastric mucosa of eight normal subjects, six patients with DU, and five patients with ZES were quantitatively investigated with by electron microscopy and ultrastructure image analysis.
RESULTS: The volume density of neuroendocrine (NE) cells in the DU was 1.3% and 0.8% (vs 1.6% and 0.9%, P < 0.05) in gastric antrum and corpus, respectively. In the antrum, G cells were 65% (P < 0.05), D cells decreased in cell density (3% vs 9.5%) and in number per unit area (P < 0.01). In the corpus, the cell density of enterochromaffin-like (ECL) cells increased (49% vs 30%, P < 0.05); D cells and enterochromaffin (EC) cells decreased (2%, P < 0.01 and 4%, P < 0.05, respectively), and the number of D cells per unit area markedly decreased. In ZES, D cells in the corpus decreased in cell density (4% vs 22%, P < 0.01), and P cells also decreased (11% vs 24%, P < 0.05). The density of ECL cells increased (65% vs 30%, P < 0.01).
CONCLUSION: In DU and ZES, both the number and type of NE cells presented some changes. Increased gastrin in DU and ZES patients may be caused by the decrease of D cells and somatostatin secretion.
- Citation: Yu JY, Adda T. Quantitative ultrastructure analysis of neuroendocrine cells of gastric mucosa in normal and pathological conditions. World J Gastroenterol 1996; 2(3): 155-157
- URL: https://www.wjgnet.com/1007-9327/full/v2/i3/155.htm
- DOI: https://dx.doi.org/10.3748/wjg.v2.i3.155
Quantitation has increasingly become a fundamental supplement of investigations on gastric endocrine cells[1]. In humans, up to six cell types [enterochromaffin-like (ECL), enterochromaffin (EC), D, P, D1 and X] in oxyntic mucosa and four endocrine cell types (G, D, P and EC)[2] in antrum mucosa have been identified. However, the secretory product of some cell types is either unknown or requires non-conventional tissue processing, thus preventing the use of immunohistochemistry. We have developed an ultrastructural morphometric procedure for quantitative assessment of endocrine cells of human gastric mucosa in normal and pathological conditions.
The material was obtained from eight healthy volunteers equally divided by sex, aged 19 years to 34 years, on whom the study of normal gastric endocrine cells was performed. Endoscopic biopsies were performed in the central area of the posterior wall of the gastric corpus and antrum on six patients with duodenal ulcer (DU) aged 31 years to 57 years, and five patients with Zollinger-Ellison syndrome (ZES) aged 36 years to 62 years. The samples were fixed in a glutaraldehyde-paraformaldehyde mixture and cut with a razor blade to obtain slices of mucosa sections perpendicular to the gastric surface. These fragments were post fixed in osmium tetroxide, dehydrated in acetone and embedded in Araldite. Four to five blocks from different biopsy specimens including the whole thickness of the mucosa were selected at random. The blocks were trimmed to examine the entire thickness of the mucosa. Thin sections were collected with formvar-coated Robertson multiple slot grids, stained and examined with the electron microscope. Measurements were made under low power (× 760) electron micrographs mounted to cover the entire thickness of the mucosa between two bars of the grid, and under high power (× 13700) electron micrographs to cover all endocrine cell profiles in the same area. By using an ultrastructural quantitative analysis (GmbH German Str), the relative volumes of the epithelial component and the lamina propria were estimated with low power micrographs whereas morphometric analysis of endocrine cells was performed with high power micrographs.
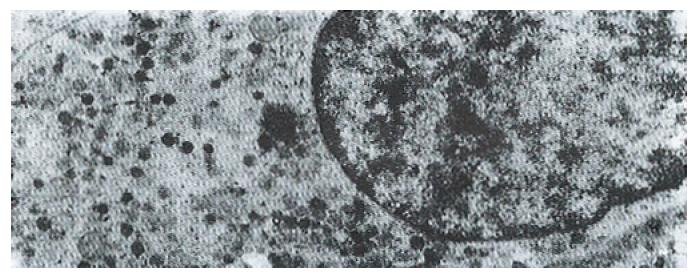
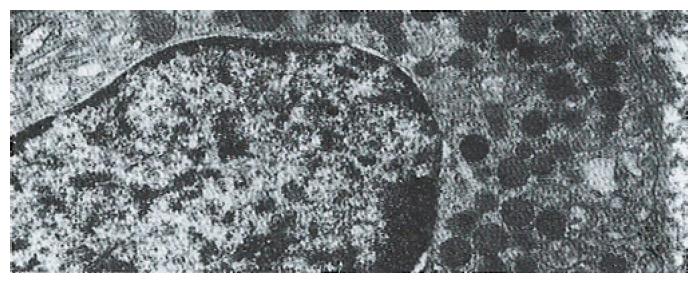
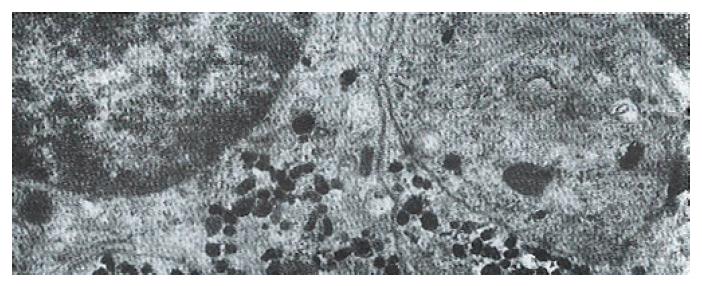
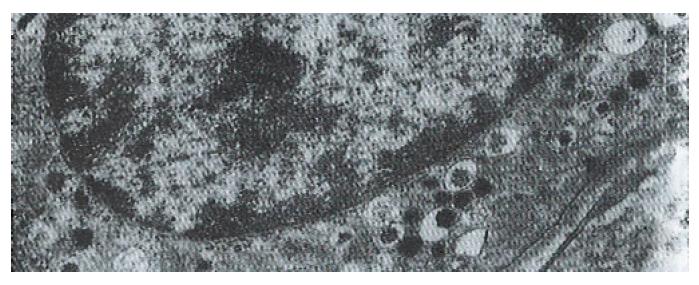
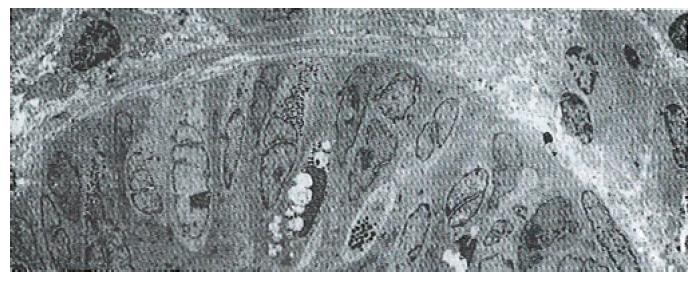
The volume densities of different endocrine cells depended on the amount of the measured lamina propria, which was 26% in our estimation in normal subjects, but 33% in the patients with ZES (p < 0.01) and 32% in the patients with DU (p < 0.05). Such differences, which were statistically significant, were related to inflammatory changes in the upper region of the lamina propria occurring in pathological conditions. For this reason, the epithelial compartment alone has to be kept as the reference volume for endocrine cell densities in comparative studies. Ultrastructural characteristics[3] of secretory granules in different types of gastric endocrine cells including G, D, P, EC and ECL cells are shown in Figure 1, Figure 2, Figure 3, Figure 4, Figure 5.
Table 1 shows the quantitative ultrastructural data of the mucosa in the antrum and corpus from normal male subjects. The volume density of endocrine cells in corpus mucosa in patients with ZES was 3.2% of the mucosal epithelial component, a 168% increase (p < 0.01) over the value found in normal subjects (Table 2). This result is evidence for a net increase in the total volume of endocrine cells of corpus mucosa augmented in ZES. In all the cases, the ECL cells composed more than 50% of the whole endocrine cell mass. As shown in Table 2, the mean volume fraction of this cell type was 65%, a 119% increase over the normal value. In contrast, other cell types of endocrine cells showed a mean volume fraction lower than that found in normal subjects, a difference statistically significant in the case of D and P cells.
| Cell type | Volume fraction (%) | Profiles/unit area (n/m2) | Cytoplasm composition (%) | Granule constituents (%) |
| Antrum | ||||
| NE | 1.6 ± 0.5 | |||
| G | 65.0 ± 2.0 | 2.4 ± 0.8 | 75.0 ± 3.0 | 16.0 ± 9.0 |
| D | 9.5 ± 0.6 | 0.3 ± 0.8 | 81.0 ± 4.0 | 35.0 ± 6.0 |
| EC | 8.6 ± 2.9 | 0.3 ± 0.7 | 76.0 ± 12.0 | 18.0 ± 7.0 |
| Remaining cells | 16.9 ± 3.2 | 0.6 ± 0.6 | 77.0 ± 8.0 | 3.8 ± 2.9 |
| Corpus | ||||
| NE | 0.9 ± 0.4 | |||
| ECL | 30.0 ± 9.0 | 1.6 ± 0.7 | 70.0 ± 2.0 | 8.0 ± 2.0 |
| EC | 7.0 ± 5.0 | 0.3 ± 0.2 | 72.0 ± 13.0 | 16.0 ± 8.0 |
| D | 22.0 ± 4.0 | 1.5 ± 0.8 | 81.0 ± 7.0 | 31.0 ± 5.0 |
| P | 24.0 ± 7.0 | 0.8 ± 0.3 | 72.0 ± 7.0 | 6.0 ± 2.0 |
| Remaining cells | 17.6 ± 8.0 | 0.9 ± 0.5 | 68.0 ± 19.0 | 3.2 ± 2.6 |
| Cell type | Volume fraction (%) | Profiles/unit area (n/m2) | Cytoplasm composition (%) | Granule constituents (%) |
| Antrum | ||||
| NE | 3.2 ± 1.1 | |||
| ECL | 65.0 ± 15.0d | 5.2 ± 2.4c | 82.0 ± 2.0d | 5.0 ± 2.0c |
| EC | 5.0 ± 2.0 | 0.7 ± 0.5 | 80.0 ± 13.0 | 6.0 ± 9.0a |
| D | 4.0 ± 4.0d | 0.6 ± 0.4 | 75.0 ± 14.0 | 18.0 ± 5.0d |
| P | 11.0 ± 8.0a | 1.1 ± 0.4 | 76.0 ± 7.0 | 3.0 ± 0.5b |
| Remaining cells | 10.0 ± 3.0 | 2.8 ± 1.5 | 78.0 ± 9.0 | 1.6 ± 0.8 |
In this series of DU patients (Table 3), the mean volume density of the whole endocrine cell population was 1.6% and 0.8% in the gastric antrum and corpus, respectively, which did not differ significantly from that of healthy subjects. In the antrum, D cells decreased in cell density and in number per unit area, as well as in the corpus. The mean volume fraction of ECL cells was found to be increased 49%.
| Cell type | Volumefraction (%) | Profiles/unitarea (n/m2) | Cytoplasmcomposition (%) | Granuleconstituents (%) |
| Antrum | ||||
| NE | 1.3 ± 0.2 | |||
| G | 46.0 ± 2.0 | 1.8 ± 0.7 | 71.0 ± 3.0 | 16.0 ± 9.0 |
| D | 3.0 ± 1.6a | 0.1 ± 0.8b | 87.0 ± 4.0a | 28.0 ± 12.0 |
| EC | 16.0 ± 6.5 | 0.6 ± 0.7b | 77.0 ± 12.0 | 12.0 ± 5.0 |
| Remaining cells | 35.0 ± 13.0 | 1.2 ± 1.5 | 81.0 ± 8.0 | 3.8 ± 2.9 |
| Corpus | ||||
| NE | 0.8 ± 0.3 | |||
| ECL | 49.0 ± 16.0a | 1.7 ± 1.0 | 70.0 ± 5.0 | 5.0 ± 2.0a |
| EC | 4.0 ± 2.0 | 0.3 ± 0.2 | 72.0 ± 24.0 | 8.0 ± 8.0 |
| D | 2.0 ± 4.0a | 0.3 ± 0.3c | 93.0 ± 6.0a | 33.0 ± 4.0 |
| P | 25.0 ± 4.0 | 1.7 ± 1.0 | 67.0 ± 5.0 | 3.0 ± 1.0 |
| Remaining cells | 20.0 ± 12.0 | 1.9 ± 1.5 | 81.0 ± 9.0 | 3.2 ± 2.8 |
From the morphometric point of view, absolute counts of cells, usually restricted to nucleated sections, have commonly been used. The frames of reference for these counts, however, include visual fields, unit length of mucosa, unit area of tissue section, unit area of mucosa surface, gland crypt, nucleus-containing gland cells, and whole antrum or whole stomach. Such heterogeneity makes comparisons between different studies difficult, and occasionally opposite results would be achieved. Direct counts of endocrine cells from pelleted cell suspensions of gastric mucosa have also been proposed[4]. With this background in our laboratory, we have developed an ultrastructural morphometric procedure for quantitative assessment of endocrine cells of human gastric mucosa in normal and pathological conditions. In ECL cells of ZES patients, the number of cell profiles per unit area, the cross section area and the cytoplasmic values were tested. These data supported the previous observations that both hyperplasia and hypertrophy occurred in the oxyntic endocrine cells in the pathological condition. Secretory granules were not restricted to ECL cells, but were shared by the other cell types, which were significant in the case of P, D, and EC cells[5]. On the basis of experimental evidence obtained from the rat, reduction of the granule volume density in corpus endocrine cells could be regarded as a sign of gastrin induction increase in functional activity, which was associated with activation of the specific enzyme, histidine decarboxylase[6]. Therefore, our studies supported a similar result about the functional activity of gastrin in humans involving cell types that were not influenced by the stimulus of gastrin.
In this series of DU patients, the mean volume density of the endocrine cells of gastric mucosa did not differ significantly from that of normal subjects. In contrast, the mean volume fraction of ECL cells was increased. The volume fraction of D cells markedly decreased. Although age influences cannot be ruled out, such changes are possibly relevant to the pathophysiology of the DU disease[7]. In this regard, it is pertinent to note that the gastric mucosa of DU patients releases significantly lower amounts of somatostatin[8]. Our results, therefore, provide a cellular basis for this functional deficiency and suggest a reduced paracrine control of gastric secretion in this pathological condition.
From the above discussions, it can be concluded that ultrastructural morphometry is a useful tool for investigating endocrine cells of human gastric mucosa. Indeed, it allows identification of all cell types composing the gastric endocrine cell population. Recently developed stereological procedures, such as the selector or the nucleator, may efficiently supplement the data provided here with unbiased estimates of absolute structural quantities, including cell volume, thus opening new dimensions to the ultrastructural morphometry of gastric endocrine cells.
| 1. | D’Adda T, Bertelé A, Pilato FP, Bordi C. Quantitative electron microscopy of endocrine cells in oxyntic mucosa of normal human stomach. Cell Tissue Res. 1989;255:41-48. [RCA] [PubMed] [DOI] [Full Text] [Cited by in Crossref: 34] [Cited by in RCA: 37] [Article Influence: 1.0] [Reference Citation Analysis (0)] |
| 2. | Solcia E, Capella C, Vassallo G, Buffa R. Endocrine cells of the gastric mucosa. Int Rev Cytol. 1975;42:223-286. [RCA] [PubMed] [DOI] [Full Text] [Cited by in Crossref: 236] [Cited by in RCA: 214] [Article Influence: 4.2] [Reference Citation Analysis (0)] |
| 3. | Bordi C, Ferrari C, D’Adda T, Pilato F, Carfagna G, Bertelé A, Missale G. Ultrastructural characterization of fundic endocrine cell hyperplasia associated with atrophic gastritis and hypergastrinaemia. Virchows Arch A Pathol Anat Histopathol. 1986;409:335-347. [RCA] [PubMed] [DOI] [Full Text] [Cited by in Crossref: 31] [Cited by in RCA: 29] [Article Influence: 0.7] [Reference Citation Analysis (0)] |
| 4. | Moore C, Saik RP. Total counts of antral gastrin cells: a simple direct method. Stain Technol. 1985;60:137-144. [RCA] [PubMed] [DOI] [Full Text] [Cited by in RCA: 1] [Reference Citation Analysis (0)] |
| 5. | Kobayashi S, Fujita T, Sasagawa T. Electron microscope studies on the endocrine cells of the human gastric fundus. Arch Histol Jpn. 1971;32:429-444. [RCA] [PubMed] [DOI] [Full Text] [Cited by in Crossref: 28] [Cited by in RCA: 25] [Article Influence: 0.5] [Reference Citation Analysis (0)] |
| 6. | Alumets J, El Munshid HA, Håkanson R, Liedberg G, Oscarson J, Rehfeld JF, Sundler F. Effect of antrum exclusion on endocrine cells of rat stomach. J Physiol. 1979;286:145-155. [RCA] [PubMed] [DOI] [Full Text] [Cited by in Crossref: 51] [Cited by in RCA: 52] [Article Influence: 1.1] [Reference Citation Analysis (0)] |
| 7. | Green DM, Bishop AE, Rindi G, Lee FI, Daly MJ, Domin J, Bloom SR, Polak JM. Enterochromaffin-like cell populations in human fundic mucosa: quantitative studies of their variations with age, sex, and plasma gastrin levels. J Pathol. 1989;157:235-241. [RCA] [PubMed] [DOI] [Full Text] [Cited by in Crossref: 23] [Cited by in RCA: 17] [Article Influence: 0.5] [Reference Citation Analysis (0)] |
| 8. | Ligumsky M, Wengrower D, Karmeli F, Rachmilewitz D. Somatostatin release by human gastric mucosa. Studies in peptic ulcer disease and pernicious anemia. Scand J Gastroenterol. 1988;23:687-690. [PubMed] |
Original title:
S- Editor: Cao LB L- Editor: Filipodia E- Editor: Li RF


