INTRODUCTION
Glucagon-like peptide-1 (GLP-1) which is released from L-cells in the intestine plays an important role in postprandial glucose homeostasis[1]. With the recent advent of anti-diabetic drugs aimed at either mimicking GLP-1 or preventing its degradation, researchers have turned their attention toward the L-cell and have focused on determining whether it would be both possible and beneficial to stimulate the endogenous release of GLP-1. This approach requires an understanding of the mechanisms underlying GLP-1 release from L-cells.
GLP-1 is involved in the regulation of nutrient homeostasis through insulinotropic effects on the β-cell as well as inhibition of glucagon release and gastric emptying and induction of satiety[1,2]. Most L-cells that secrete GLP-1 are located in the distal small intestine and colon[3]. GLP-1 release from L-cells is regulated by nutrient ingestion and demonstrates a biphasic pattern of secretion in response to either mixed meals or carbohydrate or fat alone[4,5]. The first phase of GLP-1 secretion is regulated by neural signals originating in the proximal intestine, within minutes after a meal[6-8]. In contrast, the second phase is induced by direct nutrient stimulation of the L-cells, resulting in secretion of GLP-1[9-11]. In addition, in vitro studies using primary rat L-cells in culture have shown that the GLP-1 response to fat is highly specific, requiring mono-unsaturated fatty acids (MUFAs) with a chain length of 16 or more carbons (e.g., palmitoleic acid, 16:1 or oleic acid, 18:1). Mono-unsaturated long-chain fatty acids, such as oleic acid, are strong stimulators of GLP-1 secretion from L-cells[9].
Uncoupling protein 2 (UCP2), a member of the UCP family, is located in the inner mitochondrial membrane and induces proton leakage and regulates the production of reactive oxygen species (ROS)[12-14]. UCP2 plays an important role in α-cell dysfunction that is induced by free fatty acids (FFAs) in vitro, which may be related to its effects on oxidative stress and the insulin signaling pathway[15]. UCP2 is also involved in the effect of FFAs on β cells, as FFAs stimulate both the expression and activity of UCP2 in α cells[15-17]. When FFA stimulates UCP2 over-expression, the negative effects of UCP2 on ATP production result in the suppression of insulin secretion in β cells[18]. Long-term exposure to FFAs also stimulates the release of glucagon and GLPs in a time- and dose-dependent manner in α cell lines[19]. UCP2 is also believed to be involved in this effect in α cells. A chronic high concentration of FFAs impairs the function of both β and α cells, and this impairment involves UCP2[16]. It is not, however, known whether UCP2 has similar effects on L-cells. In this study, we investigated the effect of oleic acid on the expression of UCP2 in human NCI-H716 cells, an L-cell model, and the effect of UCP2 down-regulation on GLP-1 secretion in these cells.
MATERIALS AND METHODS
NCI-H716 cell culture and secretion studies
Human enteroendocrine NCI-H716 cells were maintained in suspension culture as described by the American Type Culture Collection. Two days before an experiment, cells were seeded into 12-well culture plates precoated with Matrigel as described[20]. On the day of the experiment, the medium was replaced by PBS containing 1 mmol CaCl2 and dipeptidyl peptidase IV inhibitor, adjusted to pH 7.2 (Millipore Corporation, Bedford, MA, United States). Cells were incubated at 37 °C for 2 h with or without different oleic acid concentrations (0, 2, 4, 6, 8, 10 mmol) and RNA interference targeting UCP2 (see below). GLP-1 was measured by enzyme linked immunosorbent assay (ELISA) (see below).
Small interfering RNA preparation and NCI-H716 cell transfection
The siRNA sequences targeting UCP2 (siUCP2) and a non-specific control small interfering RNA (siRNA) were purchased from Shanghai Shinegene Molecular Biotechnology Co., Ltd. (Shanghai, China). NCI-H716 cells were 70% confluent in 250 μL of complete RPMI 1640 medium. Transfections of siRNA (at a final concentration of 300 nmol) were performed in NCI-H716 cells using Lipofectamine 2000 according to the manufacturer’s protocol (Life Technologies, Carlsbad, CA, United States). Cells were usually examined 48 h after transfection.
Localization of uncoupling protein-2 and GLP-1 in NCI-H716 cells
The antibodies used for immunofluorescence staining in NCI-H716 cells were anti-GLP-1 (C-17; Santa Cruz) and anti-UCP2 (LS-B1911; LifeSpan Bio-Sciences). Cells were grown on coverslips, fixed in 4% paraformaldehyde in PBS for 10 min, washed with PBS, and cooled in 100% methanol at -20 °C for 20 min. Cells were then washed with PBS and permeabilized with 0.1% Triton X-100 for 10 min. After blocking with Dako blocking solution, primary antibody (anti-GLP-1; 1:100) was added and incubated at 4 °C overnight. For the secondary antibody, Cy3-conjugated donkey anti-goat (1:200; red, Beyotime Institute of Biotechnology) was incubated for 30 min at room temperature in the dark. The cells were washed with phosphate buffer saline (PBS), and anti-UCP2 (1:50) was added and incubated at 4 °C overnight. For the secondary antibody, fluorescein isothiocyanate-conjugated goat anti-rabbit (1:200; green, Beyotime Institute of Biotechnology) was added for 30 min at room temperature in the dark. Cells were then incubated for 45 min with Hoechst stain to counterstain nuclei. After a final wash with PBS, the coverslips were mounted with Slow-Fade Antifade kit (Molecular Probes).
RNA isolation and quantitative reverse transcription-polymerase chain reaction
Reagents used for RNA isolation and quantitative reverse transcription-polymerase chain reaction (qRT-PCR) included TRIzol Reagent, oligo(dT)18 primers, and AMV reverse transcriptase (all from Invitrogen, Carlsbad, CA, United States) and primers and TaqMan probes (Shanghai Shinegene Molecular Biotechnology). Total cellular RNA was extracted with TRIzol Reagent. The purity and concentration of RNA was determined by measuring the absorbance at 260 and 280 nm, with A260/A280 > 1.7 considered sufficient purity[21]. RNA (1 μg) was reverse-transcribed into cDNA using oligo(dT)18 primers at 42 °C for 1 h. Quantitative RT-PCR was performed with the ABI Prism 7000 sequence detection system (Applied Biosystems, Foster City, CA, United States) using TaqMan probes; threshold cycle numbers were obtained by ABI Prism 7000 SDS software, version 1.0. The primer and probe sequences used in this study were as follows: UCP2 gene (sense primer, 5’-CCAATGTTGCCCGWAATG-3’; antisense primer, 5’-TGAGGTTGGCTTTCAGGAG-3’; probe, 5’-FAM+CTGGTGACCTATGACCTCATCAAAG-3’); β-actin gene (sense primer, 5’-GGCACCACACYTTCTACAATG-3’; antisense primer, 5’-GGGGGTGT TGAAGGTCTCAAAC-3’; probe, 5’-FAM+TGT GGCCCCTGAGGAGCACCC-3’).
Amplification conditions were one cycle at 95 °C for 5 min, followed by 40 cycles at 95 °C for 30 s and 60 °C for 1 min, and one final cycle at 72 °C for 4 min.
Western blot analysis
Mitochondrial proteins from NCI-H716 cells were isolated with 1 mL of extraction buffer (250 mmol sucrose; 1 mmol ethylenediaminetetraacetic acid; 10 mmol Tris, pH 7.4) supplemented with protease inhibitors (Sigma). The mixture was centrifuged at 800 ×g for 10 min. The supernatant was centrifuged at 10 000 ×g for 10 min, and the mitochondrial pellet was resuspended in 25 μL of N-Tris(hydroxymethyl)methyl-2-aminoethanesulfonic acid buffer. Mitochondrial protein concentration was determined colorimetrically with the BCA Protein Assay (Pierce, Rockford, IL, United States). Mitochondrial proteins (15 μg) were mixed with 3 × sample buffer [0.5 mol phosphate buffer, pH 7.0; 30% (w/v) glycerol; 7.5% (w/v) SDS; 0.75 mmol bromophenol blue], boiled for 5 min, and electrophoresed on an SDS-PAGE gel (12.5% acrylamide). Proteins were then transferred to Immobilon PVDF membranes (Millipore). UCP2 proteins were detected with polyclonal anti-UCP2 (LifeSpan Bio-Sciences) at a dilution of 1:600 followed by incubation with horseradish peroxidase-conjugated goat anti-rabbit IgG secondary antibody (Santa Cruz) at a dilution of 1:2000 and detection with enhanced chemiluminescence (ECL detection system; NEN, Boston, MA, United States). To validate equal protein loading across various lanes, PVDF membranes were stripped and re-probed with polyclonal anti-cytochrome c (Santa Cruz Biotechnology) at a dilution of 1:1000.
GLP-1 measurement
The level of active GLP-1, GLP-1 (7-36) amide, was measured with an ELISA kit (Linco). This assay relies on a monoclonal antibody fixed in a coated micro-well plate that binds to the N-terminal region of active GLP-1. The concentration of active GLP-1 is proportional to the fluorescence generated by umbelliferone, which is produced by alkaline phosphatase-catalyzed hydrolysis of methyl umbelliferyl phosphate (conjugated to GLP-1 monoclonal antibodies). Samples of the cell culture medium were collected, and dipeptidyl peptidase IV inhibitor (10 μL/mL) was added to prevent GLP-1 degradation. Samples (100 μL each) were added to individual assay wells. The ELISA has a working range of 2 to 100 pmol/L (according to Linco GLP-1 ELISA kit). Each sample was replicated three times.
Statistical analysis
Data are presented as the mean ± SE. Statistical significance was calculated by a one-way ANOVA and unpaired two-tailed t test. P values < 0.05 were regarded as significant.
RESULTS
Localization of uncoupling protein-2 and GLP-1 in NCI-H716 cells
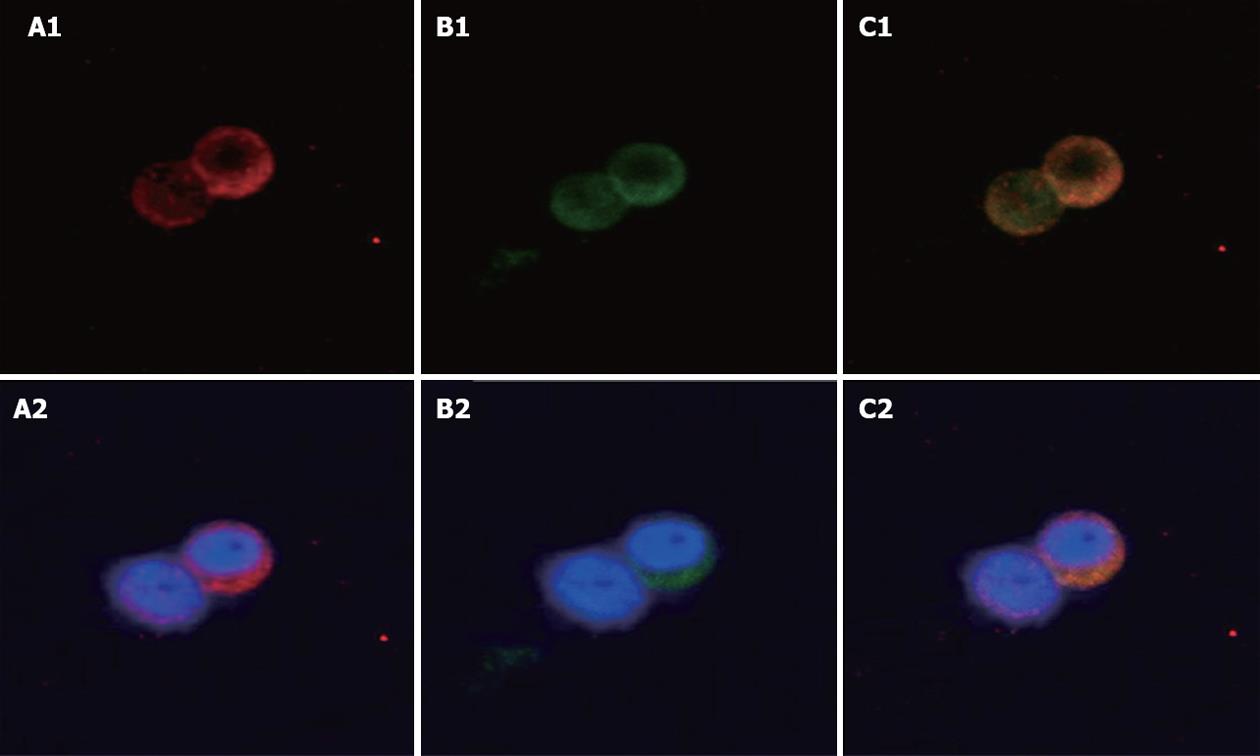
The localization of UCP2 and GLP-1 was studied in the human cell line NCI-H716, which serves as a model for intestinal L-cells. Immunofluorescence staining for GLP-1 was observed in the cytoplasm in NCI-H716 cells (Figure 1A1 and A2). Immunofluorescence staining for UCP2 was also observed in the cytoplasm in human NCI-H716 cells (Figure 1B1 and B2). Both GLP-1 and UCP2 granules were expressed mainly in the cytoplasm. Thus L-cells that expressed GLP-1 were also able to express UCP2. Merged picture, yellow staining shows co-expression of GLP-1 and UCP2 (Figure 1C1 and C2).
Figure 1 Localization of uncoupling protein-2 and glucagon-like peptide-1 in NCI-H716 cells.
Immunofluorescence staining in human NCI-H716 cells which serve as a model for L-cells. A1, A2: Glucagon-like peptide-1 (GLP-1) antibody staining (red); B1, B2: Uncoupling protein-2 (UCP2) antibody staining (green); C1, C2: Merged image shows co-expression of UCP2 and GLP-1. Blue (Hoechst) staining indicates the nuclei. Original magnification, ¡Á 400.
Oleic acid increases GLP-1 secretion in NCI-H716 cells
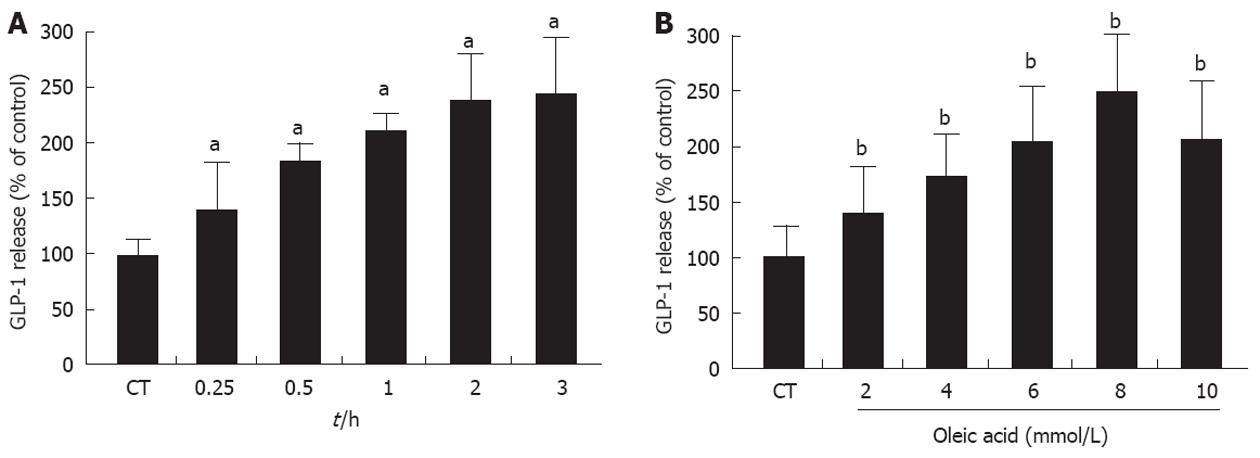
The possible effect of UCP2 on the secretion of GLP-1 which is induced by oleic acid in the intestinal enteroendocrine L-cell was investigated. Time-course experiments revealed that GLP-1 release from NCI-H716 cells into the medium peaked 120 min after treatment with oleic acid (the release of GLP-1 increased approximately 2.3-fold of the baseline value by treatment with oleic acid; P < 0.05) and maintained a stable plateau until at least 180 min after treatment (Figure 2A). In a dose-dependent experiment, oleic acid significantly increased GLP-1 secretion to a maximum of 2.5 ± 0.3-fold of baseline levels at 8 mmol (P < 0.01); 10 mmol oleic acid led to a less robust increase in GLP-1 expression (Figure 2B). These results indicated that oleic acid led to a concentration-dependent release of GLP-1 from NCI-H716 cells (final concentration of oleic acid ≤ 8 mmol).
Figure 2 Glucagon-like peptide-1 secretion in NCI-H716 cells after treatment with oleic acid.
A: Time course of oleic acid-induced release of glucagon-like peptide-1 (GLP-1) from NCI-H716 cells. NCI-H716 cells were incubated with 8 mmol oleic acid, and the culture medium was collected at 0.25, 0.5, 1, 2, and 3 h to detect GLP-1 levels; B: Dose-dependent oleic acid-induced release of GLP-1 from NCI-H716 cells. NCI-H716 cells were incubated with 2, 4, 6, 8, and 10 mmol oleic acid for 2 h. The culture medium was then analyzed for GLP-1 concentration. NCI-H716 cells without oleic acid exposure. aP < 0.05, bP < 0.01 vs baseline value.
Oleic acid increases the expression of uncoupling protein-2 in NCI-H716 cells
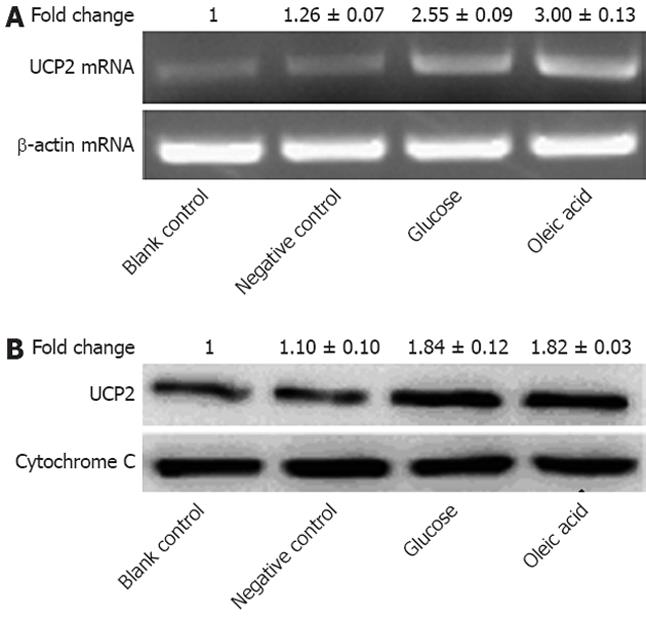
We then determined the effect of oleic acid on the expression of UCP2 in NCI-H716 cells. Based on our time-course and dose-dependency results for GLP-1 expression, we pretreated NCI-H716 cells with 8 mmol oleic acid for 2 h and then collected the cells. qRT-PCR for UCP2 mRNA transcripts and western blot analysis for UCP2 protein were carried out on the isolated total RNA and mitochondrial proteins from these cells, respectively. The UCP2 mRNA level in NCI-H716 cells increased 3-fold after treatment with 8 mmol oleic acid (Figure 3A). The UCP2 protein level also increased 1.8-fold vs the control amount (Figure 3B). These results indicated that oleic acid increased the expression of UCP2 in NCI-H716 cells at the transcriptional level.
Figure 3 Expression of uncoupling protein-2 in NCI-H716 cells after treatment with oleic acid.
A: Total RNA was extracted, and relative mRNA levels of uncoupling protein-2 (UCP2) were determined by quantitative reverse transcriptase polymerase chain reaction with normalization to β-actin (P < 0.05); B: UCP2 protein was detected by western blotting. Cytochrome C was used as the loading control (P < 0.01); Individual data points in this figure represent the mean ± SE of 12 determinants from four independently prepared samples each with three measurements. NCI-H716 cells were incubated with medium alone (blank control), medium containing 1% dimethyl sulfoxide (negative control), medium with 30 mmol glucose (glucose), and medium with 8 mmol oleic acid (oleic acid).
Knocking down uncoupling protein-2 expression decreases oleic acid-induced secretion of GLP-1
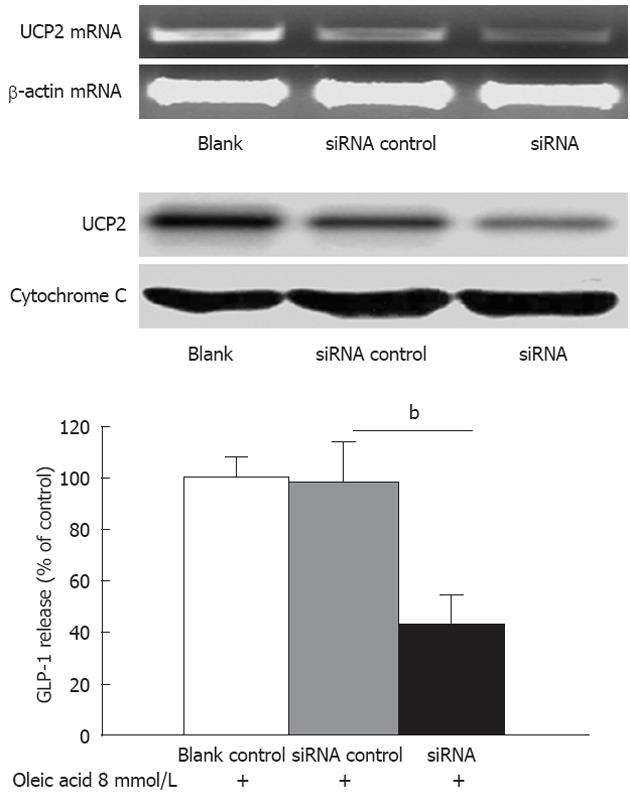
To study the function of UCP2, a siRNA targeting UCP2 was used to specifically suppress UCP2 mRNA translation. Human NCI-H716 cells were left untransfected (blank), were mock transfected (no siRNA), or were transfected with siUCP2. After 48 h, mRNA levels of UCP2 were determined by qRT-PCR. The UCP2 mRNA level was reduced approximately 50% by siUCP2 as compared with the control level (Figure 4, up panel). There were no observable changes in the UCP2 mRNA level in mock-transfected or untransfected cells. The result from the western blot analysis also demonstrated that UCP2 protein was markedly reduced (Figure 4, up panel). Next, we treated NCI-H716 cells transfected with siUCP2 with 8 mmol oleic acid for 2 h. Cells that were incubated with medium alone were used as the blank control to determine baseline GLP-1 expression. Oleic acid-stimulated GLP-1 secretion decreased to 41.8% in NCI-H716 cells with siUCP2 compared to NCI-H716 cells with a non-specific siRNA (P < 0.01) (Figure 4, down panel).
Figure 4 Knockdown of uncoupling protein-2 expression decreased oleic acid-induced secretion of glucagon-like peptide-1 in NCI-H716 cells.
Up panel: The knock-down efficiency of small interfering RNA which targets UCP2 (siUCP2) in NCI-H716 cells. NCI-H716 cells were left untransfected (blank), were mock transfected (no siRNA), or were transfected with siUCP2. After 48 h, the mRNA levels of uncoupling protein-2 were determined as in Figure 4. Protein levels were determined as in Figure 4; Down panel: Effects of oleic acid on levels of secreted glucagon-like peptide-1 (GLP-1). NCI-H716 cells were transfected as described above and were then incubated with 8 mmol oleic acid for 2 h. GLP-1 concentrations were determined as in Figure 4. bP < 0.01 vs siRNA control.
DISCUSSION
The “incretin effect” of GLP-1 has been known for many years, and its role in the overall regulation of insulin release in vivo is well established. The regulation of GLP-1 secretion itself is, however, not well understood. GLP-1 is secreted from isolated perfused ileum preparations when glucose or fat is infused through the gut lumen[22,23]. Nutrients that infuse directly into the ileal lumen can lead to the release of GLP-1[24], indicating that direct stimulation of L-cell secretion is possible in humans. Oral glucose[25-29], sucrose[30], triglycerides[27], and mixed meals also lead to an increase in plasma GLP-1[31-34].
The mechanism of GLP-1 release is believed to involve a proximal-distal loop as well as a glucose sensor. Holst et al[35] proposed a proximal-distal loop to explain the phenomenon of GLP-1 release. This regulatory pathway involves nutrient detectors located in the upper regions of the gastrointestinal tract, which would control the release of GLP-1 from distal L-cells by neural or hormonal circuitry[36]. Theodorakis et al[37] reported that the density of L-cells in the human duodenum may be sufficiently high to account for the early phase of GLP-1 secretion. With respect to the glucose sensor, a variety of signaling mechanisms have been proposed to explain how L-cells might sense glucose, including ATP-sensitive potassium channel closure, sodium glucose cotransporter activity, and activation of sweet taste receptors[19,36]. Fats and protein are other well-known stimuli of GLP-1 release in vivo[5,27].
G protein-coupled receptors (GPCRs) are regarded as potentially important components of signaling pathways in L-cells, as they may underlie the regulation of L-cells by certain neurotransmitters and hormones[23,37,38], as well as by some luminal nutrients. One potential mechanism by which lipids, fatty acids, and bile acids might stimulate GLP-1 release is via activation of specific GPCRs on L-cells, such as GPR40, GPR120, GPR119, and TGR5. GPRs 40 and 120 are responsive to long-chain unsaturated fatty acids[39,40]. GPR119 and TGR5 are responsive to oleoylethanolamide and bile acids, respectively[41,42]. There is also convincing evidence that activation of protein kinase C-zeta contributes to the stimulatory action of fatty acids on GLP-1 release[43]. These do not, however, explain the mechanism of GLP-1 release completely. Thus, there may be other fatty acid-responsive pathways.
Chronic exposure of pancreatic islet cells to FFAs blunts glucose-stimulated insulin secretion and is accompanied by elevated levels of UCP2[12]. UCP2 expression is regulated in tandem with the level of circulating FFAs[44]. FFAs that increase as a result of fasting or a high-fat diet lead to UCP2 expression in adipose tissue and muscle[45-47]. In isolated rat islets and INS-1 pancreatic β cells, long-term treatment with FFAs can increase UCP2 mRNA[48,49].
We found that the human L-cell model, NCI-H716 cells, also expressed UCP2 in the cytoplasm. Oleic acid stimulated GLP-1 secretion in NCI-H716 cells. Time-course experiments revealed that release of GLP-1 from NCI-H716 cells into the medium peaked at 120 min after treatment with oleic acid and maintained a stable plateau at least until 180 min after treatment (Figure 2A).
Whereas the stimulation of NCI-H716 cells with ≤8 mmol oleic acid led to a concentration-dependent increase in GLP-1 secretion into the medium, this increase was not maintained at 10 mmol (Figure 2B). It seemed that the higher concentration of oleic acid inhibited GLP-1 release from NCI-H716 cells. Lauffer et al[50] indicated that higher concentrations of oleoylethanolamide are associated with diminished GLP-1 release in all L-cell models which is suggestive of desensitization. Our results may also be related to desensitization.
Oleic acid also increased UCP2 mRNA levels in NCI-H716 cells. Furthermore, reduced UCP2 expression as a result of RNA interference decreased oleic acid-induced GLP-1 secretion (Figure 4). These results suggest that UCP2 is intimately involved in oleic acid-stimulated secretion of GLP-1 from intestinal endocrine L-cells. Understanding the mechanism responsible for this effect of UCP2 on GLP-1 secretion will require further investigation.
COMMENTS
Background
A chronic high concentration of free fatty acids (FFAs) impairs β cell function, as well as α cell function. This impairment involves uncoupling protein-2 (UCP2). Whether UCP2 has similar effects on intestinal L-cells is not clear. In this study, we investigated the effect of oleic acid, a FFA, on the expression of UCP2 in human NCI-H716 cells, which are a model for L-cells. We also analyzed the effect of UCP2 down-regulation on glucagon-like peptide-1 (GLP-1) secretion in these cells.
Research frontiers
Recent therapeutic successes of antidiabetic drugs aimed at either mimicking GLP-1 or preventing its degradation have focused attention on the L-cell and on addressing whether it would be both possible and beneficial to stimulate the endogenous release of GLP-1. However, the mechanism underlying GLP-1 secretion in vivo is still not fully understood.
Innovations and breakthroughs
To our knowledge, this is the first study to investigate the effect of oleic acid on the expression of UCP2 and the effect of UCP2 down-regulation on GLP-1 secretion in a model for human L-cells.
Applications
We have shown that UCP2 might be involved in a novel mechanism for regulating the secretion of GLP-1. This finding has potential benefit in finding new therapies for diabetes
Terminology
UCP2 played an important role in α cell and β cell dysfunction. A chronic high concentration of FFAs impairs the function of both β and α cells, and this impairment involves UCP2. The pancreatic endocrine β-cells are glucose-sensing cells and the intestinal endocrine L cells secreting GLP-1 are also glucose-sensing cells.
Peer review
The manuscript is a very interesting topic. The article is experimentally well prepared and effectively addresses the relationship between oleic acid and UCP2 and GLP-1. The research is very well described; the conclusions are applicable.


