Published online Sep 14, 2011. doi: 10.3748/wjg.v17.i34.3899
Revised: March 26, 2011
Accepted: April 2, 2011
Published online: September 14, 2011
AIM: To evaluate the efficacy and the safety of azathioprine (AZA) and buthionine sulfoximine (BSO) by localized application into HepG2 tumor in vivo.
METHODS: Different hepatoma and colon carcinoma cell lines (HepG2, HuH7, Chang liver, LoVo, RKO, SW-48, SW-480) were grown in minimal essencial medium supplemented with 10% fetal bovine serum and 1% antibiotic/antimycotic solution and maintained in a humidified 37 °C incubator with 5% CO2. These cells were pretreated with BSO for 24 h and then with AZA for different times. We examined the effects of this combination on some proteins and on cellular death. We also studied the efficacy and the safety of AZA (6 mg/kg per day) and BSO (90 mg/kg per day) in HepG2 tumor growth in vivo using athymic mice. We measured safety by serological markers such as aminotransferases and creatine kinase.
RESULTS: The in vitro studies revealed a new mechanism of action for the AZA plus BSO combination in the cancer cells compared with other thiopurines (6-mercaptopurine, 6-methylmercaptopurine, 6-thioguanine and 6-methylthioguanine) in combination with BSO. The cytotoxic effect of AZA plus BSO in HepG2 cells resulted from necroptosis induction in a mitochondrial-dependent manner. From kinetic studies we suggest that glutathione (GSH) depletion stimulates c-Jun amino-terminal kinase and Bax translocation in HepG2 cells with subsequent deregulation of mitochondria (cytochrome c release, loss of membrane potential), and proteolysis activation leading to loss of membrane integrity, release of lactate dehydrogenase and DNA degradation. Some of this biochemical and cellular changes could be reversed by N-acetylcysteine (a GSH replenisher). In vivo studies showed that HepG2 tumor growth was inhibited when AZA was combined with BSO.
CONCLUSION: Our studies suggest that a combination of AZA plus BSO could be useful for localized treatment of hepatocellular carcinoma as in the currently used transarterial chemoembolization method.
- Citation: Hernández-Breijo B, Monserrat J, Ramírez-Rubio S, Cuevas EP, Vara D, Díaz-Laviada I, Fernández-Moreno MD, Román ID, Gisbert JP, Guijarro LG. Preclinical evaluation of azathioprine plus buthionine sulfoximine in the treatment of human hepatocarcinoma and colon carcinoma. World J Gastroenterol 2011; 17(34): 3899-3911
- URL: https://www.wjgnet.com/1007-9327/full/v17/i34/3899.htm
- DOI: https://dx.doi.org/10.3748/wjg.v17.i34.3899
The incidence of hepatocellular carcinoma (HCC) is increasing, and currently there are approximately 1 million new cases annually worldwide[1]. Classical curative options available are surgical resection or liver transplantation[2]. For unresectable HCC, an effective treatment is transarterial chemoembolization (TACE)[3]. In TACE, the branch of the hepatic artery supplying the tumor is occluded at the time of arteriography by injection of lipidol and/or gelatin-sponge particles, which results in necrosis of the tumor. To increase that effect, chemotherapeutic agents (e.g., doxorubicin, epirubicin, mitomycin c, cisplatin or 5-fluorouracil) are often mixed with lipidol[3]. A significant number of patients benefit from treatment with TACE[3]. For further progress in this encouraging treatment, other antitumor drugs are needed. One of the problems in treating HCC is chemoresistance, therefore the majority of systemic therapies have been disappointing. For years researchers have observed that an elevation in intracellular glutathione (GSH) has been associated with resistance to irradiation and to chemotherapy, and correspondingly, the diminution of GSH levels is associated with sensitization to both types of therapy[4]. Azathioprine (AZA) and buthionine sulfoximine (BSO) are medicines which decrease GSH levels by different mechanisms. Azathioprine belongs to the family of thiopurines with cytostatic activity, which is used in the treatment of autoimmune diseases, organ transplantation and in acute lymphoblastic leukemia[5]. The first step in AZA activation consumes GSH, leading to release of 6-mercaptopurine from the imidazole moiety in an enzymatic reaction catalyzed by several glutathione-S-transferase (GST) isoforms[5]. BSO is a competitive inhibitor of γ-glutamylcysteine synthetase (GCS), the rate-limiting step in the biosynthetic pathway of GSH production[6]. With the aim of treating tumors that overexpress glutathione (e.g., hepatocarcinoma), several groups undertook phase I clinical studies with BSO to evaluate whether modulation of GSH could be clinically useful[7]. In these preliminary studies, the drug proved to be well tolerated and safe, which prompted us to study the effect of BSO combined with AZA: (1) on cell death of HCC cell lines (HepG2, Huh7 and Chang cells) in culture; and (2) on the volume of the tumor obtained by injection of HepG2 into athymic mice in vivo. These results were compared with colon cancer cell lines (Lovo, SW-480, RKO and SW-48).
AZA was a gift from UCB Pharma SA (Madrid, Spain). Antibodies against phospho-p54/46 JNK (c-jun N-terminal kinase), p-p38 MAPK (mitogen-activated protein kinase), JNK, p38 MAPK and α-tubulin were from Cell Signaling Technology Inc. (Beverly, Massachusetts) and antibodies against Bax, Bid, Bad, Bcl-2, cytochrome c, procaspase-3, GCS, nucleoporin and poly (ADP-ribose) polymerase (PARP) were from Santa Cruz Biotechnology Inc. (Santa Cruz, CA). p-38 MAPK inhibitor [SB203580, 4-(4-fluorophenyl)-2-(4-methylsulfinylphenyl)-5-(4-pyridyl)-1H-imidazole], JNK inhibitor (SP600125, 1,9-pyrazoloanthrone) were from Calbiochem (Barcelona, Spain). 3-(4,5-dimethylthiazol-2-yl)-2,5 diphenyl tetrazolium bromide (MTT), DL-buthionine-[S,R]-sulfoximine (BSO), 6-mercaptopurine and 6-methylmercaptopurine were from Sigma Chemical Co. (Madrid, Spain). 2-amino-6-mercaptopurine and 2-amino-6-methylmercaptopurine were from ICN Biomedicals Inc. (Ohio, United States). Z-VAD-mfk caspase-3 inhibitor was from Bachem (Heidelberg, Germany). Ac-DEVD-AMC was from Alexis Biochemicals (San Diego, California). OxyBlotTM Protein Oxidation Kit was from Millipore (Billerica, Massachusetts). All other reagents were of the highest grade of purity available.
HepG2, HuH7 and Chang cells, LoVo, SW-480, RKO and SW-48 cells were from ATCC and were grown in minimal essential medium (MEM) supplemented with 10% fetal bovine serum and 1% antibiotic/antimycotic solution and maintained in a humidified 37 °C incubator with 5% CO2 .
The MTT reduction assay was performed as described previously[8]. Cell viability was determined by the trypan blue exclusion assay as previously described[9].
Intracellular GSH levels were determined fluorometrically as described previously[10].
Cellular supernatants were mixed with lactate dehydrogenase (LDH) substrate (0.2 mol/L Tris-HCl buffer, pH 8.2, containing 2.5 mg/mL L-lactate, 2.5 mg/mL NAD+, 0.1% (v/v) Triton X-100, 1-methoxyphenazine methosulfate and MTT). The formazan formed was measured at a wavelength of 570 nm and reference of 655 nm[8].
The study of DNA fragmentation was performed as previously described[11].
Total cell protein was extracted as described previously[11]. The proteins were determined by the Bradford method and were loaded onto sodium dodecyl sulfate polyacrylamide gel electrophoresis gel and transferred to nitrocellulose membranes overnight at 25 V and 4 °C. The immunoblots were developed as previously described[11].
Mitochondrial impairment was estimated using a JC-1 probe (5,5’,6,6’-tetrachloro-1,1’,3,3’-tetraethylbenzimidazolylcarbocyanine iodide/chloride) as previously described[12]. Cell cycle analysis using propidium iodide staining was performed as described previously[12].
Cells were lysed in 10 mmol/L Tris-HCl buffer (pH 7.5) containing NaH2PO4/NaHPO4 (10 mmol/L), Triton-X-100 (1%), NaCl (130 mmol/L) and sodium pyrophosphate (10 mmol/L). The cell lysates were incubated for 60 min at 37 °C in a 20 mmol/L HEPES buffer (pH 7.5) containing, glycerol (10%), DTT (2 mmol/L) and the specific fluorogenic substrate Ac-DEVD-AMC. Cleavage of the fluorescent caspase-3 substrate was monitored using a fluorescence plate reader at excitation/emission wavelengths of 355/460 nm.
Nude mice were subcutaneously inoculated with 107 HepG2 cells. After solid tumor formation (i.e., tumor volume 100 mm3), the tumor-bearing nude mice were randomized into four experimental groups, each one with eight mice. These groups were treated by peritumoral injection with 0.1 mL dimethyl sulfoxide (DMSO) (5%), BSO (90 mg/kg per day), AZA (6 mg/kg per day) or BSO (90 mg/kg per day) plus AZA (6 mg/kg per day), respectively. The BSO treatment was daily, while the AZA treatment was given on alternate days for a total of 12 d. Tumor size was measured every day. At the end of the experiment, all the animals were sacrificed. Plasma levels of creatine kinase, alanine aminotransferase (ALT) and aspartate aminotransferase (AST) were also determined, following the procedures stated by the provider (Spinreact).
Statistical analysis was performed using the GraphPad Prism package (GraphPad Software Inc., San Diego, CA). Values are reported as mean ± SE and evaluated by the analysis of variance. The statistical significance was set at P < 0.05.
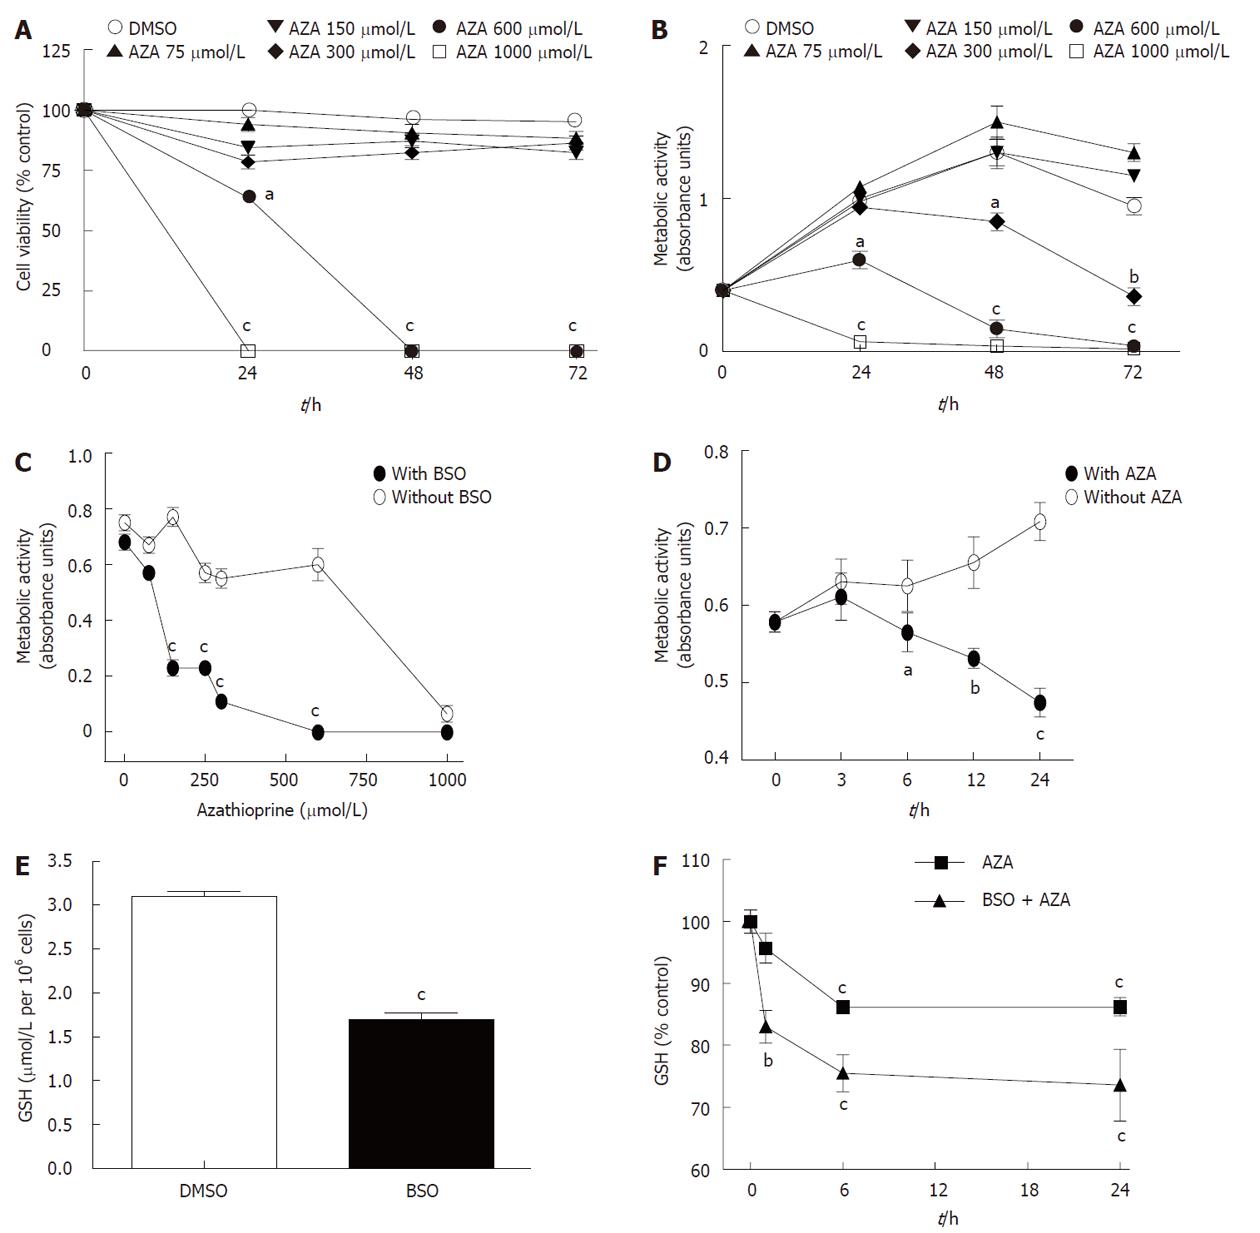
We treated HepG2 cells for 24 h , 48 h or 72 h with DMSO (0.2%) or AZA (75, 150, 300, 600 or 1000 μmol/L) dissolved in 0.2% DMSO. Figure 1A shows that AZA decreased cell viability (measured by Trypan blue exclusion assay) at 600 μmol/L and 1000 μmol/L without significant changes in cell viability at lower drug concentrations. Similarly, azathioprine significantly inhibited metabolic activity (measured by the MTT assay) in a dose-and time-dependent manner (Figure 1B). The metabolic activity was more sensitive to the effect of AZA than the cell viability. In fact with AZA at 300 μmol/L we observed a loss in metabolic activity without changes in cell viability compared with control cells (DMSO). The comparison of MTT and Trypan blue exclusion assays, suggest that AZA produced inhibition of cell proliferation and/or loss of mitochondrial activity up to 300 μmol/L and induced toxicity at higher concentrations (600 μmol/L and 1000 μmol/L). In any case, our results show that HepG2 cells are very resistant to AZA treatment unlike human hepatocytes in culture (data not shown).
When HepG2 cells were pretreated for 24 h with BSO (500 μmol/L) and then co-treated with AZA (0, 75 μmol/L, 150 μmol/L, 250 μmol/L, 300 μmol/L, 600 μmol/L or 1000 μmol/L) for 24 h (Figure 1C), metabolic activity noticeably decreased (IC50 = 80 μmol/L) with respect to those cells treated with AZA alone (IC50 = 800 μmol/L). The pretreatment with BSO potentiated the efficiency of azathioprine 10-fold in decreasing the metabolic activity of HepG2 cells. In the same way, HepG2 pretreated cells for 24 h with BSO (500 μmol/L) and then co-treated with AZA (100 μmol/L) for 3 h, 6 h, 12 h or 24 h showed a time-dependent inhibition of metabolic activity, in contrast to those cells that did not receive BSO (Figure 1D). Pretreatment with BSO significantly decreased basal levels of GSH (Figure 1E). Kinetic studies underlined that AZA treatment decreased GSH content in a time-dependent manner both in BSO-pretreated cells and in control cells (Figure 1F). However, the effect of AZA on GSH levels was higher in BSO-sensitized cells compared with control cells, which suggested that the compounds had synergic effects in regulation of GSH levels.
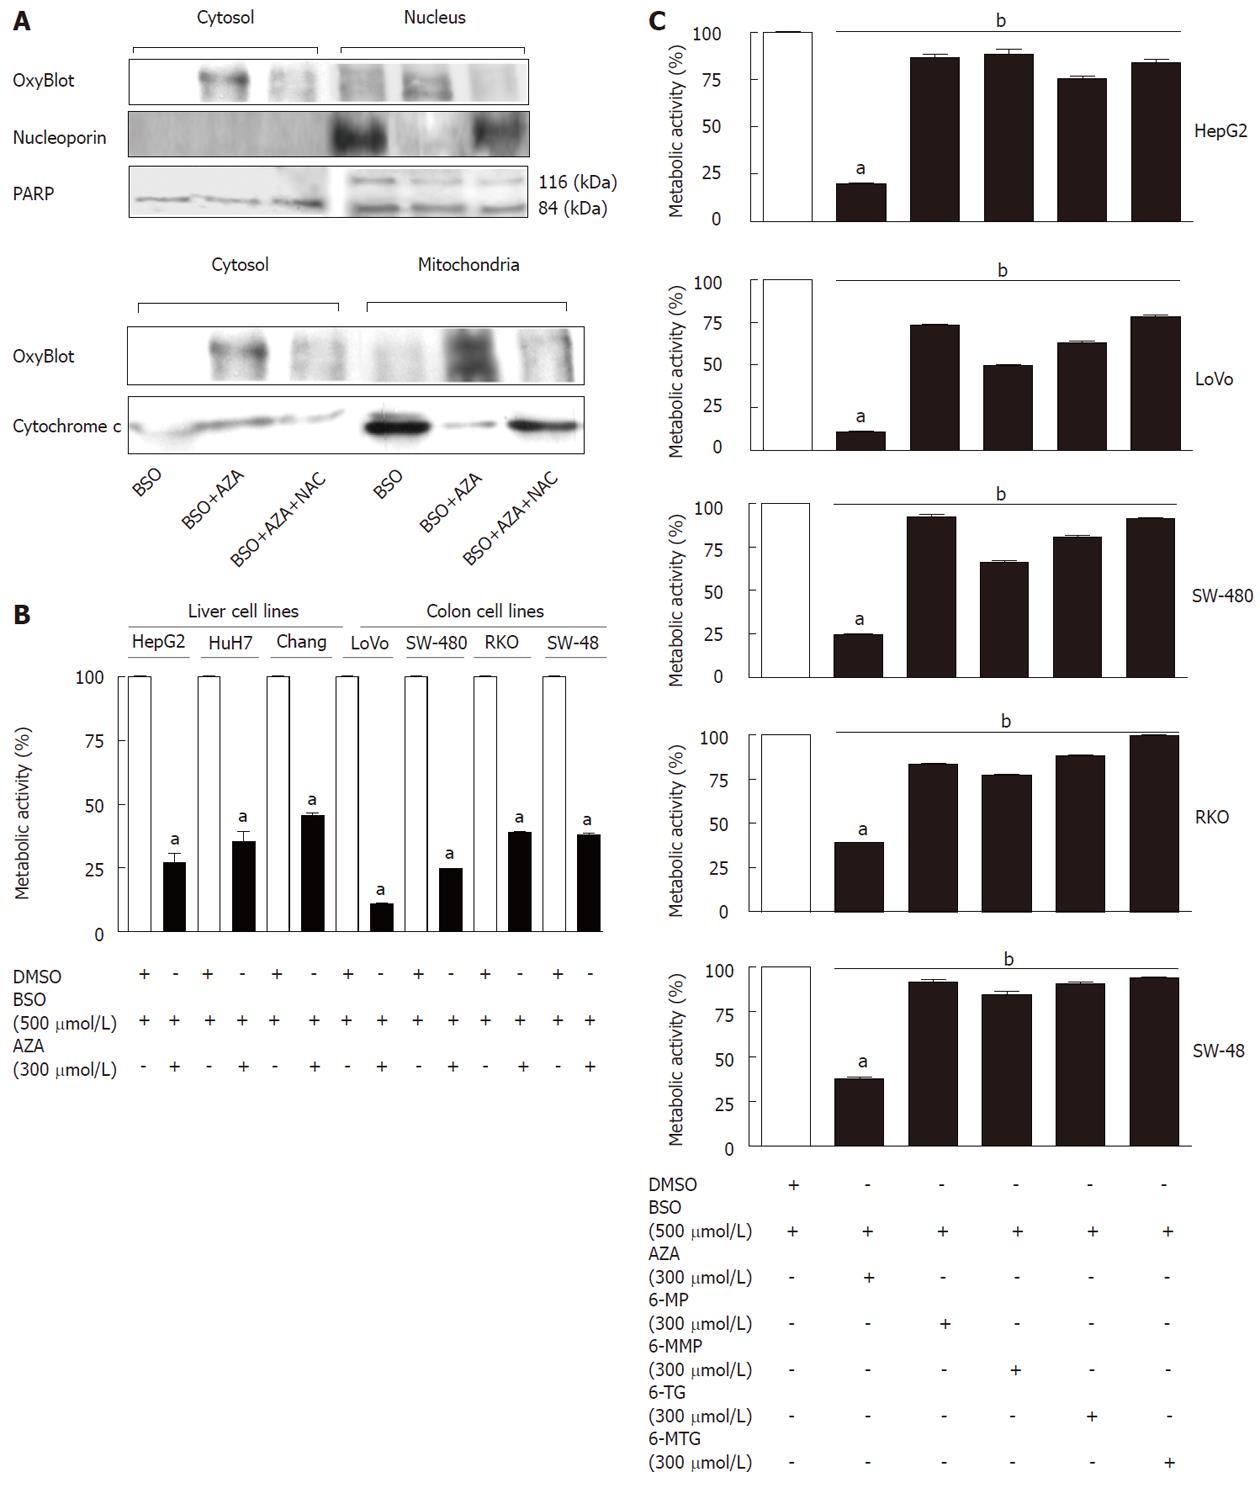
In order to localize the compartment affected by GSH depletion, we studied the presence of oxidized proteins (by OxyBlot) in different cellular fractions (cytosol, mitochondria and nucleus) obtained from drug-treated cells (Figure 2A). The treatment with AZA (300 μmol/L) plus BSO (500 μmol/L) increased the oxidized proteins in all fraction studied compared with cells treated with BSO (500 μmol/L). This effect was partially reversed by cotreatment with N-acetylcysteine (NAC, 1.5 mmol/L), a GSH replenisher. The levels of nucleoporin, PARP and cytochrome c were used as markers for the nucleus (nucleoporin and PARP) and mitochondria (cytochrome c). Interestingly, treatment with AZA plus BSO induced the depletion of nucleoporin and cytochrome c in the nucleus and in the mitochondria, respectively (Figure 2A). These effects were partially reversed by NAC.
Treatment with AZA (300 μmol/L) plus BSO (500 μmol/L), decreased the metabolic activity in all cell lines (HepG2, Huh-7, Chang cells, LoVo, SW-480, RKO, SW-48) tested in comparison with control treatment (DMSO) (Figure 2B).
Pretreatment with BSO (24 h) and subsequent treatment with thiopurines (6-mercaptopurine, 6-methylmercaptopurine, 6-thioguanine or 6-methylthioguanine) for 12 h caused a slight decrease in the metabolic activity of HepG2 cells with respect to control (cells treated with BSO) (Figure 2C); the effect of the preceding treatment with thiopurines on metabolic activity was very modest compared with the effect of AZA (Figure 2C). We observed significant differences between AZA and the other thiopurines studied. Subsequent studies were performed using AZA.
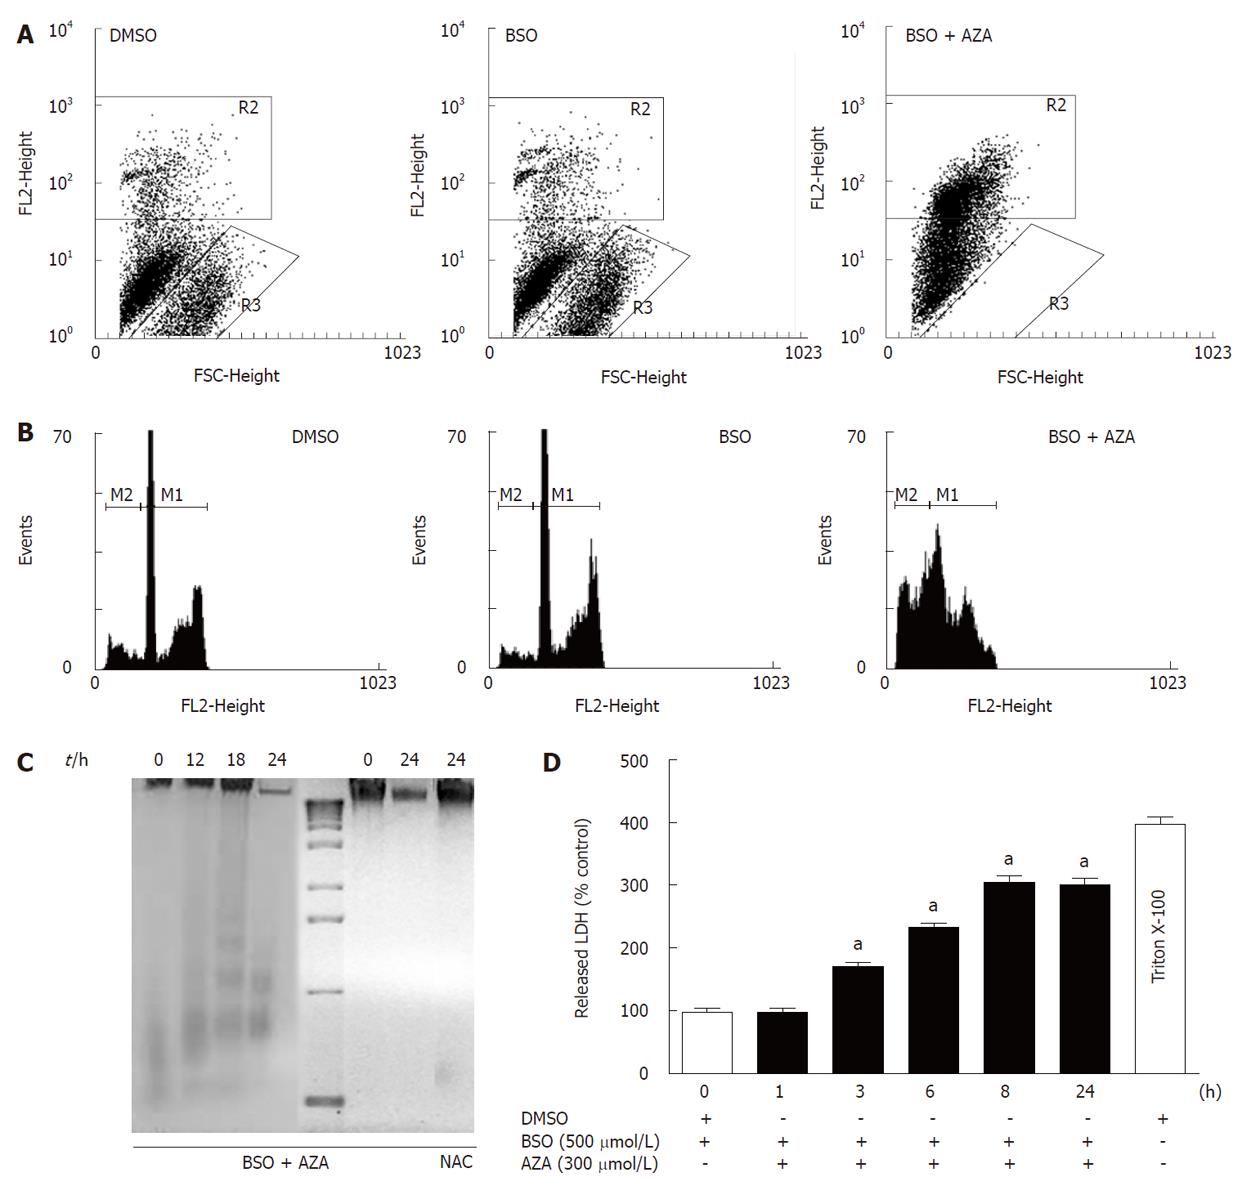
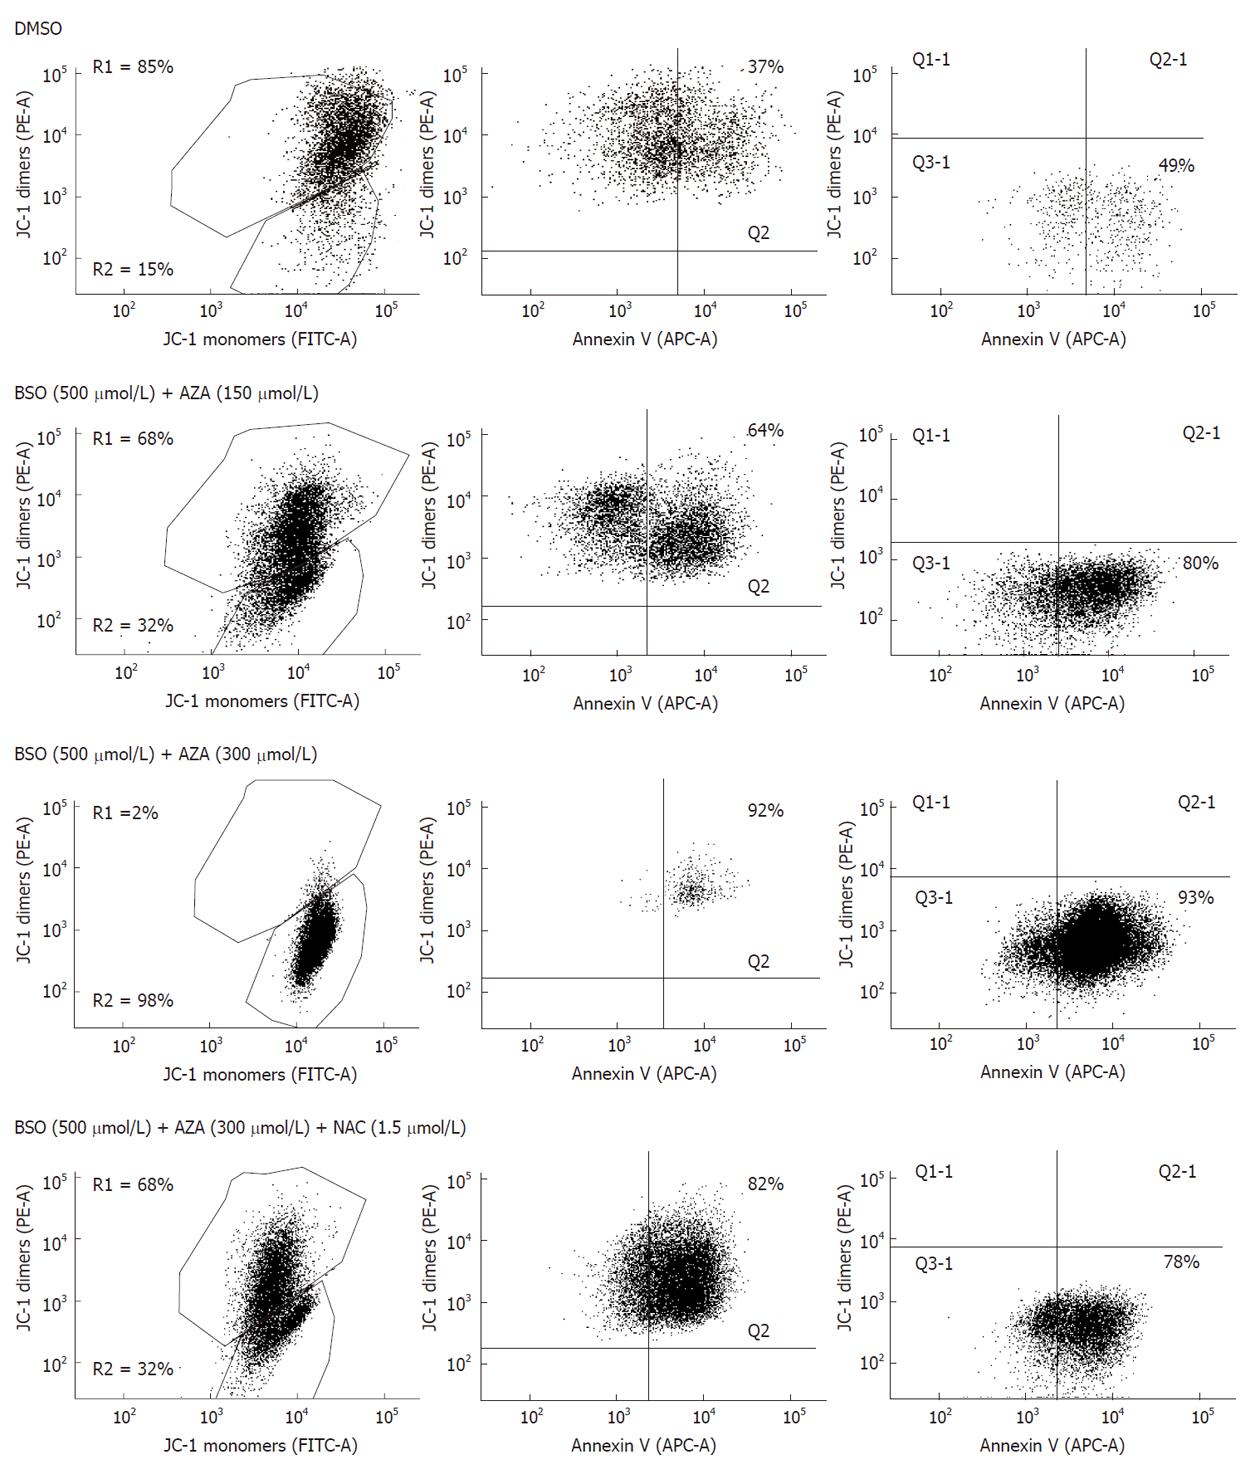
Pretreatment of HepG2 cells for 24 h with BSO (500 μmol/L) and subsequent treatment with AZA (300 μmol/L) for 24 h resulted in a significant loss of cell viability with respect to cells treated with BSO or with DMSO, as measured by staining of live cells with propidium iodine (Figure 3A). The R3 area corresponded to viable cells and R2 to non viable cells. Pretreatment of HepG2 cells with BSO (500 μmol/L) did not significantly change their viability compared with DMSO-treated cells (Figure 3A). To determine the mode of cell death, cell cycle analysis was performed by staining Triton X-100 permeabilized cells with propidium iodine followed by flow cytometry analysis (Figure 3B). In the presence of BSO (500 μmol/L) and AZA (300 μmol/L), we observed a significant increase in the sub-G1 population (M2) with respect to cells treated with BSO or with DMSO alone. No significant differences were observed between cells treated with DMSO or with BSO (Figure 3B). These data suggested that the significant decrease in both metabolic activity and viability of cells treated with BSO and AZA was due in part to an increase in nuclear fragmentation characteristic of late apoptosis and early necrosis. To quantify the contribution of apoptosis and necrosis in cell death induced by BSO (500 μmol/L) plus AZA (300 μmol/L), we studied oligonucleosomal DNA fragmentation (Figure 3C) and LDH release (Figure 3D), respectively. The combined drug treatment induced a slight DNA laddering at 18 h treatment. After this period of time, treatment with BSO plus AZA induced extensive DNA degradation which was characteristic of necrosis. This degradation was prevented by the presence of NAC (1.5 mmol/L) (Figure 3C). Next we studied LDH release (Figure 3D). Our results showed that LDH release was statistically significant after 3 h combined drug treatment compared with control treatment. After 8 h treatment in the same conditions, we observed approximately 75% of necrotic cell death compared with control necrosis (HepG2 cells in the presence of Triton X-100) (Figure 3D). To obtain a new insight in the role of mitochondria in the cell death induced by the combination of BSO (500 μmol/L) and AZA (150 μmol/L or 300 μmol/L), we evaluated: (1) annexin V bound to phosphatidylserine on the surface of HepG2 cells; and (2) the mitochondrial functionality through JC-1 probe aggregation. Figure 4 shows that treatment of cells with BSO plus AZA: (1) increased the percentage of cells positive for annexin V (Q2 quadrant) in a dose-dependent manner: from 37% in control cells (DMSO), to 64% in cells treated with 500 μmol/L BSO plus 150 μmol/L AZA, then to 92% in cells treated with 500 μmol/L BSO plus 300 μmol/L AZA; and (2) decreased the percentage of cells with intact mitochondrial membrane potential, in a dose-dependent manner: from 85% in control cells (DMSO) to 68% in 500 μmol/L BSO plus 150 μmol/L AZA, then to 2% in 500 μmol/L BSO plus 300 μmol/L AZA. Annexin V staining was calculated as a percentage of R1 (cells with the mitochondrial membrane potential intact). R2 represented cells without an intact membrane potential mitochondrial. We obtained very similar proportions of cells stained with annexin V and JC-1 after treatment with DMSO (control cells) or with BSO (500 μmol/L) (data not shown).
It is very interesting to emphasize the recovery effect of NAC. Cells treated with BSO (500 μmol/L) and AZA (300 μmol/L) in the presence of NAC (1.5 mmol/L) showed a larger percentage of cells with intact mitochondrial membrane potential (68%) than cells treated with BSO and AZA in the absence of NAC (2%). However, a high percentage (82%) of annexin V-positive cells were observed in the NAC-treated cells, which suggest that they were at the beginning of apoptosis (Figure 4).
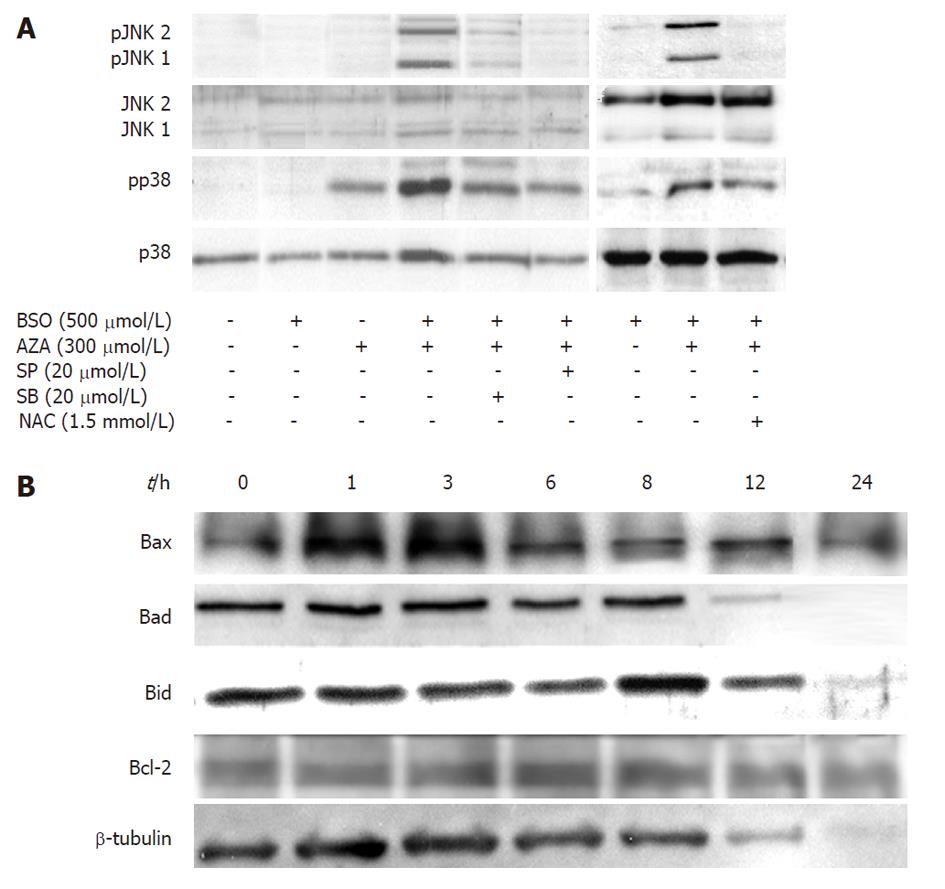
HepG2 cells were pretreated for 24 h with MEM or BSO (500 μmol/L), then were treated with or without SP600125 (a JNK specific inhibitor) or SB203580 (a p38 specific inhibitor), in the presence or in the absence of AZA (300 μmol/L) for 1 h (Figure 5A). In contrast to BSO, treatment with AZA induced p38 phosphorylation, which indicated enzyme activation. This effect increased in those cells treated with both AZA and BSO, and JNK1/JNK2 phosphorylation was also observed. The treatment of cells with SB203580 decreased both p38 and JNK1/JNK2 phosphorylation. SP600125 decreased JNK1/JNK2 phosphorylation and also p38 phosphorylation, which suggests a linked control mechanism between both pathways. On the other hand, NAC treatment inhibited both p38- and JNK1/JNK2-induced phosphorylation by AZA and BSO (Figure 5A).
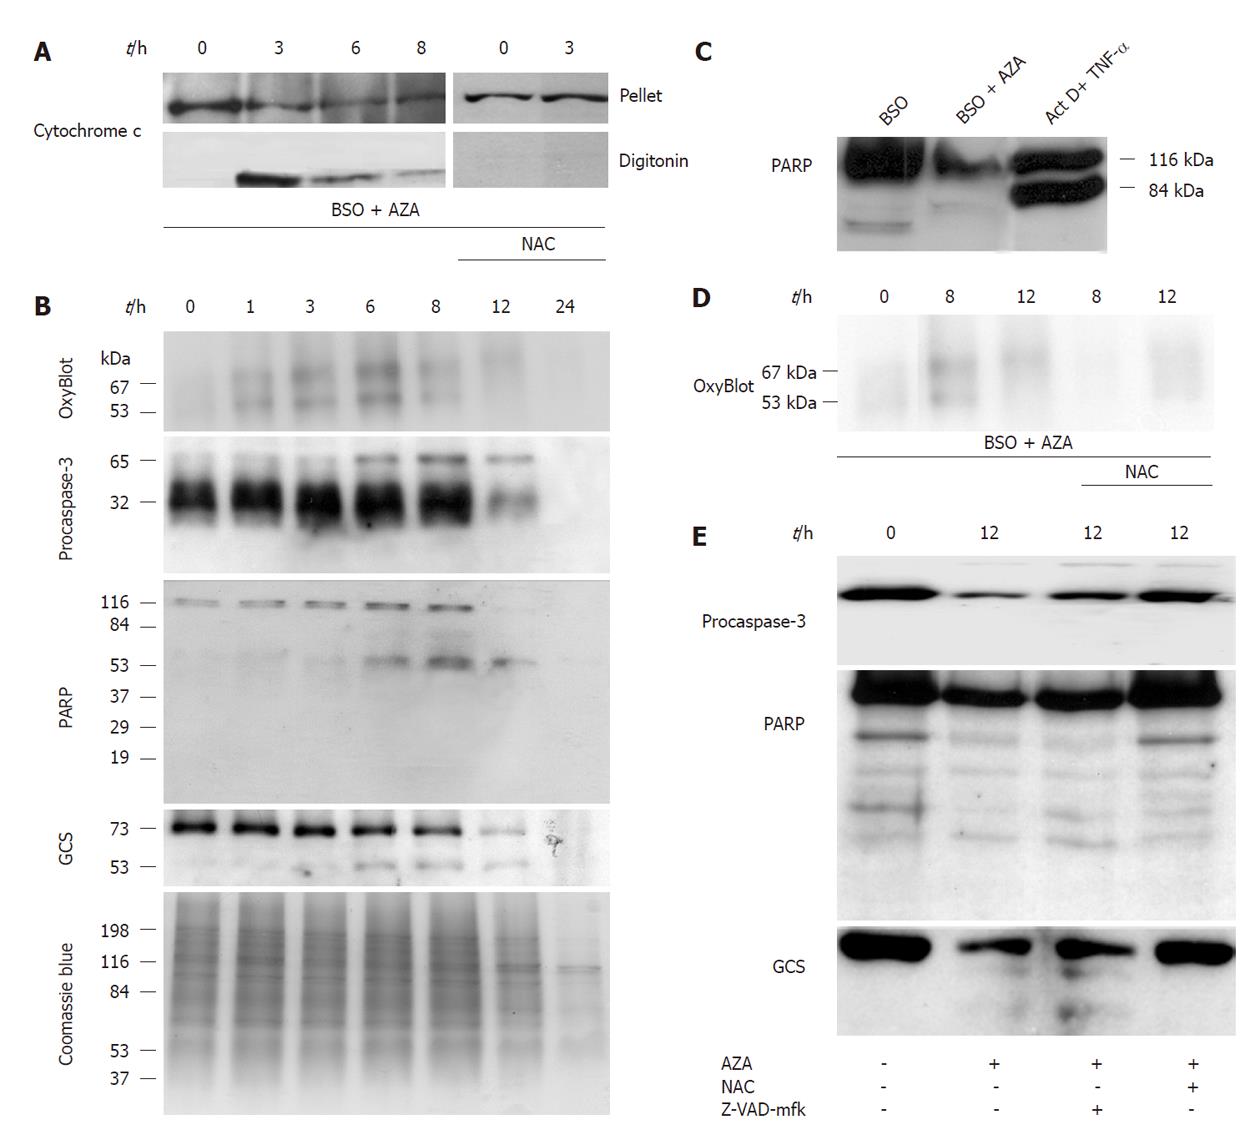
In the next set of experiments (Figure 5B), we pretreated HepG2 cells for 24 h with BSO (500 μmol/L) and then with AZA (300 μmol/L) at different times (1, 3, 6, 8, 12 h), and we found that Bad, Bid and Bcl-2 remained constant, but Bax increased at 1 h and 3 h. There was general protein degradation at 24 h of treatment that affected Bad, Bid and β-tubulin (Figure 5B). Also we studied cytochrome c release from mitochondria. The maximum release of occurred at 3 h of AZA treatment and was attenuated by cotreatment with NAC (1.5 mmol/L) (Figure 6A). Next we examined the oxidation of proteins, with “OxyBlot kit”, in cells pretreated with BSO (500 μmol/L) for 24 h and cotreated with AZA (300 μmol/L) at different times. The experiment showed oxidation of 53 kDa and 67 kDa bands at 6 h, but after this period of time, we observed decreased protein oxidation (Figure 6B). The protein oxidation was reversed by NAC (Figure 6D).
We studied the proteolysis of procaspase-3, GCS and PARP by Western blotting (Figure 6B). Pretreatment with BSO (500 μmol/L, 24 h) and then cotreatment with AZA (300 μmol/L) at different times, induced procaspase-3 dimerization (65 kDa band) but we did not observe fragmentation. The substrates of caspase-3, GCS and PARP, were fragmented with the combined treatment of BSO (500 μmol/L) plus AZA (300 μmol/L) (Figure 6B), however their proteolysis profiles did not correlate with those obtained in a classical model of caspase-3 activation, as observed for HepG2 cells treated with actinomycin D (0.8 μmol/L) plus tumor necrosis factor-α (35 pmol/L) for 18 h (Figure 6C). We observed that NAC inhibited the proteolysis of procaspase-3, GCS and PARP induced by AZA plus BSO (Figure 6E). However, Z-VAD-mfk (a caspase-3 inhibitor) did not have any significant effect on proteolysis of procaspase-3, GCS and PARP (Figure 6E). The protective role of GSH in HepG2 cell death induced by BSO plus AZA treatment and the absence of caspase-3 activation in this model is shown in Table 1.
| Metabolic activity (absorbance units) | Caspase-3 activity (% of CRL) | ||||
| 0 h | 6 h | 12 h | 18 h | ||
| BSO/DMSO | 0.833 ± 0.016 | 100.00 ± 6.62 | - | - | - |
| BSO/AZA | 0.544 ± 0.046a | - | 95.87 ± 8.56 | 92.79 ± 6.09 | - |
| BSO/AZA/NAC | 0.933 ± 0.059 | - | 93.29 ± 4.03 | 98.87 ± 2.64 | - |
| BSO/AZA/Z-VAD-mfk | 0.680 ± 0.034a | - | 94.85 ± 6.81 | 102.60 ± 7.30 | - |
| TNF-α (35 pmol/L)/ActD (0.8 μmol/L) | - | - | - | - | 143.00 ± 5.77b |
| TNF-α (700 pmol/L)/ActD (0.8 μmol/L) | - | - | - | - | 141.30 ± 4.33b |
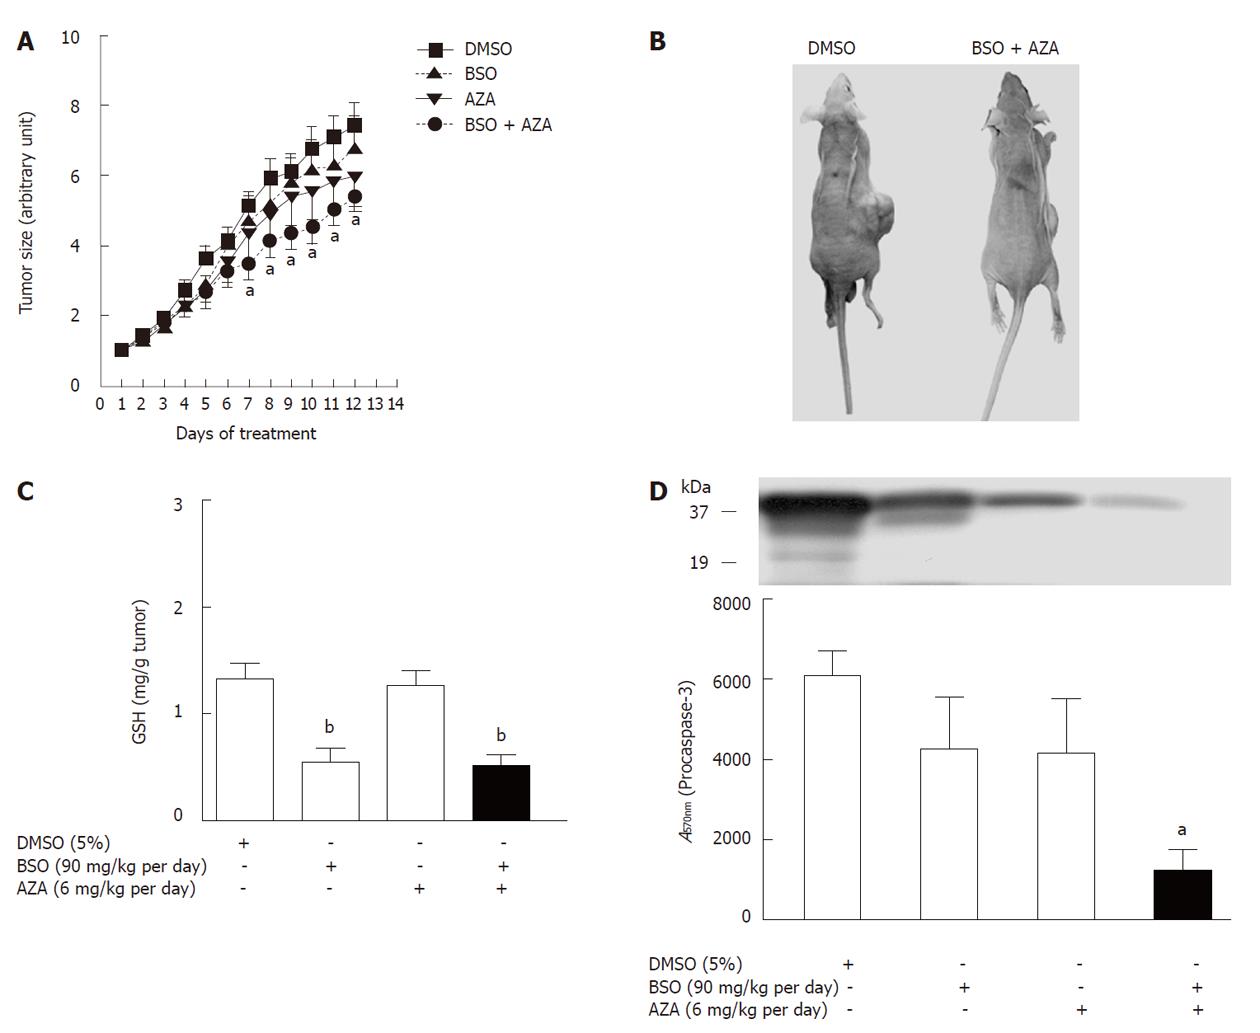
HepG2 cells were subcutaneously injected into nude mice, and the tumor size was measured every day. From the 7th day of BSO (90 mg/kg per day) plus AZA (6 mg/kg per day) treatment, the tumor volume was significantly decreased by a mean of 35% when compared with vehicle, DMSO (Figure 7A). These results showed no statistically significant differences (P > 0.05) between control (DMSO) and BSO (90 mg/kg per day) treatment or between control (DMSO) and AZA (6 mg/kg per day) treatment (Figure 7A). GSH levels decreased in the tumors in BSO and AZA plus BSO groups compared with the corresponding control group (DMSO) (Figure 7C). Tumor cytolysis in the AZA plus BSO group was accompanied by a significant reduction in procaspase-3 compared with control (DMSO) (Figure 7D). Plasma creatine kinase, ALT and AST did not show marked changes in the AZA plus BSO group compared with control (DMSO) and with the other groups studied (Table 2). This implied that a combination of AZA plus BSO did not induce toxicity in the hosts.
| Enzyme | DMSO | BSO | AZA | BSO/AZA |
| AST (IU/L) | 91.07 ± 8.36 | 62.79 ± 3.89 | 124.90 ± 10.56 | 154.30 ± 19.75a |
| ALT (IU/L) | 31.50 ± 9.12 | 22.36 ± 2.85 | 36.17 ± 5.44 | 42.29 ± 9.04 |
| CK (IU/L) | 598.60 ± 112.10 | 416.00 ± 89.28 | 904.40 ± 129.40 | 918.50 ± 128.70 |
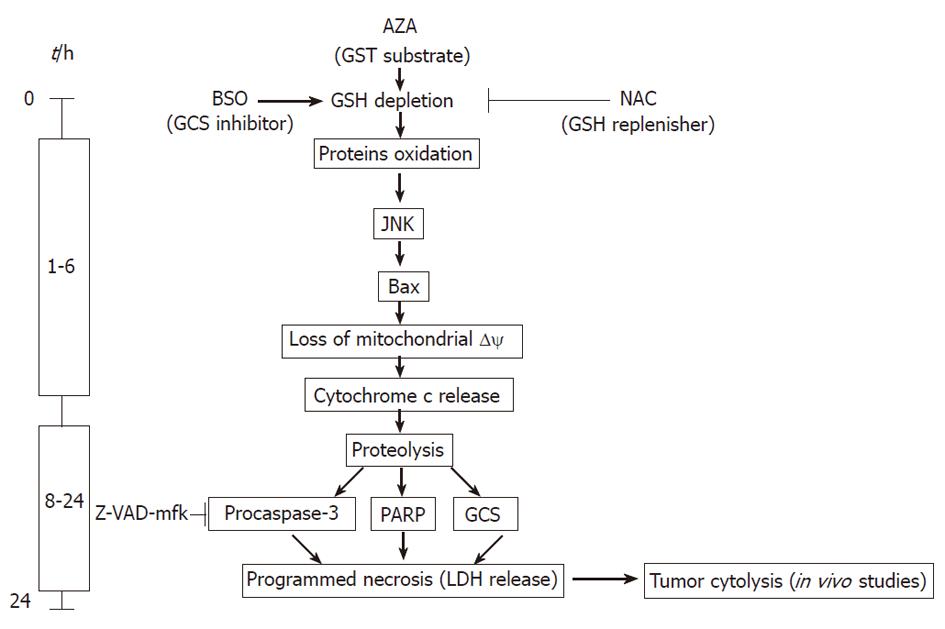
New drug combinations are needed for treatment of patients with cancer, particularly those refractory to standard therapy. Unresectable HCC is treated by TACE[3,13], in which tumor necrosis is induced by hypoxia and by classic (doxorubicin, epirubicin, mitomycin c, cisplatin or 5-fluorouracil) or new (zinostatin stimalamer) drugs[13]. Our preclinical results suggest that a new combination of old drugs could be useful in locoregional treatment of HCC. The AZA plus BSO combination offers the advantage of a new mechanism of action to the previous one used in TACE therapy, as we showed in the present paper. Moreover, our results revealed that AZA plus BSO may have a new spectrum of activity in comparison with the parent molecules, 6-mercaptopurine and 6-thioguanine. The localized application of AZA (6 mg/kg per day) and BSO (90 mg/kg per day) produced a decrease in the volume of the HepG2 tumor xenograft that was not achieved by AZA or BSO alone. The doses used in the nude mouse model are comparable to those used for AZA in liver transplantation[14] and in clinical trials of BSO[7]. The therapeutic effect was produced with only minor changes in biochemical parameters used in the evaluation of the drug safety profile. Our results suggested that the AZA plus BSO combination induced necroptosis by JNK activation. Necroptosis is a caspase-independent regulated cell death, that results in morphological features resembling necrosis. Our data suggested that AZA and BSO can induce HepG2 cell death by depletion of the different pools of GSH, which could explain the synergistic effect of the compounds on cell cytotoxicity. This suggestion is based on: (1) AZA decreases GSH levels in pretreated cells with BSO; (2) AZA kinetics on GSH depletion is more rapid and profound in cells pretreated with BSO than in control cells; (3) AZA is able to activate p38 by a GSH-dependent mechanism, while BSO is not; (4) AZA is able to stimulate JNK activity in cells GSH-depleted by BSO; this last effect is completely reversed by NAC; (5) AZA is able to stimulate the oxidation of cytosolic, nuclear and mitochondrial proteins by a GSH-dependent mechanism as demonstrated by the reversal by NAC; and (6) AZA treatment depletes both nucleoporin and cytochrome c in cells pretreated by BSO; these effects are reversed by NAC. From kinetic studies, we suggest that GSH depletion induced by AZA plus BSO stimulates JNK, Bax translocation and subsequent deregulation of mitochondria and activation of a cytotoxic cascade in HepG2 cells. The mitochondrial crisis is demonstrated by cytochrome c release and an increase in oxidized proteins. Classically, a link has been observed between mitochondria and caspase-3 activation[15]. Our results demonstrated the proteolysis of procaspase-3, PARP, γ-glutamylcysteine synthetase, the loss of membrane integrity, the release of LDH and DNA degradation after treatment with AZA plus BSO. Several of these cellular and biochemical changes are characteristic of apoptosis and of necrosis. We observed (Figure 8) at short times (0 to 6 h) of drug treatment, rapid regulatory changes associated with GSH levels, such as JNK activation and Bax translocation, which are followed by mitochondrial cytochrome c release and protein oxidation, all parameters classical hallmarks of apoptosis. However, cytochrome c release did not lead to caspase-3 activation and subsequent PARP proteolysis in 89 kDa fragments, as observed in control experiments performed in the presence of tumor necrosis factor-α and actinomycin-D. In addition, caspase-3 activity did not increase in the presence of BSO plus AZA. The absence of caspase-3 activation is corroborated using Z-VAD-mfk, because this caspase-3 inhibitor did not protect against AZA plus BSO-induced cytotoxicity. These data exclude the involvement of caspase-3 in the cell death induced by the combination of both compounds. We observed at longer periods (6 to 24 h) of treatment with both compounds (Figure 8), a generalized protein degradation which affected structural (β-tubulin), regulatory (Bad, Bid, procaspase-3), metabolic (GCS) and DNA binding (PARP) proteins. Interestingly, Bcl-2 levels did not change with AZA plus BSO treatment which rules out apoptosis as the mechanism of cell death. Recently, a novel form of cell death called necroptosis or programmed necrosis has been proposed[15], which like apoptosis, can be executed by a regulated mechanism. The first steps are common or similar to apoptosis but the inactivation of caspases causes a shift from apoptosis to mixed cell death (necrotic/apoptotic) or to full-blown necrosis[15]. Our results suggest a role for GSH in the shift between apoptosis and necrosis induced by AZA plus BSO, because the addition of NAC to the drug combination reversed the majority of the cytotoxic effects induced by AZA plus BSO (JNK activation, cytochrome c release, protein oxidation, extensive proteolysis, mitochondrial membrane depolarization, and DNA fragmentation), but it did not inhibit annexin V-staining, which is characteristic of the early step of apoptosis. Recently, the importance of GSH has been shown in the induction of cell death by regulation of the cascade GST-JNK. The JNK activity is inhibited by binding with GST and, in this molecular model, a decrease in GSH causes oxidation of Cys47 and Cys101 in the GST protein, which in turn induces JNK release and subsequent activation[16]. Our results suggest a similar model of activation of JNK by AZA plus BSO. In contrast, JNK activation in HepG2 cells by staurosporin, H2O2, etoposide or ultraviolet light induces classical apoptosis[17]. In some instances, it may be desirable to trigger necrotic cell death, for example in hepatocarcinoma treatment, necrosis is the target of all effective locoregional therapies[3]. Our results provide important insights for the comprehensive understanding of the mechanism cell death induced by AZA and BSO in HepG2 cells and in other cancerous cells from the liver (HuH7, Chang cells) and from the colon (LoVo, SW-480, RKO, SW-48). To be considered as a therapeutic agent, the administered doses of AZA plus BSO must be compatible with those used in clinical practice; in this respect we observed that the doses of both compounds locally injected in the xenograft were able to reduce the tumor volume without any serious side effects. This combined therapy has an additional advantage, in that the presence of NAC can protect major organs from unexpected damage. The effectiveness of BSO in the treatment of solid tumors has been observed previously in combination with arsenic trioxide[18], sodium borocaptate[19] or melphalan[6]. Interestingly, in this last paper BSO was administered efficiently by infusion into the hepatic artery, as in TACE. Our results provide experimental evidence to support the clinical use of the combined treatment of AZA and BSO in liver cancer.
The authors thank Dr. Lasuncion and Dr. Ropero for kindly providing some cell lines. We thank Unidad de Cultivos Celulares and Centro de Experimentación Animal for their technical help.
The incidence of human liver carcinoma is increasing and is the fifth most common cancer in the world. Unfortunately, the disease is often diagnosed too late. For unresectable liver carcinoma, an effective treatment is transarterial chemoembolization (TACE). One way to progress with this encouraging treatment is to find a synergistic combination of classical drugs.
One of the problems in treating hepatocarcinoma is chemoresistance, thus the majority of systemic therapies have been disappointing. Researchers for years have observed that elevation of intracellular glutathione (GSH) has been associated with resistance to irradiation and to chemotherapy and correspondingly the diminution of GSH levels is associated with sensitization to both types of therapy. Buthionine sulfoximine (BSO) is a competitive inhibitor of γ-glutamylcysteine synthetase, the rate-limiting step in the biosynthetic pathway of GSH production, and reduces their levels. In this study, the authors demonstrate that azathioprine (AZA) plus BSO could induce: (1) cell death of several cancer lines in vitro by activation of JNK; and (2) HepG2 cell death in a xenograft model.
The results point out the role of GSH in the synergism observed by the combination of AZA plus BSO, because the addition of N-acetylcysteine (NAC) reversed JNK activation, cytochrome c release, protein oxidation, extensive proteolysis, mitochondrial membrane depolarization and DNA fragmentation observed in the presence of AZA plus BSO. However, NAC was not able to inhibit annexin V staining which is characteristic of the early step of apoptosis. The modulation of the shift between apoptosis and necrosis induced by AZA plus BSO, in the presence or in absence, respectively, of NAC may be important in overcoming the chemoresistance observed during treatment of liver tumors.
The present findings may provide: (1) a new drug combination for the treatment of liver neoplasms; (2) identification of molecular targets to inhibit chemoresistance of cancer. These two pathways could be promising in the treatment of liver cancer.
AZA is an immunosuppressant for clinical use belonging to the family of the thiopurines. It is used in organ transplantation and treatment of autoimmune diseases. BSO is an inhibitor of glutathione synthesis that is being evaluated clinically as an adjuvant in the treatment of cancer.
The paper is of interest and deserves consideration for publication.
Peer reviewer: Dario Conte, Professor, GI Unit-IRCCS Osp. Maggiore, Chair of Gastroenterology, Via F Sforza, 35, Milano 20122, Italy
S- Editor Tian L L- Editor Cant MR E- Editor Zhang DN
| 1. | Sherman M. Hepatocellular carcinoma: epidemiology, surveillance, and diagnosis. Semin Liver Dis. 2010;30:3-16. [RCA] [PubMed] [DOI] [Full Text] [Cited by in Crossref: 284] [Cited by in RCA: 296] [Article Influence: 18.5] [Reference Citation Analysis (1)] |
| 2. | Schreibman IR, Bejarano P, Martinez EJ, Regev A. Very late recurrence of hepatocellular carcinoma after liver transplantation: case report and literature review. Transplant Proc. 2006;38:3140-3143. [RCA] [PubMed] [DOI] [Full Text] [Cited by in Crossref: 9] [Cited by in RCA: 14] [Article Influence: 0.7] [Reference Citation Analysis (0)] |
| 3. | Forner A, Ayuso C, Varela M, Rimola J, Hessheimer AJ, de Lope CR, Reig M, Bianchi L, Llovet JM, Bruix J. Evaluation of tumor response after locoregional therapies in hepatocellular carcinoma: are response evaluation criteria in solid tumors reliable? Cancer. 2009;115:616-623. [RCA] [PubMed] [DOI] [Full Text] [Cited by in Crossref: 323] [Cited by in RCA: 340] [Article Influence: 20.0] [Reference Citation Analysis (0)] |
| 4. | Awasthi YC, Chaudhary P, Vatsyayan R, Sharma A, Awasthi S, Sharma R. Physiological and pharmacological significance of glutathione-conjugate transport. J Toxicol Environ Health B Crit Rev. 2009;12:540-551. [PubMed] |
| 5. | Cara CJ, Pena AS, Sans M, Rodrigo L, Guerrero-Esteo M, Hinojosa J, García-Paredes J, Guijarro LG. Reviewing the mechanism of action of thiopurine drugs: towards a new paradigm in clinical practice. Med Sci Monit. 2004;10:RA247-RA254. [PubMed] |
| 6. | Vahrmeijer AL, van Dierendonck JH, Schutrups J, van de Velde CJ, Mulder GJ. Potentiation of the cytostatic effect of melphalan on colorectal cancer hepatic metastases by infusion of buthionine sulfoximine (BSO) in the rat: enhanced tumor glutathione depletion by infusion of BSO in the hepatic artery. Cancer Chemother Pharmacol. 1999;44:111-116. [PubMed] |
| 7. | Bailey HH, Ripple G, Tutsch KD, Arzoomanian RZ, Alberti D, Feierabend C, Mahvi D, Schink J, Pomplun M, Mulcahy RT. Phase I study of continuous-infusion L-S,R-buthionine sulfoximine with intravenous melphalan. J Natl Cancer Inst. 1997;89:1789-1796. [PubMed] |
| 8. | Abe K, Matsuki N. Measurement of cellular 3-(4,5-dimethylthiazol-2-yl)-2,5-diphenyltetrazolium bromide (MTT) reduction activity and lactate dehydrogenase release using MTT. Neurosci Res. 2000;38:325-329. [RCA] [PubMed] [DOI] [Full Text] [Cited by in Crossref: 141] [Cited by in RCA: 146] [Article Influence: 5.6] [Reference Citation Analysis (0)] |
| 9. | Shin KJ, Bae SS, Hwang YA, Seo JK, Ryu SH, Suh PG. 2,2',4,6,6'-pentachlorobiphenyl induces apoptosis in human monocytic cells. Toxicol Appl Pharmacol. 2000;169:1-7. [RCA] [PubMed] [DOI] [Full Text] [Cited by in Crossref: 35] [Cited by in RCA: 35] [Article Influence: 1.3] [Reference Citation Analysis (0)] |
| 10. | Hissin PJ, Hilf R. A fluorometric method for determination of oxidized and reduced glutathione in tissues. Anal Biochem. 1976;74:214-226. [RCA] [PubMed] [DOI] [Full Text] [Cited by in Crossref: 3140] [Cited by in RCA: 3157] [Article Influence: 63.1] [Reference Citation Analysis (0)] |
| 11. | Cuevas EP, Escribano O, Chiloeches A, Ramirez Rubio S, Román ID, Fernández-Moreno MD, Guijarro LG. Role of insulin receptor substrate-4 in IGF-I-stimulated HEPG2 proliferation. J Hepatol. 2007;46:1089-1098. [RCA] [PubMed] [DOI] [Full Text] [Cited by in Crossref: 28] [Cited by in RCA: 29] [Article Influence: 1.5] [Reference Citation Analysis (0)] |
| 12. | Cuevas EP, Escribano O, Monserrat J, Martínez-Botas J, Sánchez MG, Chiloeches A, Hernández-Breijo B, Sánchez-Alonso V, Román ID, Fernández-Moreno MD. RNAi-mediated silencing of insulin receptor substrate-4 enhances actinomycin D- and tumor necrosis factor-alpha-induced cell death in hepatocarcinoma cancer cell lines. J Cell Biochem. 2009;108:1292-1301. [RCA] [PubMed] [DOI] [Full Text] [Cited by in Crossref: 13] [Cited by in RCA: 14] [Article Influence: 0.9] [Reference Citation Analysis (0)] |
| 13. | Okusaka T, Kasugai H, Shioyama Y, Tanaka K, Kudo M, Saisho H, Osaki Y, Sata M, Fujiyama S, Kumada T. Transarterial chemotherapy alone versus transarterial chemoembolization for hepatocellular carcinoma: a randomized phase III trial. J Hepatol. 2009;51:1030-1036. [RCA] [PubMed] [DOI] [Full Text] [Cited by in Crossref: 72] [Cited by in RCA: 83] [Article Influence: 4.9] [Reference Citation Analysis (0)] |
| 14. | Zekry A, Gleeson M, Guney S, McCaughan GW. A prospective cross-over study comparing the effect of mycophenolate versus azathioprine on allograft function and viral load in liver transplant recipients with recurrent chronic HCV infection. Liver Transpl. 2004;10:52-57. [RCA] [PubMed] [DOI] [Full Text] [Cited by in Crossref: 62] [Cited by in RCA: 60] [Article Influence: 2.7] [Reference Citation Analysis (0)] |
| 15. | Pradelli LA, Bénéteau M, Ricci JE. Mitochondrial control of caspase-dependent and -independent cell death. Cell Mol Life Sci. 2010;67:1589-1597. [RCA] [PubMed] [DOI] [Full Text] [Cited by in Crossref: 210] [Cited by in RCA: 220] [Article Influence: 13.8] [Reference Citation Analysis (0)] |
| 16. | Townsend DM, Manevich Y, He L, Hutchens S, Pazoles CJ, Tew KD. Novel role for glutathione S-transferase pi. Regulator of protein S-Glutathionylation following oxidative and nitrosative stress. J Biol Chem. 2009;284:436-445. [RCA] [PubMed] [DOI] [Full Text] [Cited by in Crossref: 247] [Cited by in RCA: 260] [Article Influence: 15.3] [Reference Citation Analysis (0)] |
| 17. | Kim BJ, Ryu SW, Song BJ. JNK- and p38 kinase-mediated phosphorylation of Bax leads to its activation and mitochondrial translocation and to apoptosis of human hepatoma HepG2 cells. J Biol Chem. 2006;281:21256-21265. [RCA] [PubMed] [DOI] [Full Text] [Cited by in Crossref: 340] [Cited by in RCA: 377] [Article Influence: 18.9] [Reference Citation Analysis (0)] |
| 18. | Maeda H, Hori S, Ohizumi H, Segawa T, Kakehi Y, Ogawa O, Kakizuka A. Effective treatment of advanced solid tumors by the combination of arsenic trioxide and L-buthionine-sulfoximine. Cell Death Differ. 2004;11:737-746. [RCA] [PubMed] [DOI] [Full Text] [Cited by in Crossref: 139] [Cited by in RCA: 138] [Article Influence: 6.6] [Reference Citation Analysis (0)] |
| 19. | Yoshida F, Yamamoto T, Nakai K, Kumada H, Shibata Y, Tsuruta W, Endo K, Tsurubuchi T, Matsumura A. Combined use of sodium borocaptate and buthionine sulfoximine in boron neutron capture therapy enhanced tissue boron uptake and delayed tumor growth in a rat subcutaneous tumor model. Cancer Lett. 2008;263:253-258. [RCA] [PubMed] [DOI] [Full Text] [Cited by in Crossref: 6] [Cited by in RCA: 7] [Article Influence: 0.4] [Reference Citation Analysis (0)] |


