Published online Dec 14, 2008. doi: 10.3748/wjg.14.7093
Revised: October 1, 2008
Accepted: October 8, 2008
Published online: December 14, 2008
AIM: To investigate the molecular events involved in liver regeneration following subtotal hepatectomy (SH) as previous studies have largely focused on partial hepatectomy (PH).
METHODS: Male Wistar rats were subjected to 70% PH or 90% SH, respectively, and sacrificed at different times after surgery. Untreated and sham-operated animals served as controls. Serum and liver samples were obtained to investigate liver function, apoptosis (TUNEL assay) and transcription factors (NF-κB, Stat3; ELISA) or cytokines (HGF, TNF-α, IL-6, TGF-α, TGF-β; quantitative RT-PCR) involved in liver regeneration.
RESULTS: Serum levels of ALT and AST in animals with 70% PH differed significantly from sham-operated and control animals. We found that the peak concentration 12 h after surgery returned to control levels 7 d after surgery. LDH was increased only at 12 h after 70% PH compared to sham. Bilirubin showed no differences between the sham and 70% resection. After PH, early NF-κB activation was detected 12 h after surgery (313.21 ± 17.22 ng/mL), while there was no activation after SH (125.22 ± 44.36 ng/mL) compared to controls (111.43 ± 32.68 ng/mL) at this time point. In SH, however, NF-κB activation was delayed until 24 h (475.56 ± 144.29 ng/mL). Stat3 activation was similar in both groups. These findings correlated with suppressed and delayed induction of regenerative genes after SH (i.e. TNF-α 24 h postoperatively: 2375 ± 1220 in 70% and 88 ± 31 in 90%; IL-6 12 h postoperatively: 2547 ± 441 in 70% and 173 ± 82 in 90%). TUNEL staining revealed elevated apoptosis rates in SH (0.44% at 24 h; 0.63% at 7 d) compared to PH (0.27% at 24 h; 0.15% at 7 d).
CONCLUSION: The molecular events involved in liver regeneration are significantly influenced by the extent of resection as SH leads to suppression and delay of liver regeneration compared to PH, which is associated with delayed activation of NF-κB and suppression of proregenerative cytokines.
- Citation: Sowa JP, Best J, Benko T, Bockhorn M, Gu Y, Niehues EM, Bucchi A, Benedetto-Castro EM, Gerken G, Rauen U, Schlaak JF. Extent of liver resection modulates the activation of transcription factors and the production of cytokines involved in liver regeneration. World J Gastroenterol 2008; 14(46): 7093-7100
- URL: https://www.wjgnet.com/1007-9327/full/v14/i46/7093.htm
- DOI: https://dx.doi.org/10.3748/wjg.14.7093
Major hepatectomy is primarily used to treat malignant liver disease and in living donor liver transplantation (LDLT). After resection the remaining liver can regenerate to a fully functional organ[1-3]. Tissue damage due to the surgical process further decreases the amount of healthy remnant liver tissue leading to an additional reduction in functional liver capacity in the postoperative period[4,5]. This situation can lead to liver insufficiency and, ultimately, to liver failure and death[6-8]. Therefore, patients have to fulfil certain criteria, such as the absence of end-stage liver disease, in order to be eligible for extended hepatectomy[1].
The same is true for donors in LDLT. While LDLT is a life saving procedure for the recipient, it is a potentially lethal operation for the donor. Therefore, very stringent criteria have to be fulfilled prior to hepatectomy to ensure donor safety[9-11]. For the donor, fast liver regeneration is imperative to reduce the probability of liver insufficiency[12,13]. Thus, an improvement in regenerative capacity would enhance donor safety and increase the possibility of including individuals who are not eligible for donation due to insufficient liver size[8,14].
As already stated the major concern in major hepatectomy or in the LDLT setting, is efficient regeneration of the remnant or transplanted partial liver, respectively. It has been demonstrated that graft size is of high importance in regenerative processes in the recipient[12]. Liver function parameters and regeneration are significantly better in patients undergoing a small resection than in patients undergoing a liver resection of more than 60%[15]. This effect exceeds a linear size correlation, which led to the conclusion that graft or remnant liver size influences regeneration. The underlying molecular mechanisms, however, are not well understood[16-19]. In particular, the role of proregenerative cytokines (e.g. IL-6 and TNF-α) and the role of transcription factors such as NF-κB are ambiguous[5,20-22].
While previous studies have largely focused on the molecular events after partial hepatectomy, the aim of this work was to investigate liver regeneration after subtotal hepatectomy. We analyzed whether the extent of liver resection has an impact on the activation of transcription factors and the expression of pro- and anti-regenerative cytokines using a rat resection model and compared 70% (partial hepatectomy, PH) and 90% resection (subtotal hepatectomy, SH), respectively.
Six to eight-week-old male Wistar rats were anaesthetized with isoflurane. Seventy percent PH and 90% SH were performed under isoflurane anesthesia as described by Higgins et al[23] and Emond et al[24]. The rats were divided into 4 groups: control group (untreated), sham operation, 70% PH and 90% SH. Serum and liver tissue samples were obtained during surgery and 2 h, 12 h, 24 h, 48 h, 72 h and 7 d after resection (n = 4 at each time point, per group).
Serum concentrations of liver related enzymes (ALT, AST, LDH and bilirubin) were assessed using commercially available enzyme activity tests [ALAT (GPT) FS (IFCC mod.); ASAT (GOT) FS (IFCC mod.); Bilirubin Auto Direct FS; LDH FS IFCC; DiaSys Diagnostic Systems; Holzheim, Germany].
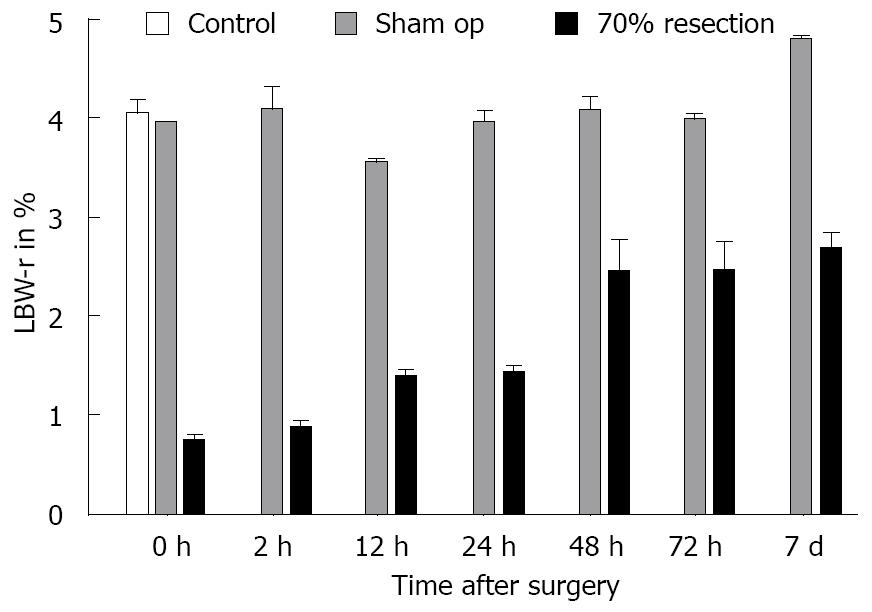
After the observation period, the remnant, regenerated liver was resected and weighed (A) and total body weight (B) was measured. The acquired data were expressed as a percentage of the ratio between the remnant liver weight divided by the total body weight multiplied by 100. Liver body weight ratio (LBW-r, %) = A/B × 100.
Samples of liver tissue (approximately 2-5 g) were placed in 5 mL Trizol and homogenized with an Ultra Turrax (Janke & Kunkel, Staufen, Germany). One mL aliquots of the homogenized samples were used for RNA isolation using chloroform. RNA precipitation was performed using 100% isopropanol. The dry RNA pellet was resuspended in 100 μL Rnase-free water and purified with Rneasy® Mini Kit (Qiagen, Hilden, Germany) according to the manufacturer’s instructions. RNA concentration in the samples was measured by OD 260, purity was determined by OD 260/280.
Samples of liver tissue (approximately 2-5 g) were placed in 3 mL lysis buffer (10 mmol/L HEPES, 10 mmol/L NaCl, 0.1 mmol/L EDTA, 1 mmol/L DTT, 0.4% NP-40) and homogenized with an Ultra Turrax. One mL aliquots of the homogenized tissue were centrifuged at 4°C, 800 g for 5 min. Supernatants were centrifuged again at 4°C, 20 000 g for 30 min and the protein concentration was measured using a Bradford assay (BioRad, Munich, Germany). This fraction was referred to as the cytosolic fraction. The pellet obtained by centrifugation was resolved in 350 μL extraction buffer (20 mmol/L HEPES, 400 mmol/L NaCl, 1 mmol/L EDTA, 1 mmol/L DTT, 0.2% NP-40) and repeatedly vortexed over a 30 min period. After centrifugation at 4°C, 20 000 g for 20 min, the supernatant was collected and the protein concentration measured with the Bradford assay. This fraction was referred to as the nucleic fraction. Proteinase inhibitors (Complete Mini EDTA free, Roche) were added to the extraction and lysis buffers 30 min prior to use.
Changes in mRNA expression were analyzed by quantitative real-time RT-PCR using the iCycler system (Bio-Rad, Munich, Germany). RT-PCR was performed with the QuantiTect SYBR Green RT-PCR kit (Qiagen, Hilden, Germany) to determine the cytokines involved in liver regeneration (TNF-α, IL-6, HGF, TGF-α, and TGF-β; Quantitect Primer Assays, Qiagen, Hilden, Germany). Each PCR was performed using a total 30 μL volume of a mixture containing 2 μL of total RNA (20 ng to 200 ng). Beta-actin expression was chosen for normalization. The quantification was performed using the Pfaffl method[25] by calculating copy numbers from the ct-value for each gene per sample. Beta-actin mRNA levels were calculated in the same manner and the relation of target gene copies/100 000 copies of β actin are given. The data are shown as the mean of four separate experiments.
NF-kappaB (NF-κB p65 ELISA KIT, BioSourceTM CA, USA), and STAT3 [STAT3 (pY705) ELISA KIT, BioSourceTM, CA, USA] ELISAs were conducted according to the manufacturer’s instructions. Negative and positive controls were included and a standard curve was determined for each assay. Sample size of the nucleic protein extract was 10 μL. Normalization was carried out by calculating relative protein concentrations.
Sections of paraffin-embedded tissue were dewaxed by heating to 60°C for 30 min and subsequent washing in xylene. The slices were rehydrated through a grade series of ethanol (100%, 90%, 70%), permeabilized with permeabilization solution (0.1% Triton X-100, 0.1% sodium citrate) and washed twice in PBS. Positive controls were incubated with DNase I for 10 min at room temperature prior to labeling. TUNEL reaction mixture was prepared according to protocol (In Situ Cell Death Detection Kit, Fluorescein; Roche, Germany). Labeling was conducted as described in the assay manual, samples were subsequently embedded in ProLong® Gold antifade reagent with DAPI (Invitrogen, CA, USA). Labeled cells per 10 fields of vision were counted on a fluorescence microscope and absolute numbers were compared.
Data are shown as mean ± SE. Differences between any two groups were determined by the Wilcoxon test for ELISA, qrt-PCR, TUNEL-assay and bilirubin. P < 0.05 was considered to be statistically significant. For differences between any two groups regarding the serum parameters ALT, AST and LDH the variance test was used and F < 0.05 was considered statistically significant.
The overall mean LBW-r was 4.06% ± 0.35% in control and sham-operated animals. After 70% resection, animals showed a continuous increase in LBW-r over 7 d starting from 0.74% ± 0.06% at the time of surgery, and reaching 2.70% ± 0.15% 7 d postoperatively. The earliest significant increase in LBW-r occurred between 2 h (0.88% ± 0.15%) and 12 h (1.39% ± 0.07%) with P = 0.006 (Figure 1).
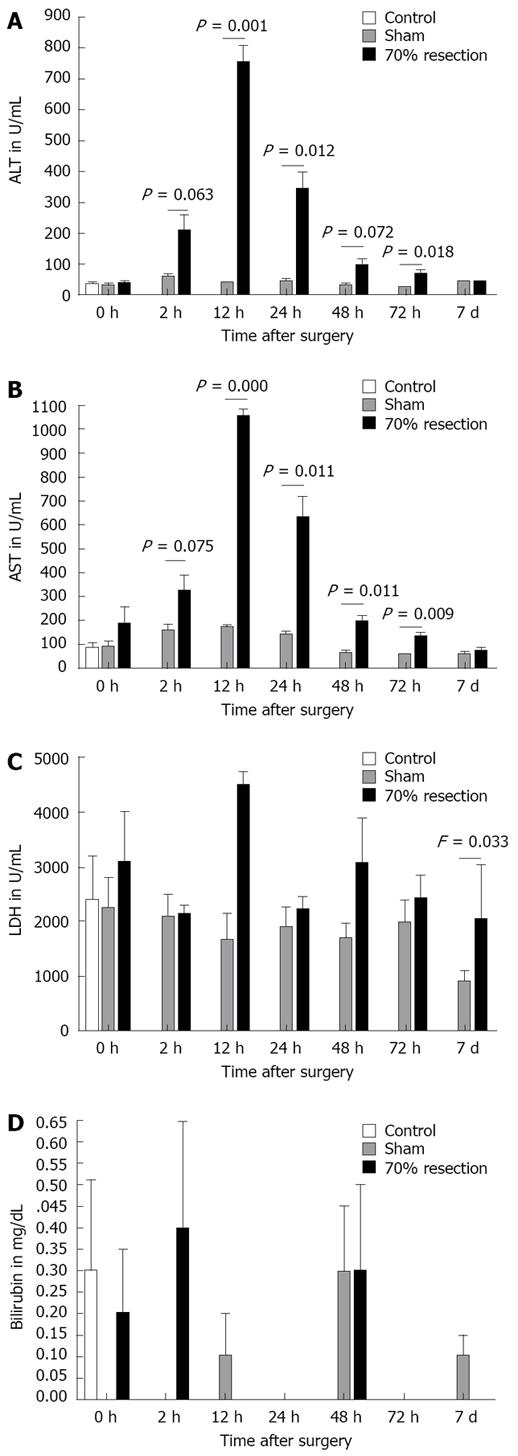
AST and ALT were significantly raised in the 70% resected animals compared to sham-operated rats (Figure 2A and B). Peak levels were found for both enzymes at 12 h postoperatively (AST, 12 h: 1055 ± 55 for 70% and 2204 ± 739 for 90%, F = 0.011; ALT, 12 h: 753 ± 110 for 70% and 1706 ± 725 for 90%, F = 0.011). Serum levels of both enzymes diminished over time, reaching control levels 7 d after surgery. LDH after 70% resection did not differ significantly from sham animals except at 7 d postoperatively (Figure 2C). LDH 7 d after 70% resection was 2060 U/I while the level in sham-operated animals was 890 U/I (F = 0.033). Seventy percent resection did not lead to a significant increase in bilirubin serum levels when compared to sham-operated animals (Figure 2D).
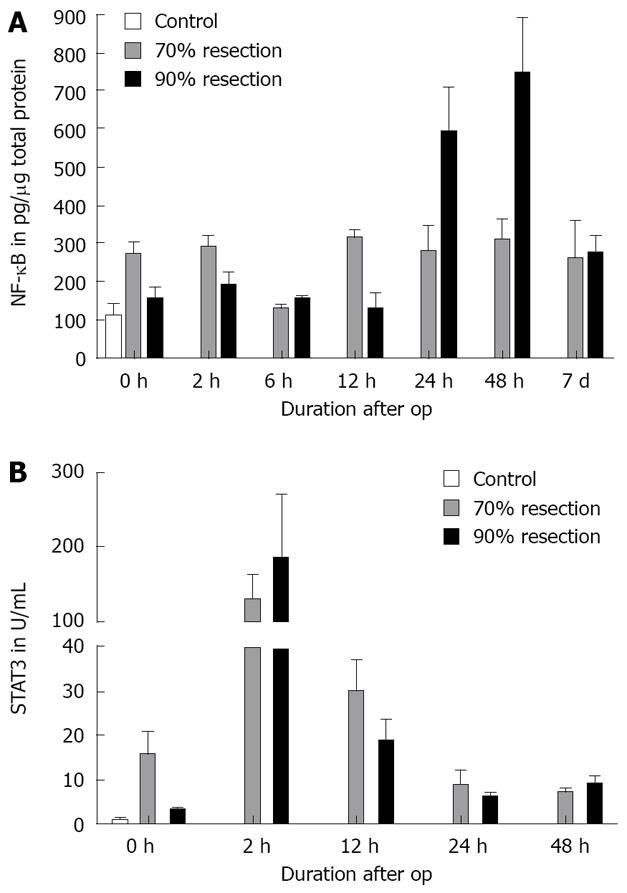
As described in the literature, NF-κB activation was observed after PH during the early phase of regeneration (0 h: 273.33 ± 24.45 pg, P = 0.024; 2 h: 285.34 ± 36.49 pg, P = 0.009) and 12 h postoperatively (313.21 ± 17.22 pg, P = 0.001). NF-κB remained activated until 7 d after surgery in this group. After SH, however, NF-κB activation was delayed until 24 h after the operation. NF-κB was significantly activated in the SH group 24h after surgery (475.66 ± 144.29, P = 0.048) with a peak at 48 h (747.18 ± 146.36 pg, P = 0.02). NF-κB activation was comparable in both groups at day 7 (Figure 3A).
Because we utilized a STAT3(pY705) ELISA, only phosphorylated STAT3 was measured in the assay.
Activation of STAT3 occurred during surgery in both the 70% (16-fold) and 90% (3-fold) resections. Two hours after surgery, STAT3 activation increased significantly in the PH (138-fold) and in the SH group (197-fold), decreasing thereafter and reaching preoperative levels 24 h after surgery. The differences between the two groups did not reach statistical significance (Figure 3B).
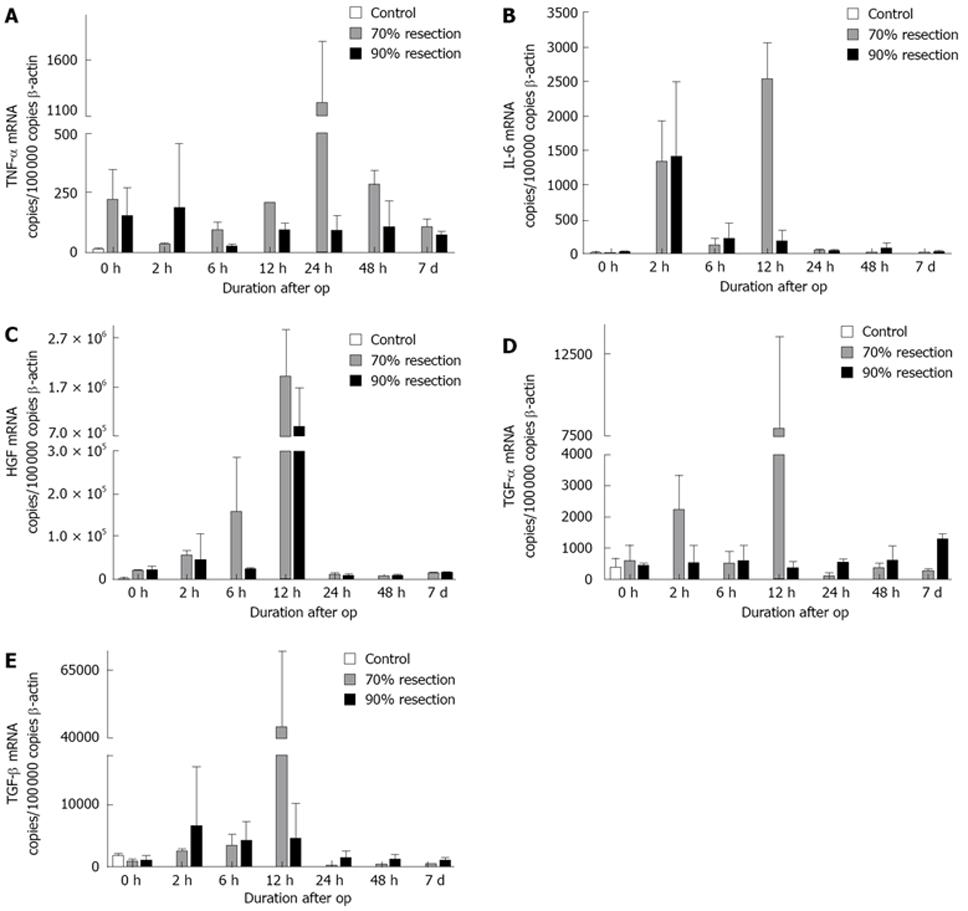
In the group with 70% PH, 6 h after resection a rise in TNF-α expression was detected compared to controls, reaching a maximum after 24 h and decreasing thereafter to preoperative levels. In contrast, a significant rise in TNF-α expression was not detected after SH (Figure 4A). For IL-6, a biphasic expression pattern occurred in PH with high levels of expression at 2 h and 12 h postoperatively, while after SH a significant upregulation was only detected at 2 h after surgery (Figure 4B). Postoperatively, HGF expression increased steadily reaching a maximum at 12 h after surgery and returning to preoperative levels after 24 h in both groups (Figure 4C). A significant increase in early postoperative TGF-α expression was only detected after PH (12 h). At later time points, TGF-α expression was downregulated in this group while it increased up to 7 d after resection in SH (Figure 4D). We detected a slight upregulation in TGF-β expression in both resection groups at early time points (2 h, 6 h) with a strong peak at 12 h postoperatively which was detectable only in the PH group (8.25-fold compared to controls). Thereafter, TGF-β expression returned to control levels (Figure 4E).
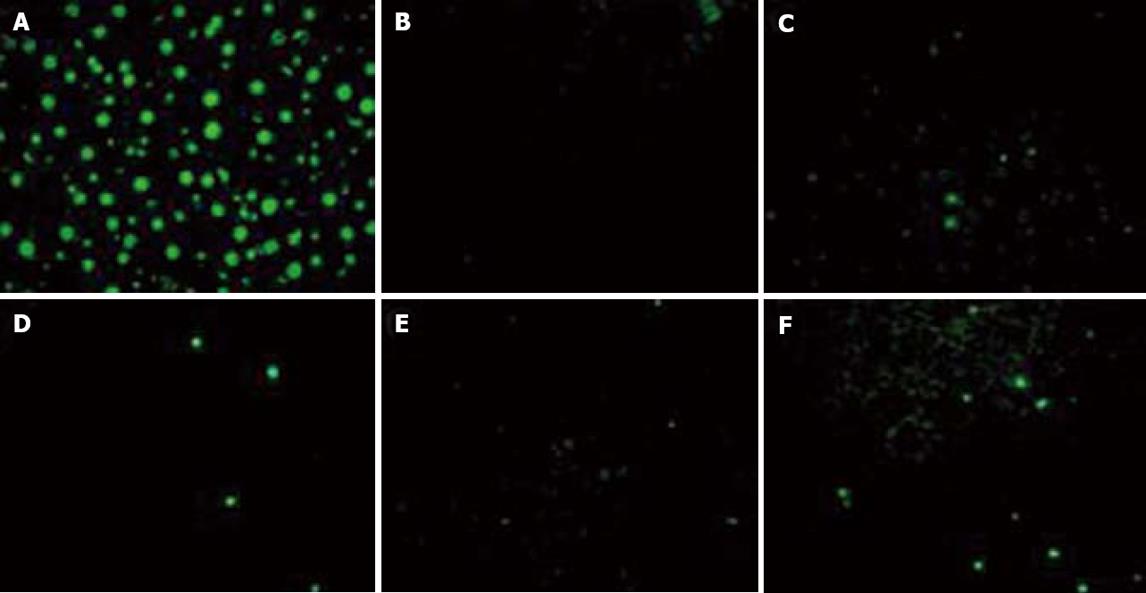
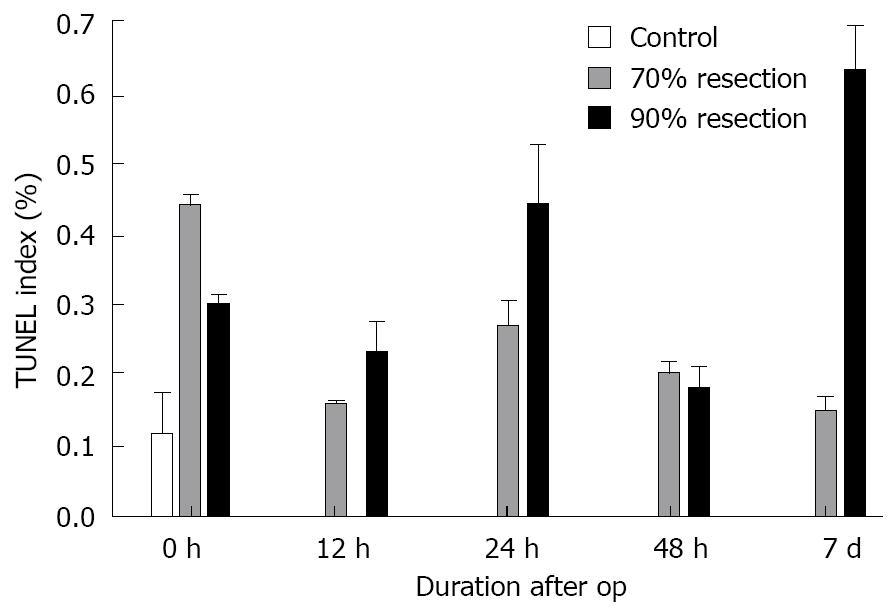
Control animals had a TUNEL index (percentage of TUNEL-positive cells) of approximately 0.12%. After PH, the rate of apoptosis reached a peak directly after surgery (0.44%), followed by a decrease to 0.27% at 24 h and to 0.20% at 48 h and returned to control levels at 7 d (0.15%). After SH, however, the apoptotic peak was delayed until 24 h after surgery, declining to 0.18% at 48 h. In contrast to PH, a second apoptotic peak (0.63%) was detected at 7 d in this group (Figures 5 and 6).
In this study, we analyzed the molecular events in liver tissue after subtotal hepatectomy (expression of proregenerative cytokines, activation of transcription factors and apoptosis) which are, in contrast to partial hepatectomy, not well understood. Our data indicate that activation of proregenerative genes like TGF-α and IL-6 is stronger after PH compared to SH. TNF-α which is also involved in liver regeneration, is induced by PH but not by SH. In addition, HGF expression was higher in PH than in SH. This was associated with stronger activation of NF-κB in PH during the early phase of regeneration. Finally, the apoptotic peak was delayed until 24 h after surgery and had a biphasic course in SH. In PH, apoptosis had a monophasic course and peaked directly after surgery.
These data are in accordance with other experiments from our group, in which we observed higher regenerative capacities and better liver function tests (ALT, AST, bilirubin) after 70% PH compared to 90% SH (Benkö et al, submitted). The time course of liver regeneration differed significantly between 70% PH and 90% SH. Animals with 70% resection showed a significant increase in LBW-r as early as 12 h after surgery. In the PH group, liver weight reached 65% of sham-operated controls 7 d after surgery. In contrast, after 90% resection, LBW-r started to increase 24 h after surgery and reached only 30% of the liver weight compared to controls at day 7. The time course in both groups for AST and ALT was similar although the release of both enzymes into serum was significantly higher after 90% SH, 12, 24 and 48 h postoperatively. LDH levels were similar in both groups until 12 h after surgery where the increase was more prominent in the 90% SH group than in the 70% PH group. At all later time points, LDH decreased in animals with 90% resection compared to controls and the 70% group. Serum bilirubin in the 70% resection group did not differ from the sham group. In animals with 90% resection we found a significant increase in bilirubin from 12 h to 72 h postoperatively. These findings show that damage to liver cells is increased after 90% hepatectomy compared to 70% resection.
Genes related to the initial phase of regeneration, such as TNF-α and IL-6, which prime hepatocytes into a state in which they are susceptible to growth factors[16,17], were expressed at later time points in our model. Nonetheless, both cytokines were expressed at lower levels or were delayed after SH compared to PH. As described previously[18,26-28], growth factors relevant to liver regeneration (HGF and TGF-β) were upregulated in PH, whereas no or only a reduced induction was observed after SH. This suggests that the expression of the factors relevant to the regeneration of liver tissue is influenced by the extent of resection.
For TGF-β we detected a distinct peak at 12 h after PH but not after SH. Since TGF-β has antiregenerative properties[18], high expression levels would be expected to counteract regeneration in this group. On the other hand, regeneration is a very tightly regulated process[19], which implies that high expression of TGF-β could lead to attenuation of ongoing regenerative processes in the PH group, whereas the regenerative stimuli which induce TGF-β expression are lacking in the SH group. This concept is supported by a very tight downregulation of TGF-β in the 70% hepatectomy group at later time points after surgery.
TUNEL indices were significantly raised directly after PH. Although we found a decrease in apoptosis over time, TUNEL indices remained elevated compared to controls. Thus, the data indicate that apoptosis occurs earlier and in parallel with regeneration in animals with 70% resection. In contrast to this, animals with 90% hepatectomy showed slightly higher TUNEL indices at earlier time points and a strong increase in apoptosis 7 d after surgery. This could on the one hand, indicate that there was more tissue damage, which led to a higher number of apoptotic cells during the early postoperative phase. On the other hand, the significant rise in TUNEL indices 7 d after surgery leads to the conclusion that the main phase of remodelling occurs at later time points.
Our data suggest that liver regenerative processes after 90% SH are impaired by reduced or delayed activation of proregenerative factors compared to 70% PH. Activation of NF-κB as well as expression of important cytokines and growth factors depend on the amount of resected liver tissue. The underlying mechanisms are not yet clear, although they may be associated with the liver’s ability to regenerate and to reduce tissue to fit current requirements[16,28].
It is still unclear, which role NF-κB plays during the regenerative process in the setting of extended hepatectomy. A continuous activation was detected at low levels after PH while a delayed and more pronounced activation could be seen after SH. While basal activation of NF-κB may be sufficient and important for regeneration and structural reformation after 70% resection[29], the strong NF-κB activation in animals with 90% hepatectomy may also favor inflammatory processes in the damaged tissue, which counteract the restoration of a functional liver[21,30,31].
In conclusion, our data suggest that the molecular events involved in liver regeneration are significantly influenced by the extent of resection, as subtotal hepatectomy leads to delayed activation of NF-κB and suppression of proregenerative cytokines compared to partial hepatectomy. Therefore, strategies to improve the activation of proregenerative transcription factors and the early production of proregenerative cytokines may improve clinical outcome after extended hepatectomy.
Liver resection is an important therapeutic measure to treat severe liver disease. Imperative for patient outcome is a timely regeneration of healthy liver tissue. Molecular events underlying liver regeneration are not completely understood but involve cytokines such as TNF-α and IL-6 to initiate and growth factors such as HGF and TGF-α to prolong regeneration.
Although some hypotheses for the initiation of liver regeneration after tissue damage exist, it is not known which agents induce cell proliferation. Intrinsic LPS or contaminating bacteria have been discussed as initiating factors, activating TLR-systems in resident immune liver cells, known as Kupffer cells. One important factor in TLR-pathways is the transcription factor NF-κB, which regulates the expression of many genes including regenerative and anti-apoptotic effectors as well as proinflammatory cytokines. In this respect it is still unclear whether NF-κB activation promotes regeneration or contributes to further tissue damage by aggravating postoperative inflammation.
In our experiments we found a clear difference in regenerating liver after SH compared to PH regarding serum parameters and LBW-r. For the known cytokines and growth factors involved in liver regeneration, we detected reduced and/or delayed expression after SH. Furthermore, the SH group displayed a delayed activation of NF-κB. Until this work it was not known if the extent of liver resection had a direct influence on the regenerative capacity at a molecular and cellular level. Here, we demonstrated that the regenerative processes in the liver depend, at least partially, on the extent of resection.
A deeper insight into the molecular events underlying liver regeneration as well as into the relationship between the extent of resection and the regenerative processes may increase the possibility of enhancing regeneration pharmacologically. This would not only improve outcome for patients undergoing extensive hepatectomy but also make this therapeutic measure available for patients with severe liver tissue damage (i.e. cirrhosis), who otherwise would not be eligible for surgery.
We used two models of liver resection. A 70% liver resection described as partial hepatectomy (PH) and a 90% liver resection model of extensive surgical intervention referred to as subtotal hepatectomy (SH).
This manuscript focuses on the regulation of liver regeneration by the extent of resection. The authors of this study provide evidence that SH leads to delayed activation of NF-κB and suppression of proregenerative cytokines compared to PH. The manuscript is clearly written and findings are very interesting.
| 1. | Kassahun WT, Fangmann J, Harms J, Hauss J, Bartels M. Liver resection and transplantation in the management of hepatocellular carcinoma: a review. Exp Clin Transplant. 2006;4:549-558. |
| 2. | Kountouras J, Boura P, Lygidakis NJ. Liver regeneration after hepatectomy. Hepatogastroenterology. 2001;48:556-562. |
| 3. | Chen MF, Jeng LB. Partial hepatic resection for hepatocellular carcinoma. J Gastroenterol Hepatol. 1997;12:S329-S334. |
| 4. | Tian Y, Graf R, Jochum W, Clavien PA. Arterialized partial orthotopic liver transplantation in the mouse: a new model and evaluation of the critical liver mass. Liver Transpl. 2003;9:789-795. |
| 5. | Tian Y, Jochum W, Georgiev P, Moritz W, Graf R, Clavien PA. Kupffer cell-dependent TNF-alpha signaling mediates injury in the arterialized small-for-size liver transplantation in the mouse. Proc Natl Acad Sci USA. 2006;103:4598-4603. |
| 6. | Dahm F, Georgiev P, Clavien PA. Small-for-size syndrome after partial liver transplantation: definition, mechanisms of disease and clinical implications. Am J Transplant. 2005;5:2605-2610. |
| 7. | Zhong Z, Schwabe RF, Kai Y, He L, Yang L, Bunzendahl H, Brenner DA, Lemasters JJ. Liver regeneration is suppressed in small-for-size liver grafts after transplantation: involvement of c-Jun N-terminal kinase, cyclin D1, and defective energy supply. Transplantation. 2006;82:241-250. |
| 8. | Florman S, Miller CM. Live donor liver transplantation. Liver Transpl. 2006;12:499-510. |
| 9. | Pacheco-Moreira LF, Enne M, Balbi E, Halpern M, Peixoto A, Cerqueira A, Moreira E, Araujo C, Pereira JL, Martinho JM. Selection of donors for living donor liver transplantation in a single center of a developing country: lessons learned from the first 100 cases. Pediatr Transplant. 2006;10:311-315. |
| 10. | Moreno Gonzalez E, Meneu Diaz JC, Garcia Garcia I, Loinaz Segurola C, Jimenez C, Gomez R, Abradelo M, Moreno Elola A, Jimenez S, Ferrero E. Live liver donation: a prospective analysis of exclusion criteria for healthy and potential donors. Transplant Proc. 2003;35:1787-1790. |
| 11. | Yokoi H, Isaji S, Yamagiwa K, Tabata M, Nemoto A, Sakurai H, Usui M, Uemoto S. The role of living-donor liver transplantation in surgical treatment for hepatocellular carcinoma. J Hepatobiliary Pancreat Surg. 2006;13:123-130. |
| 12. | Bockhorn M, Schollmann S, Opitz B, Sotiropoulos GC, Sheu SY, Niehaus E, Trippler M, Frilling A, Broelsch CE, Schlaak JF. Vascular endothelial growth factor does not improve liver regeneration and survival after 90% subtotal liver resection. Hepatol Res. 2007;37:353-359. |
| 13. | Bockhorn M, Goralski M, Prokofiev D, Dammann P, Grunewald P, Trippler M, Biglarnia A, Kamler M, Niehues EM, Frilling A. VEGF is important for early liver regeneration after partial hepatectomy. J Surg Res. 2007;138:291-299. |
| 14. | Lechler RI, Sykes M, Thomson AW, Turka LA. Organ transplantation--how much of the promise has been realized? Nat Med. 2005;11:605-613. |
| 15. | Chijiiwa K, Saiki S, Tanaka M. Serum interleukin-6 and hepatocyte growth factor levels in patients after hepatectomy. Hepatogastroenterology. 2002;49:467-471. |
| 16. | Pahlavan PS, Feldmann RE Jr, Zavos C, Kountouras J. Prometheus' challenge: molecular, cellular and systemic aspects of liver regeneration. J Surg Res. 2006;134:238-251. |
| 17. | Qin SW, Zhao LF, Chen XG, Xu CS. Expression pattern and action analysis of genes associated with the responses to chemical stimuli during rat liver regeneration. World J Gastroenterol. 2006;12:7285-7291. |
| 18. | Fausto N. Growth factors in liver development, regeneration and carcinogenesis. Prog Growth Factor Res. 1991;3:219-234. |
| 19. | Fausto N, Campbell JS, Riehle KJ. Liver regeneration. Hepatology. 2006;43:S45-S53. |
| 20. | Yuceturk H, Yagmurdur MC, Gur G, Demirbilek M, Bilezikci B, Turan M, Karakayali H, Haberal M. Role of heparin on TNF-alpha and IL-6 levels in liver regeneration after partial hepatic resection. Eur Surg Res. 2007;39:216-221. |
| 21. | Luedde T, Assmus U, Wustefeld T, Meyer zu Vilsendorf A, Roskams T, Schmidt-Supprian M, Rajewsky K, Brenner DA, Manns MP, Pasparakis M. Deletion of IKK2 in hepatocytes does not sensitize these cells to TNF-induced apoptosis but protects from ischemia/reperfusion injury. J Clin Invest. 2005;115:849-859. |
| 22. | Coelho MC, Tannuri U, Tannuri AC, Mello ES, dos Santos NA. Expression of interleukin 6 and apoptosis-related genes in suckling and weaning rat models of hepatectomy and liver regeneration. J Pediatr Surg. 2007;42:613-619. |
| 23. | Higgins GM, Anderson RM. Experimental pathology of the liver 1: Restoration of the liver of the white rat following partial surgical removal. Arch Pathol. 1931;12:186-202. |
| 24. | Emond J, Capron-Laudereau M, Meriggi F, Bernuau J, Reynes M, Houssin D. Extent of hepatectomy in the rat. Evaluation of basal conditions and effect of therapy. Eur Surg Res. 1989;21:251-259. |
| 25. | Pfaffl MW. A new mathematical model for relative quantification in real-time RT-PCR. Nucleic Acids Res. 2001;29:e45. |
| 26. | Fausto N, Laird AD, Webber EM. Liver regeneration. 2. Role of growth factors and cytokines in hepatic regeneration. FASEB J. 1995;9:1527-1536. |
| 27. | Lowes KN, Croager EJ, Olynyk JK, Abraham LJ, Yeoh GC. Oval cell-mediated liver regeneration: Role of cytokines and growth factors. J Gastroenterol Hepatol. 2003;18:4-12. |
| 28. | Mangnall D, Bird NC, Majeed AW. The molecular physiology of liver regeneration following partial hepatectomy. Liver Int. 2003;23:124-138. |
| 29. | Yang WJ, Zhang QY, Yu ZP, Song QT, Liang HP, Xu X, Zhu GB, Jiang FZ, Shi HQ. Effects of nuclear factor-kappaB on rat hepatocyte regeneration and apoptosis after 70% portal branch ligation. World J Gastroenterol. 2005;11:6775-6779. |
| 30. | Campbell JS, Riehle KJ, Brooling JT, Bauer RL, Mitchell C, Fausto N. Proinflammatory cytokine production in liver regeneration is Myd88-dependent, but independent of Cd14, Tlr2, and Tlr4. J Immunol. 2006;176:2522-2528. |
| 31. | McAllister-Lucas LM, Ruland J, Siu K, Jin X, Gu S, Kim DS, Kuffa P, Kohrt D, Mak TW, Nunez G. CARMA3/Bcl10/MALT1-dependent NF-kappaB activation mediates angiotensin II-responsive inflammatory signaling in nonimmune cells. Proc Natl Acad Sci USA. 2007;104:139-144. |
Peer reviewers: Jian Wu, Associate Professor of Medicine, Internal Medicine/Transplant Research Program, University of California, Davis Medical Center, 4635 2nd Ave. Suite 1001, Sacramento CA 95817, United States; Fanyin Meng, MD, PhD, Assistant Professor, Department of Internal Medicine, Ohio State University, Room 514A Medical Research Facility, 420 West 12th Avenue, Columbus, Ohio 43210, United States
S- Editor Xiao LL L- Editor Webster JR E- Editor Yin DH


