INTRODUCTION
Hepatic stellate cell (HSC, also known as Ito cell) is a minor cell type (roughly 5-8% of the total liver cells) most commonly found in the sinusoidal area of adult livers. The major physiological functions of HSC include fat storage, vitamin A uptake and metabolism, and the production of extracellular matrix (ECM) proteins. It has been demonstrated in the past decade that HSC is a major player in mounting defense during hepatic injury, and mediating hepatic fibrogenesis by over-producing pro-fibrotic cytokines and consequently the ECM molecules. Hence the HSC itself also became a target for the development of anti-fibrotic therapy[1-3].
Traditionally antibodies against desmin[4], vimentin and smooth muscle-alpha-actin (SMAA)[5,6], despite their poor tissue and cell specificity, remained the common battery for identifying rat HSC both in vitro and in vivo, until the re-introduction of GFAP in the mid-1990s[7-9], even though GFAP was first documented as a marker for rat HSC in 1985[10]. It was suggested that the GFAP could be a more reliable marker for marking quiescent HSCs[7]. More recently, the GFAP was also adopted as a marker for human HSCs[11-13].
Several gene promoters have been investigated for their ability to genetically manipulate HSC both in vitro and in vivo, which include the human collagen alpha 1 (ColI)[14-16], SMAA[17], LIM domain protein CRP2 (CSRP2), tissue inhibitor of metalloproteinases-1 (TIMP-1) and smooth muscle-specific 22-ku protein (SM22 alpha)[18,19]. However, none of the promoters tested thus far showed sufficient tissue and cell specificity.
In our own efforts, we constructed a transgene consisting of a 2.2-kb hGFAP promoter[20,21] and the E. coli lacZ coding sequence and tested its expression in a rat HSC line HSC-T6[22]. Our results showed that the 2.2-kb hGFAP promoter was not only capable of directing HSC-specific expression in vitro, but also responding to a known pro-fibrogenic cytokine transforming growth factor (TGF-β1) by upregulation in a dose- and time-dependent manner. Similarly, an induction of the endogenous GFAP by TGF-β1 was also observed. These findings suggested novel utilities for the 2.2 kb hGFAP promoter for specifically manipulating HSC, and developing anti-fibrotic therapy. Furthermore, these findings raised fundamental questions on possible GFAP function in the HSC development and pathobiology.
MATERIALS AND METHODS
Construction of the 2.2 kb hGFAP-lacZ transgene
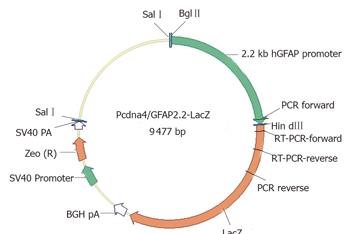
The plasmid vector pcDNA4/TO/LacZ (Invitrogen, CA, USA) was used as a cloning backbone, providing the E. coli β-galactosidase coding sequence and the Zeocin resistance gene. The 2.2-kb hGFAP promoter, which was originally mapped for its astrocytic specificity[20,21], was excised from another transgene GFAP-GFP-S65T[23] by BglII/HindIII digest and used to replace the CMVTetO2 promoter in the pcDNA4/TO/lacZ vector. The cloning junction sequences were verified by DNA sequencing. The resultant 9.5 kb plasmid (as depicted in Figure 1) was designated as pcDNA4/GFAP2.2-LacZ in our vector depository.
Figure 1 GFAP-lacZ transgene construct.
The bacterial lacZ reporter coding sequence was under the control of a 2.2-kb human GFAP promoter. The SV40-Zeocin gene provides a resistance to antibiotic selection for stable clones. Primer locations for PCR and RT-PCR were also indicated.
Cell line and culture conditions
The rat HSC-T6 cell line[22] was a generous gift from Dr Scott Friedman of the Mount Sinai School of Medicine in New York through Dr Alex Hui (Chinese University of Hong Kong). The HepG2, C3A, HeLa and NIH/3T3 were from American Type Culture Collection (ATCC, VA, USA), and the C6 was from Japanese Collection of Research Bioresources (JCRB, Osaka, Japan). All the cell culture media and reagents were from Invitrogen, unless specified otherwise. All cell lines were routinely cultured in full Dulbecco’s modified Eagle medium (DMEM), supplemented with 10% FBS, 100 units penicillin/100 µg streptomycin per mL at 37 oC in a humidified atmosphere of 50 mL/L CO2. The cells were routinely split twice weekly in a ratio of 1:3.
Cell transfection and selection
The T6, C6, and HeLa cells were stably transfected with 0.5-1.0 µg of the SalI-linearized transgene plasmid using the Lipofectamine 2 000 kit, according to the manufacturer’s instructions (Invitrogen). Twenty-four hours after the transfection, the medium was changed and supplemented with 250-500 µg/mL Zeocin for selection for at least 6 wk before further analyses (as described below) were performed. The final concentration for maintaining the stable transfected cells was 500 µg/mL Zeocin. Alternatively, HepG2, C3A, and NIH/3T3 were transiently transfected with the circular transgene plasmid using the FuGene 6 kit (Roche Diagnostics).
Genomic detection of the transgene
In order to confirm the transgene integrity and its integration into the genome, genomic DNA was isolated from cell clones stable for at least 2 mo under 500 µg/mL Zeocin selection, using the NucleoSpin blood kit (Macherey-Nagel, Düren, Germany). A PCR method was used to verify the structural integrity of the inserted construct(s), with a forward primer 5’-ACTCCTTCATAAAGCCCTCG-3’ (complementary to the GFAP promoter), and a reverse primer 5’-AACTCGCCGCACATCTGAACTTCAGC-3’ (complementary to the lacZ coding sequence), using the Platinum PCR SuperMix High Fidelity (Invitrogen) on a thermal cycler (MJ Research, FL, USA). The expected PCR product was 944 bp in size.
RT-PCR GFAP-lacZ transcript
Total cellular RNAs were extracted from cells grown in 6-well plates by using the NucleoSpin RNAII kit (Macherey-Nagel) following the manufacturer’s instructions. The RNA concentration was determined on a ND-100 spectrophotometer (Nanodrop Technologies, DE, USA). Fifty nanograms of total RNA was used to perform a one-step RT-PCR (Qiagen, Hilden, Germany) according to the user’s manual, using forward primer (5’-TCAGCTTGGAGTTGATCCCGTCG-3’) and reverse primer (5’-AACAAACGGCGGATTGACCGTAATGG-3’). The thermal cycling profiles were 50°C 30 min (cDNA synthesis), 95 °C 15 min (denaturation), and followed by 94 °C 10 s 55 °C 10 s, and 72 °C 19 s for 35 cycles (PCR). The target product size was 337 bp, and the β-actin reference was 332 bp in size.
X-gal staining of β-galactosidase activity in fixed cells
A lacZ reporter cell staining kit (InvivoGen, CA, USA) was used to detect the reporter gene activity in both stable and transient transfectants. Development of the blue end product was monitored at different time intervals (15, 30, 60, 90, and 120 min). The staining results were documented with a digital camera (DP12) attached to an Olympus inverted bright field microscope (IX51).
Quantitative solution assay of β-galactosidase activity in cell extracts
To quantify the β-galactosidase activity in cell extracts, an enzyme assay kit (E2 000, Promega, WI, USA) was used to measure the specific activity of β-galactosidase, according to the manufacturer’s instructions in a 96-well format. Briefly, the cells were washed twice with 1×PBS buffer (Ph7.4), lysed for 15 min at room temperature with the reporter lysis buffer, and harvested using a cell scraper. The total cell extracts were appropriately diluted (5-10 folds), and assayed for the enzyme activity. The specific β-galactosidase activity was presented in milliunit per milliliter (mU/mL) using a standard curve established from the β-galactosidase standard (provided with the kit). The protein concentration was measured with a BCA protein assay kit (Pierce, IL, USA), and used to further convert the specific β-galactosidase activity from mU/mL to mU/µg total cellular protein. Final data were summed from six independent experiments.
Treatment of cells with TGF-β1
Cells were seeded into 12-well plates in full DMEM with 500 µg/mL Zeocin. Twelve hours prior to the cytokine treatment, medium was changed so that the cells were allowed to grow in low serum (0.5% FBS) DMEM. The cells at a confluence of 70-80% were incubated with various concentrations (0, 0.1, 1, and 10 ng/mL) of rhTGF-β1 (BioVision, CA, USA) for 0, 2, 8, 16, 24, 48, and 72 h before they were harvested for β-galactosidase activity assay and real-time RT-PCR GFAP assay.
Real-time RT-PCR quantification of rat GFAP mRNA
Total RNA was reversely transcribed to cDNA using Taqman’s reverse transcription reagent (Cat. # N808-0234). A total of 400 ng of RNA in 7.7 µL nuclease-free water was added to 2 µL 10× reverse transcriptase buffer, 4.4 µL 25 mmol/L magnesium chloride, 4 µL deoxyNTP mixtures, 1 µL random hexamers, 0.4 µL RNase inhibitor and 0.5 µL reverse transcriptase (50 U/µL) in a final reaction volume of 20 µL. The reaction was performed for 10 min at 25 °C (annealing), 30 min at 48 °C (cDNA synthesis) and 5 min at 95 °C (enzyme denaturation).
Real-time quantitative PCR was carried out with an ABI 7500 Real Time PCR System (Applied Biosystems, CA, USA). One microliter of sample cDNA was used in each PCR reaction, with the actin gene as a reference. The primers and probes for rat β-actin and GFAP were purchased from Taqman’s assay-on-demand database. The PCR reaction was performed under a default profile consisting of 50 °C for 2 min (UNG activation), 95 °C for 10 min (enzyme denaturation) and 40 cycles of amplification (denaturation 15 s, annealing and extension 60 s).
Relative quantitation of the target mRNA was calculated using the comparative threshold cycle (CT) methods as described in the User Bulletin #2 (ABI Prism 7 700 Sequence Detection System). CT indicates the fractional cycle number at which the amount of amplified target reaches a fixed threshold within the linear phase of gene amplification. ∆CT, which reflects the difference between CT target and CT β-actin, is inversely correlated to the abundance of mRNA transcripts in the samples. ∆CT for each sample was normalized against control experiment or calibrator and expressed as ∆∆CT. Relative quantitation is given by 2–∆∆CT to express the upregulation or downregulation of the target gene under the treatments compared to the control.
Six independent experiments were performed for each data point and three ∆CT were measured for each experiment.
Statistical analysis
All quantitative results were presented as mean ± SE. Experimental data were analyzed using two-tailed Student’s t-test assuming unequal variances. A P-value < 0.05 was considered significant.
RESULTS
Lack of GFAP-lacZ expression in non-GFAP-expressing cell lines
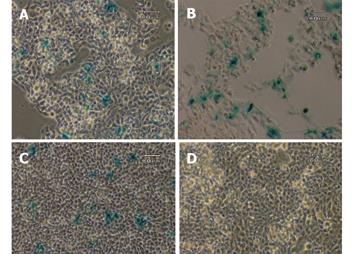
To investigate if there is any possible aberrant expression of the transgene, three non-GFAP expressing cell lines, HepG2, C3A and NIH/3T3, were transiently transfected with the circular transgene plasmid, using a CMV-lacZ plasmid as a positive control. After the transfected cells were grown in full DMEM medium free of selection agent for 2 days, all three cell lines were examined for the β-galactosidase expression by X-gal staining method. Approximately 10-30% of the cells in each of the three lines transfected with the ubiquitous CMV-lacZ showed positive blue color after 2 h of staining. In contrast, none of the three lines transfected with the GFAP-lacZ showed any blue staining, indicating a total lack of lacZ expression driven by the GFAP promoter in these cell lines. Representative images from two independent experiments for all three cell lines are shown in Figure 2. After 24 h of X-gal staining, a few cells from the HepG2 line displayed blue color in both the transfected and nontransfected groups alike (data not shown), most likely due to endogenous galactosidase-like activity.
Figure 2 Transient transfection with CMV-lacZ and GFAP-lacZ transgenes.
Hepatocyte cell lines C3A (A), HepG2 (B), and fibroblast cell line NIH/3T3 (C) transfected with the ubiquitous CMV-lacZ transgene displayed blue color after 2 h of X-gal staining. In contrast, C3A (D), HepG2 (E) and NIH/3T3 (F) transfected with the GFAP-lacZ transgene did not show any blue color. Scale bar = 60 µm.
Specific expression of GFAP-lacZ in GFAP-expressing cell line T6
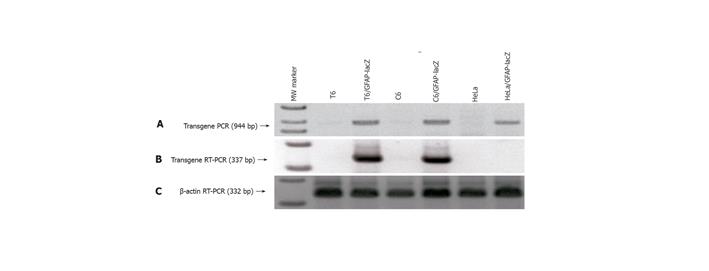
The 2.2-kb hGFAP promoter has been consistently shown to direct gene expression specifically in the neural stellate cells-astrocytes[20,21,24]. It was completely unknown whether a GFAP promoter can direct gene expression specifically in the HSC type. Since stellate cells of both neural and hepatic origins have been reported to share many morphological, immunocytochemical and even developmental features[7-9,25], we decided to test this possibility by stably transfecting a rat HSC line T6[22] with the GFAP-lacZ transgene, using the rat astrocytic C6 cell line as a positive and the human HeLa cell line as a negative control. After selection in 250-500 mg/mL Zeocin for at least 6 wk, several independent stable cell clones were obtained for each cell line. Subsequently, PCR analysis of genomic DNA isolated from the stable clones confirmed the transgene integrity and integration into the host genome, as evidenced by the presence of an anticipated product size of 944 bp (Figure 3A). To check for transgene expression, total RNA was isolated from the stable transfectants and RT-PCR was performed to verify for the lacZ transcript. The presence of a specific band with a predicted size of 337 bp indicated the lacZ transcription in the positive control C6 line, and more importantly in our target T6 line as well, but not in the negative control line HeLa (Figure 3B). The β-actin sample is shown in Figure 3C as a control for equal RNA loading. Next, one clone from each of the three cell lines was randomly chosen for X-gal staining for 1 h. As expected, both the C6 and the T6 were positive and the HeLa was negative in blue staining (Figure 4). Therefore for the first time, a GFAP-based reporter gene was shown to specifically express in a HSC line. The representative staining results are shown in Figure 4. From this point onward, a T6 cell clone stably transfected with the 2.2 kb hGFAP-lacZ transgene (designated as T6/lacZ/C1 clone) was used for further experiments below. It was worth noting that the T6 cells transiently transfected with the GFAP-lacZ transgene stained positive for X-gal reaction as well.
Figure 3 Verification of GFAP-lacZ transgene integration into host genome and legitimate expression in appropriate cell types.
A: PCR of genomic DNA isolated from the transfected T6 (lane 3), C6 (lane 5) and HeLa (lane 7) showed the presence of a transgene band at 944 bp, and the absence of such band from the nontransfected T6 (lane 2), C6 (lane 4), and HeLa (lane 6); B: RT-PCR of total RNAs demonstrated that transgene only expressed in the transfected T6 (lane 3) and C6 (lane 5), but not in the transfected HeLa (lane 7); C: RT-PCR of β-actin as a reference ensuring equal sample loading. Lane 1 is the 1-kb ladder marker.
Figure 4 X-gal staining of stable transfectants.
The GFAP-lacZ transgene expressed in the rat hepatic stellate cell line T6 (A), and the positive control rat astrocytic cell line C6 (B), but not in the non-GFAP-expressing cell line HeLa (C). Scale bar = 60 µm.
Time- and dose-dependent induction of transgene by TGF-β1 in T6/lacZ/C1 cells
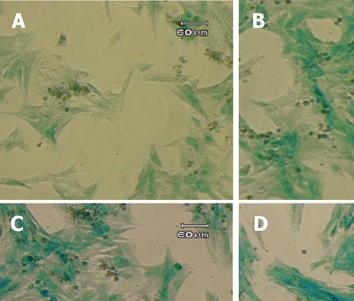
TGF-β1 has been reported to exert broad biological effects on the cells, including the regulation of GFAP in astrocytes[26-29], and the fibrogenesis in the HSC[30-33]. However, very little was known about the potential regulation of GFAP (and GFAP-based transgene) by the potent pro-fibrogenic TGF-β1 in HSC. To obtain a first hint, the T6/lacZ/C1 cells were treated with TGF-β1 at various concentrations (0, 0.1, 1, and 10 ng/mL) in the full DMEM medium for 72 h. The cells were then stained with X-gal for one hour and photographed. When compared to the untreated cells, cells cultured with TGF-β1 displayed a more intense blue staining and activated morphology (thicken cellular processes), as shown in Figure 5.
Figure 5 Induction of GFAP-lacZ transgene expression by TGF-β1.
The T6/lacZ/C1 cells were cultured and incubated in full DMEM supplemented with 0 (A), 0.1 (B), 1 (C), and 10 (D) ng/mL of TGF-β1 for 3 days, and stained with X-gal substrate for 1 h. Cells treated TGF-β1 displayed more intense blue staining and more activated morphology (thicken processes). Scale bar = 60 µm.
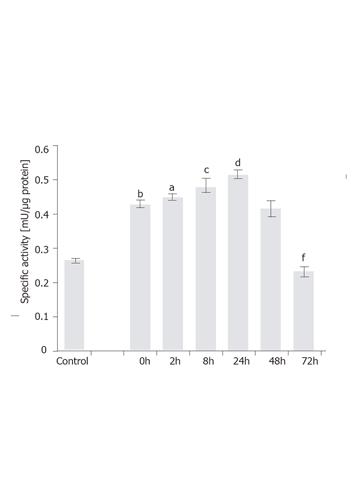
To examine time-dependent induction, the T6/lacZ/C1 cells stimulated with 1 ng/mL of TGF-β1 for various times (0, 2, 8, 24, 48, and 72 h) were assayed for β-galactosidase activity. Firstly, it was interesting to note that the transgene expression was significantly increased (P < 0.001) from 0.29 mU/µg to 0.42 mU/µg (or a 24% increase) by simply lowering the serum concentration from 10% to 0.5% and culturing for 12 h. This acute and transient increase in the transgene expression could be a stress response for cells adopted from full- to lower-serum medium. Secondly, under 1 ng/mL of TGF-β1 the transgene was rapidly induced when measured at 2 h (P < 0.05) and 8 h (P < 0.005), and eventually peaked at 24 h (P < 0.001), with a specific activity being 0.52 mU/µg. At 48 h, the expression level dropped to the same level as at 0 h. After 72 h, the level slipped to 58% of the value at 0 h (P < 0.001). The assay results are depicted in Figure 6.
Figure 6 Time-dependent induction of GFAP-lacZ gene by TGF-β1 in the T6/lacZ/C1 cells.
Cells were grown in full DMEM was assayed for basal β-galactosidase activity (control). Cells adopted in low serum DMEM for 12 h were supplemented with 1 ng/mL of TGF-β1 for various times (0, 2, 8, 24, 48, and 72 h), and assayed for enzymatic activity. When compared to the basal level, cells cultured in low serum DMEM had elevated level of transgene expression (bP < 0.001). When compared the 0 h, transgene expression level was significantly induced at 2 h (aP < 0.05), 8 h (cP < 0.005), and 24 h (dP < 0.001), but significantly reduced at 72 h (fP < 0.001) compared with 0 h. Data presented as mean ± SE.
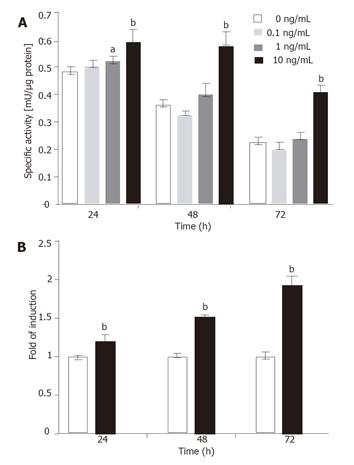
To investigate dose-dependent induction, the T6/lacZ/C1 cells were grown in low serum DMEM with various concentrations of TGF-β1 (0, 0.1, 1, and 10 ng/mL) for various times (24, 48, and 72 h) and assayed for β-galactosidase activity. Significant transgene induction was observed for the 10 ng/mL TGF-β1 treatment at all time points (P < 0.001). However the only other (less) induction was seen with 1 ng/mL of TGF-β1 at 24 h (P < 0.05). The assay results are plotted in Figure 7A. It is interesting to note that when the values of control groups (for 10 ng/mL) were normalized to 1 and the highest induction (nearly two fold) was seen at 72 h, though the absolute enzymatic activity (0.43 mU/µg) was the lowest among the three time points (Figure 7B).
Figure 7 Dose-dependent induction of transgene.
(A) The T6/lacZ/C1 cells cultured in low serum DMEM supplemented with different concentrations of TGF-β1 (0, 0.1, 1, and 10 ng/mL) for various times (24, 48, and 72 h) were assayed for β-galactosidase activity. The transgene was significantly induced by 10 ng/mL of TGF-β1 at all time points. (B) Data extracted from (A) illustrated that the fold of induction increased with times, despite the drop in absolute enzymatic activity. Data presented as mean ± SE. aP < 0.05, bP < 0.001 compared with no cytokine treatment.
Induction of endogenous GFAP expression by TGF-β1
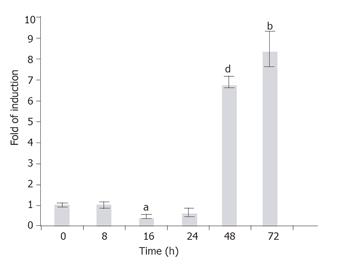
The GFAP, along with other HSC markers desmin, SMAA, and vimentin, was known to express in the HSC-T6 cells[22]. In order to investigate whether the endogenous GFAP expression is also subject to TGF-β1 regulation as the transgene, the T6/lacZ/C1 cells treated with TGF-β1 (1 ng/mL) for various times (0, 2, 8, 16, 24, 48, and 72 h), and the rat GFAP transcripts were quantified using a real-time RT-PCR method. When compared to the basal level (normalized to 1) at 0 h, the GFAP mRNA level remained relatively steady within the first 24 h (except a brief but significant 0.5-fold suppression at 16 h, P < 0.005), then sharply elevated to 7- and 8.5-folds of the basal level at 48 and 72 h, respectively (Figure 8).
Figure 8 Time-dependent induction of the endogenous GFAP gene by TGF-b1.
T6/GFAP-LacZ cells were incubated with 1 ng/mL of TGF-b1 in low serum DMEM for various times (0, 8, 16, 24, 48, and 72 h), and the endogenous rat GFAP mRNA was quantified with real-time RT-PCR. Data were presented as mean ± SE. bP < 0.01, aP < 0.005 and dP < 0.001, when compared to treatment at 0 h.
DISCUSSION
Cell specificity of transgene expression
To our best knowledge, this is the first report demonstrating that a GFAP promoter can drive HSC-specific expression of a reporter gene, in a similar fashion as the endogenous GFAP does. The current findings also provided molecular biology support to the early immunocytochemical observations on the GFAP staining on HSC[7-11,36,37]. Based on our transfection studies of multiple cell types, the 2.2 kb hGFAP promoter is both necessary and sufficient to confer HSC-specific expression in vitro, which was reminiscent to the conclusion made on cultured astrocytes using the same promoter[20]. Several key cis-acting elements, especially the AP-1 site (for binding fos/jun family transcription factors), have been mapped to the so-called B box in the human GFAP promoter from position-1612 to-1489, and proved to be critical for mediating astrocyte-specific transgene expression[20,38,39]. We therefore attempted to speculate that the rat T6 cells should also express a similar set of relevant transcription factors as the astrocytes do, to permit selective GFAP-lacZ expression in HSC. On the contrary, the non-GFAP expressing cell lines (HepG2, C3A, HeLa, and NIH/3T3) may lack appropriate trans-acting factor profile, leading to the complete null expression of the transgene, as judged by RT-PCR and prolonged X-gal staining.
GFAP promoter elements for mediating the induction by TGF-β1
Our quantitative data showed that the 2.2 kb hGFAP-lacZ transgene, as well as the endogenous rat GFAP, were induced by TGF-β1 in a time- and dose-dependent manner in the T6/lacZ/C1 cells. This observation on the HSC was similar to earlier reports on the astrocytes[28,40]. The molecular mechanism underlying the TGF-β1 induction has been extensively studied. A sequence motif resembling the NF-1 (nuclear factor-1) site located in the near upstream (-106 to -153) of the rat GFAP promoter was shown to confer a full response to TGF-β1 induction in cultured astrocytes[40]. Similarly, two NF-1-like sites were mapped to the B (-1612 to -1489) and D (-132 to -57) boxes in the human GFAP promoter[20]. It was also known that some factor(s) in the nuclear extracts from astrocytes could bind to the NF-1 sites and possibly mediates the TGF-β1 induction process.
The endogenous GFAP gene displayed a similar trend in response to TGF-β1 as the 2.2 kb GFAP-lacZ transgene did. However, different responding dynamics were noted between the endogenous GFAP gene and the artificial GFAP-lacZ transgene. First, the transgene induction was obvious within the first 2 h of TGF-β1 stimulation, while the endogenous gene did not show any significant induction until day 2 of the TGF-β1 treatment. The difference in induction time line could be partially due to assay detection sensitivities, presumably with the enzymatic assay (with amplification capability) being more sensitive, therefore showing an earlier induction. An earlier detection of a similar 2.2-kb hGFAP-lacZ transgene was documented in a transgenic mouse model during brain development, in which the transgene showed up several days ahead of the endogenous GFAP[21]. In addition, unknown regulatory elements residing outside the 2.2-kb fragment could also contribute to the different responding profiles between the transgene and the endogenous GFAP. Nevertheless, both the endogenous and transgene at least displayed the same upward trend in responding to the same TGF-β1 cytokine, legitimizing the use of GFAP-lacZ transgene as a surrogate for the endogenous GFAP in studying TGF-β1 stimulation.
Relationship between HSC activation and GFAP (and GFAP-lacZ) expression
Early studies on the rat HSC showed that GFAP expression decreased as quiescent HSCs were activated or transdifferentiated to myofibroblast-like during fibrosis[7-9]. However, the notion of an inverse relationship between the GFAP expression and the HSC activation may not be as simple and straightforward. For example, whether the activated HSCs and myofibroblasts in vivo represented different activation stages of the same cell lineage, or two distinct cell types of different origins remained controversial[41]. It is worthy noting that some recent data showed that activated HSCs expressed higher level of GFAP[11,34,37]. Our current data clearly showed that both the endogenous GFAP and the hGFAP-lacZ transgene were upregulated in a time- and dose-dependent manner in the rat HSC-T6 cells activated by TGF-β1.
Our data demonstrated for the first time that the 2.2 kb hGFAP promoter is capable of expressing the lacZ reporter specifically in the rat HSC-T6 line and responding to TGF-β1 activation by re-regulation, in a similar manner as the rat astrocytic cell line C6. Furthermore our data also suggested that the molecular and cellular mechanisms (relevant trans-acting factors and signaling pathways) underlying the specific GFAP expression and induction are likely conserved in HSC line T6 and in the neural stellate cell line C6 alike. The current findings should provide a valuable genetic tool for manipulating HSCs towards the development of anti-fibrotic therapies.


