INTRODUCTION
Thioacetamide (TAA) is employed as a curing ingredient, a chemical reagent, a raw medicine, a pesticide, a textile dye and a finishing auxiliary. TAA[1-4] is a typical hepatotoxin that causes centrilobular necrosis similar to carbon tetrachloride[5-8] and D-galactosamine[9]. TAA-induced hepatotoxicity via its S-oxide metabolite (thioacetamide-S-dioxide), that interferes with the motion of RNA from the nucleus to the cytoplasm, resulting in structural and functional cellular deformation and leading to membrane injury. TAA induces hepatocyte damage following its metabolism to thioacetamide sulphene and sulphone, via a critical pathway that involves CYP4502E1-mediated biotransformation[10,11]. TAA is a well-known hepatotoxicant whose administration to rodents in vivo causes cell death via both apoptosis and necrosis[2,12,13]. The observed liver enzyme activities of aspartate and alanine aminotransferases (AST, ALT), glutamate dehydrogenase and threonine deaminase were low in the TAA-treated group. The declines were significant for both transaminases and threonine deaminase[14]. TAA (200 μg/mL)-incubated hepatocyte cells exhibited a 40%-62% reduction in the marker enzymes (AST, ALT, and alkaline phosphatase (AP)) and a 50%-61% reduction in both viability and O2 uptake[15]. It may reduce the amount of antioxidant reagents, including vitamin C, vitamin E and glutathione contents[16].
Elevated levels of reactive oxygen species (ROS) are believed to mediate damage by their interaction with proteins, nucleic acids, carbohydrates and lipids[17-19], changing the enzymatic function and forming oxidation products. ROS is maintained at physiologically optimal levels under normal conditions by antioxidant defense systems that contain nonenzymatic antioxidants-glutathione and enzymes such as superoxide dismutases (SOD), catalase and glutathione peroxidase (GPX)[20]. The reduction in the antioxidant defenses and the reduced scavenging capacity reported herein may contribute to oxidative stress in rats with hemorrhagic shock and can be explained by various factors. The observations of apoptosis in liver are based on histochemical changes[2], the participation of ROS[21] and lipid peroxidation[22-24], and cysteine-aspartate proteases3 (caspase 3) activation[16,25] following the administration of TAA. However, the mechanisms of TAA-induced liver injury are not yet completely understood. The rat liver cell line, clone 9, is an epithelial cell line isolated from a young male rat in 1968 and has primarily been used for studies of in vitro carcinogenesis and toxicology. This study was to investigate whether TAA-induced oxidative stresses caused cell death and to seek the pathway that is involved in TAA-induced apoptosis using the rat hepatic epithelial cell line clone 9 as a model and to understand the regulatory mechanisms of TAA-induced liver injury.
MATERIALS AND METHODS
The rat hepatic epithelial cell line clone 9 (CRL-1439, ATCC, USA) was cultured with DMEM/F-12 medium to which 10% fetal bovine serum was added in 50 ml/L CO2 at 37°C.
Experimental treatments
In Expt1, 5 × 10⁵ clone 9 cells were cultured for 12-16 h in 6 wells and the medium was changed. Afterward, 25, 100 or 200 mg/L TAA was added to the wells and incubated for various times to determine the cell viability (MTT assay). In order to get a large enough cell pellet for chemical assay, the density of cultured cells was changed to 2 × 10⁶ and cells were cultured in 25 cm2 flasks. In Expt2, 2 × 10⁶ clone 9 cells were cultured for 12-16 h in 25 cm2 flask and the medium was changed. Then, 100 mg/L TAA was added to the flask and incubated for various periods to measure caspase 3, Bad, Bax and Phospho-P53 contents (Western blot), as well as total GSH and caspase 3 activity. In Expt3, 2 × 10⁶ clone 9 cells were cultured for 12-16 h in a 25 cm2 flask and the medium was changed. Thereafter, 100 mg/L TAA was added to the flask and incubated for various times to examine DNA fragmentation (TUNEL assay) and measure the proportion of apoptosis (flow cytometry).
MTT assay
750 μL of MTT (5 mg/mL, Sigma-Aldrich Chemie GmbH, Deisenhofen, Germany) solution was added to each well and incubated for 4 h. 1 mL of a DMSO working solution (180 mL DMSO with 20 mL 1 N HCl) was added to each well, and the OD of the yellow reaction product was evaluated in an ELISA reader at a wavelength of 570 nm with a reference wavelength of 630 nm after 15 min.
TUNEL assay
DNA strand breaks were identified using the Boehringer TUNEL assay (Boehringer Mannheim, Marburg, Germany). Briefly, cells in each experiment were washed with phosphate-buffered saline (PBS). The cells were fixed and permeabilized using the Starfiqs IQP-200 reagents (Immuno Quality Products, Groningen, The Netherlands) according to the manufacturer’s instructions. Subsequently, the TUNEL reaction mixture (60 min, 37°C) was added and the samples were washed and analyzed using FACSort flow cytometry (Becton Dickinson, New Jersey, USA). The cells that expressed FITC fluorescence were considered to be TUNEL positive. This experiment was performed separately: the observed numbers of apoptotic cells could not be compared directly with those counted in the other experiments. Additionally, this experiment was conducted after a culturing period of 48 h.
Caspase 3 activity assay
The caspase 3 assay was performed according to the method of Hampton et al, 2002[26]. Briefly, cells were treated with lysis buffer (100 mmol/L Hepes, 10% sucrose, 5 mmol/L dithiothreitol and 0.1% Chaps at pH 7.25). The extracted lysates were incubated with DEVD-p-nitroanaline for 3 h at 37°C. Caspase 3-dependent cleavage of p-nitroanaline (pNA) was monitored at 405 nm by spectrophotometry. Caspase 3 activity is expressed in pmol/min per μg protein.
Glutathione assay
Total cellular GSH was measured using a slight modification[27,28] of the Tietze assay [5]. The Tietze assay is a sensitive and specific method for determining the amounts of both reduced (GSH) and oxidized (GSSG) forms of glutathione in unknown samples[28]. A stock buffer solution of 0.1 mmol/L sodium phosphate, pH 7.5, with 1 mmol/L EDTA was prepared in distilled water and utilized to make separate solutions of 12 mmol/L NADPH, 0.1 mmol/L DTNB and 50 U/mL GSH reductase. The assay was carried out directly in 96-well plates. 100 μL DTNB, 20 μL GSH reductase and 20 μL NADPH were added to each well. Absorbance at 405 nm with a reference wavelength of 595 nm was measured for 30 min at room temperature, using an automatic multiwell microplate spectrophotometer (Beckman, Opsys, MR, USA), and final values were calculated as a mean of three readings. The automatic mix function on the microplate reader was utilized to shake the plate before each reading. Standards of known GSSH content were prepared by serial dilution in 1x MES buffer and used to construct a standard curve. The rate of increase in absorbance at each concentration of GSSH standard was linear throughout the 1.5 min assay. The total protein concentration of each sample was determined using a Bio-Rad kit[29] with bovine serum albumin as standard, such that GSH levels could be expressed as μmol per μg protein. All determinations were carried out in multiples of 12 wells.
Western blotting
After treatment, the cells were washed in D-PBS and lysed with protein lysis buffer (137 mmol/L NaCl, 20 mmol/L Tris-HCl, pH 7.4, 1 mmol/L CaCl2, 1 mmol/L MgCl2 and 0.1 mmol/L sodium orthovanadate, containing 1% Nonidet P-40 and 1 mmol/L phenylmercuric sulfonyl chloride). The lysate was centrifuged at 12 000 r/min for 10 min at 4°C and the supernatant was collected. The protein content was determined using Bradford assay (BioRad) with BSA as a standard. The supernatant (total protein 20 μg) was mixed with 6x electrophoresis sample buffer that contained 1, 4-dithiothreithol (DTT). The proteins were separated by electrophoresis on a 10% gradient polyacrylamide slab gel and were electrophoretically transferred to a PVDF membrane (Amersham Life Science, Buckinghamshire, UK). The blots were incubated overnight in 3% BSA /TBS-T buffer (50 mmol/L Tris-HCl, 2.7 mmol/L KCl, 0.01 mol/L phosphate, 0.09% NaCl, pH 7.5 and 0.05% Tween-20) for 2 h. Membranes were incubated for 12-16 h with rabbit anti-caspase 3 polyclonal antibody (in a 1:1000 dilution, MWt 35 kDa, Cat. #9665, Cell Signaling, MA, USA), rabbit anti-Bad polyclonal antibody (in a 1:2000 dilution, MWt 21.5 kDa, Cat. #9292, Cell Signaling), rabbit anti-Bax polyclonal antibody (in a 1:1000 dilution, MWt 20.5 kDa, Cat. #2772, Cell Signaling) or mouse anti-Phospho-P53 monoclonal antibody (in a 1:2000 dilution, MWt 53 kDa, Cat. #9286S, Cell Signaling). After three washes with PBST, the blot was incubated with AP-conjugated secondary antibody for at least 2 h and immunoreactive proteins were visualized using BCIP/NBT (ZYMED, 00-2209). The band intensities of the control and the TAA treatment were determined using PHORETIX (Feng Jin Biomedical & Instruments Co Ltd, 61397/28052 MemoHASP1) and the TAA treatment was compared with the control following-actin normalization.
Statistical analysis
All data are presented as mean ± SE. For each measurement, data obtained at different times were compared statistically (P < 0.05) by one-way analysis of variance (ANOVA) with a Duncan multiple range test from SAS/STAT for multiple comparisons. A P value of less than 0.05 was considered to indicate a significant difference.
RESULTS
Cell viability
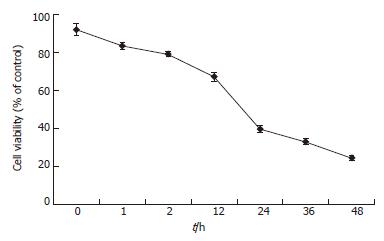
To determine the effective concentration of TAA, various concentrations of TAA were added to the clone 9 cell line, respectively. The cell survival rate fell to 67% and 40% at 12 and 24 h after 100 mg/L TAA-treated clone 9 was applied, respectively (Figure 1). Treatment with a low concentration (25 mg/L) of TAA did not cause significant cell death at 48 h (data not shown). Nevertheless, 200 mg/L TAA was too toxic for clone 9 cells and most cell death occurred within 2 h of treatment. Thus, 100 mg/L TAA was chosen for the subsequent experiments.
Figure 1 Cell viability of clone 9 after treatment with 100 mg/L TAA for various periods.
The results were obtained using MTT assay. Data are presented as mean ± SE. Individual experiment was repeated three times and each time point of treatment was triplicate.
Total GSH content
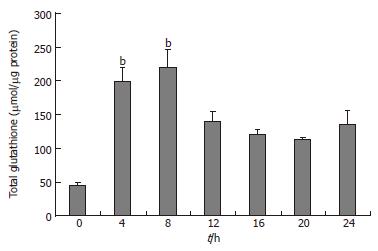
The clone 9 cells were treated with 100 mg/L TAA for various times (4, 8, 12, 16, 20, and 24 h). The total glutathione (GSH plus GSSG) of cell homogenate was measured. The total GSH content of the 100 mg/L TAA-treated clone 9 cells was elevated at 4 h and reached a peak level at 8 h (P < 0.05). Afterward total GSH content of the 100 mg/L TAA-treated clone 9 cells declined from 12 h to 24 h compared to that of the TAA-treated 4 h (Figure 2).
Figure 2 Total glutathione (GSH and GSSG) of clone 9 after treatment with 100 mg/L TAA for various times.
Data are presented as mean ± SE. bP < 0.001 vs the control (0 h). Individual experiments were repeated three times and each time point of treatment was triplicated.
Caspase 3
The clone 9 cells were treated with 100 mg/L TAA for various times (4, 8, 12, 16, 20, and 24 h). The caspase 3 activity and protein content (Western blot) of cell homogenate were determined. The caspase 3 activity of the 100 mg/L TAA-treated clone 9 cells reached a peak between 8 and 12 h (Figure 3A). The caspase 3 protein content of the 10 mmol/L TAA-treated clone 9 cells was gradually elevated from 4 h and reached a peak between 8 and 16 h (Figure 3B).
Figure 3 A: Caspase 3 activity; B: Caspase protein level (Western blot); C: Alterations of caspase protein compared to H0 (zero hour) after β-actin normalization (Western blot) in clone 9 after treatment with 100 mg/L TAA for various times.
Data are presented as mean ± SE. aP < 0.05 vs the control (0 h); bP < 0.01 vs the control (0 h). Individual experiments were repeated three times and each time point of treatment was triplicate.
DNA fragmentation
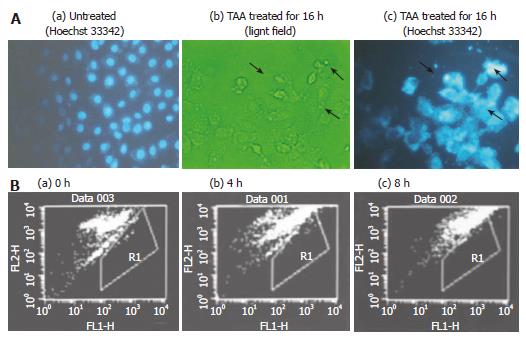
The cell morphology was changed and irregularly shaped DNA was distributed close to the interior of the cell membrane, appearing like an apoptotic body (Figure 4A). Hoechst 33342 and TUNEL assay were applied to elucidate the type of cell death after TAA-treated clone 9 cells. The occurrence of apoptosis increased by 23% at 8 h after 100 mg/L TAA-treated clone 9 cells (Figure 4B).
Figure 4 A: Morphology of clone 9 cell; (a) untreated (Hoechst 33342 staining); (b) after treatment with 100 mg/L TAA treatment for 16 h (light field); (c) after treatment with 100 mg/L mmol/L TAA for 16 h (Hoechst 33342, 5 mg/mL in PBS).
The arrow indicates the apoptotic cells; B: Flow cytometry of apoptosis in clone 9 cells (TUNEL assay) after treatment with 100 mg/L TAA for various times (a) 0 (b) 4 and (c) 8 h. R1 presents the area of cell apoptosis. Individual experiments were repeated three times and each time point of treatment was triplicate.
Phospho-P53 expression
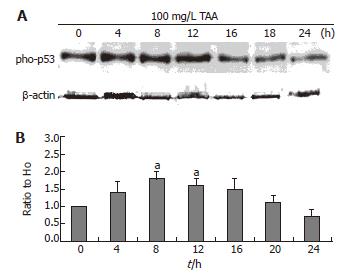
The clone 9 cells were treated with 100 mg/L TAA for various times (4, 8, 12, 16, 20, and 24 h). The phospho-P53 protein (Western blot) of cell homogenate was determined. The phospho-P53 expression of 100 mg/L TAA-treated clone 9 cells was increased at 4 h and maintained to 8 and 12 h (P < 0.05) (Figure 5).
Figure 5 A: Phospho-p53 protein level (typical data, Western blot); B: Alterations of phospho-p53 protein as compared to H0 following β-actin normalization of clone 9 after treatment with 100 mg/L TAA for various times.
Data are presented as mean ± SE. aP < 0.05 vs the control (0 h). Individual experiments were repeated three times and each time point of treatment was triplicate.
Bax and Bad expressions
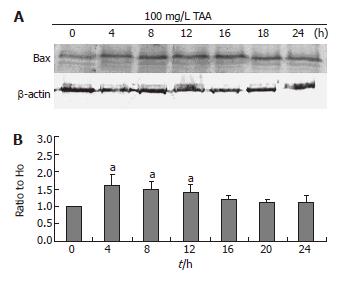
The clone 9 cells were treated with 100 mg/L TAA for various times (4, 8, 12, 16, 20, and 24 h). The Bax and Bad protein (Western blot) of the cell homogenate were determined. The Bax and Bad expressions of 100 mg/L TAA-treated clone 9 cells were elevated at 4 h (P < 0.05) and maintained to 8 and 12 h (P < 0.05) (Figures 6 and 7). These results were consistent with the phospho-P53 expression.
Figure 6 A: Bax protein level (typical data, Western blot); B: Alterations of Bax protein as compared to H0 following β-actin normalization of clone 9 after treatment for various times with 100 mg/L TAA.
Data are presented as mean ± SE. aP < 0.05 vs the control (0 h). Individual experiment was repeated three times and each time point of treatment was triplicate.
Figure 7 A: Bad protein level (typical data, Western blot); B: Alterations of Bad protein as compared to H0 following β-actin normalization of clone 9 after treatment for various times with 100 mg/L TAA.
Data are presented as mean ± SE. aP < 0.05 vs the control (0 h). Individual experiments were repeated three times and each time point of treatment was triplicate.
DISCUSSION
In the present study, rat hepatic epithelial cell line clone 9 was found apoptotic following TAA-induction.
Total GSH
The binding of the reactive compound thioacetamide-S dioxide to tissue macromolecules may be responsible for hepatic necrosis, apoptosis[16], perturbations of mitochondrial activity[30,31] and the elevation of serum cytokine levels. Several studies of rats and cultured cells have shown the involvement of oxidative stress in the etiology of TAA-induced liver damage. In these works, TAA caused lipid peroxidation[29,32-35]; increased the susceptibility of hepatocytes to in vitro lipid peroxidation[23]; reduced the GSH/GSSG ratio[23,34,36,37], increased GSH synthesis[33], alterations in low molecular weight[16] and the formation of enzymatic antioxidants[36-38]. The data herein revealed that the total GSH content of 100 mg/L TAA-treated clone 9 cells was elevated at 4 h, reached the highest level at 8 h and decreased from 12 to 24 h (Figure 2). The method in this work detects the total level of GSH. It addresses not only the origin of intracellular GSH and GSSG but also that of the new generation of GSH. Accordingly, total GSH represents the level of cell to anti-oxidative stress. TAA induces oxidative stress, causing the hepatocytes to have a high total GSH content.
Dependence of apoptosis on caspase 3
The discovery of a family of cysteine-aspartate proteases (caspases) and their participation in signaling and apoptosis indicates the critical importance of these enzymes in this form of cell death[39]. When cells are caused to undergo apoptosis, caspases-in particular caspase 3-cleave ICAD to dissociate the CAD: ICAD complex, allowing CAD to cleave chromosomal DNA[40]. This study tested caspase 3 protein expressions by western blotting and detected caspase 3 enzyme activity to determine the time point of hepatic apoptosis with TAA treatment. The data herein demonstrate that enzyme activity and western blotting both indicated that caspase 3 activity and the protein of caspase 3 in the 100 mg/L TAA-treated clone 9 cells peaked between 8 and 12 h. The apoptosis caused by TAA involved the activation of caspase 3.
Phospo-p53 and Bax/Bad
In the signaling process associated with apoptosis, the membrane integrity of mitochondria plays an important role and is regulated by the Bcl-2 protein. On the basis of structural and functional attributes, Bcl-2 proteins can be divided into three subgroups; (1) anti-apoptotic channel-forming Bcl-2 proteins with four BH domains (BH1 to -4) and a transmembrane anchor sequence, (2) proapoptotic channel-forming proteins with all but the BH4 domain (Bax, Bak and Bok) and (3) proapoptotic ligands (BAD, BOD/Bim and BID) that contain only the BH3 domain[41-43]. The first two subgroups of proteins are believed to be anchored on the mitochondrial membrane, while the third subgroup of proteins act as ligands that dimerize with the membrane-anchored, channel-forming Bcl-2 “receptors”[44,45]. The BH3 domains in the third subgroup are critical for the binding activity of these ligands. Proapoptotic BOK and BAX with a channel-forming domain regulate apoptosis by releasing APAF-1 because of suppression by anti-apoptotic proteins and by promoting the release of cytochrome c[46]. Most studies that compare Bax and cytochrome c proteins in cytosolic and mitochondria demonstrate the results of Bax translocation[47]. In this work, after TAA treatment, the total protein levels of Bax and Bad are elevated perhaps because the regulation of Bax genes increases the amount of Bax protein and the translocation into mitochondria, disintegrating the membrane and causing cell death. The increment of cytosolic Bad protein may be caused by phospho-Bad dephosphorylation; the dephosphorylated Bad and Bcl-XL then generates a dimer that influences the release of cytochrome c and, consequently, apoptosis[48]. DNA damage activates latent tetramers of p53 to bind in a loosely defined DNA recognition sequence within target gene regulatory elements; p53 then typically activates gene transcription[49,50]. The activation of DNA binding and subsequent transactivation activities of p53 occur via a phosphorylation-acetylation cascade[51]. The carboxyl- terminus of p53 is phosphorylated in response to DNA damage, as is the amino-terminus; the effects of the amino- and carboxyl-terminal modifications on p53 determine its downstream specificity. Overall, the combination of different phosphorylation and acetylation events that affect p53 tetramers probably determine binding preferences of the downstream target gene-response elements, causing DNA damage-induced signaling via p53 phosphorylation. In this work, the expression levels of phospho-p53 and Bax are increased 4 h after treatment with TAA. The apoptotic rate reached 23% at 8 h after treatment with TAA. This difference may be caused by the activation by ROS of p53. The formation of free radicals and the increase in ROS by H2O2 constitute the mechanism of apoptosis[52-57]. The H2O2-induced apoptosis penetrates the cell membrane[58] and alters Ox-red and free OH-damaged DNA[59].


