INTRODUCTION
Intestinal ion fluxes are regulated by several agents including neurotransmitters, hormones, or paracrine agents[1]. We obtained evidence that growth hormone (GH) and nitric oxide (NO) act as modulators in this network[2-5]. GH increases basal intestinal water and ion absorption in in vivo and in vitro animal models and is also capable of substantially reducing ion secretion induced by agonists of cAMP, cGMP, or intracellular Ca2+, the second messengers of ion secretion[4,5]. Using the human intestinal cell line Caco-2, we showed that the GH effects on ion transport result from direct interaction with the enterocyte[2]. Free radical NO acts as a second messenger of several GH effects on human metabolism[6]. NO production is decreased in patients with untreated GH deficiency, while treatment with recombinant human growth hormone (rhGH) increases NO formation[7]. In the past decade NO has emerged as a signalling molecule mediating a broad spectrum of intestinal processes, such as gastrointestinal motility, inflammatory changes, malignancy, mucosal blood flow and transepithelial ion transport[8,9]. NO is a gas with a half life of less then 5 s generated through a series of regulated electron transfer steps by a family of P450-like enzymes, termed nitric oxide synthases (NOS)[10,11]. Two NOS are continuously present and are termed constitutive nitric oxide synthase (cNOS). These two isoforms are Ca2+/calmodulin-dependent, produce small amounts of NO in short bursts and are involved in homeostatic processes. A third isoform, which is Ca2+/calmodulin-independent, is induced by intestinal injury and inflammation. This latter isoform, termed inducible nitric oxide synthase (iNOS), requires a lag period of at least 2-3 h and, once expressed, produces large amounts of NO for longer time[13,12]. NO can be directly produced by enterocytes through both the constitutive and the inducible NOS isoforms[3,13,14]. An important feature of the NO effect is its concentration-dependence. Leading to the concept that NO often acts as a double-edged sword mediator with beneficial as well as detrimental effects. While at lower concentrations it maintains a basal ion intestinal pro-absorptive tone, it increases in several pathologic states such as inflammatory bowel diseases, toxic megacolon, and infectious gastroenteritis, contributing to ion secretion[8,12,15]. Recently, we showed that under basal conditions the intracellular cAMP concentration ([cAMP]i) is downregulated in the enterocyte by a cNOS-dependent NO production. Furthermore, in the presence of a cAMP-dependent stimulated secretion, cNOS is activated functioning as a breaking force of ion secretion[3]. This raised the hypothesis that the enterocyte is capable of self-regulating its own ion transport process through the activation of the cNOS-NO pathway which is able to modulate the [cAMP]i level[3]. The aim of this study was to determine whether NO is also involved in mediating the ion absorptive effects triggered by an extracellular stimulus. Specifically, we tested the hypothesis that the cNOS-NO-cAMP pathway is implicated in the pro-absorptive and in the anti-secretory effect induced by GH at the intestinal level. We used the Caco-2 in vitro cell model, previously validated for investigating the GH and the NO intestinal effects[2].
MATERIALS AND METHODS
Cell culture
Caco-2 cells were obtained from the American Type Culture Collection (Rockville, MD). Cells were grown in Dulbecco’s Modified Eagle’s Medium (DMEM) with high glucose concentration (4.5 g/L) supplemented with 10% FCS, 1% nonessential amino acids, penicillin (50 mU/mL), streptomycin (50 mg/mL) and were incubated in 50 mL/L CO2-950 mL/L air. Medium was changed daily.
Ion transport studies
Cells were grown on uncoated polycarbonate transwell filters as previously described and used for intestinal transport studies at 15 d post-confluence[3]. The filter area was 4.9 cm2. Each filter was mounted in an Ussing chamber (World Precision Instrument, Sarasota, FL) as a flat sheet between the mucosal and the serosal compartment. Each compartment contained 10 mL of Ringer’s solution with the following composition (in mmol/L): NaCl (114), KCl (10), Na2HPO4 (1.65), NaH2PO4 (0.3), CaCl2 (1.25), MgCl2 (1.1), NaHCO3 (15), glucose (19). In experiments performed to investigate the role of Cl- in the electrical response, SO4- substituted Cl- at an equimolar concentration. The incubation fluid was circulated by a thermostat-regulated circulating pump and continuously gassed with 95% O2-5% CO2. Transepithelial potential difference (PD), short-circuit current (Isc) and tissue ionic conductance (G) were monitored by an automatic voltage-clamp device (DVC 1000, World Precision Instrument, Sarasota, FL) as described elsewhere[16], before and after mucosal or serosal addition of GH, cholera toxin (CT), and the specific NOS inhibitor Nω-nitro-L-arginine methyl ester (L-NAME). Isc is expressed as microamperes per square centimeter (μA/cm2), G as millisiemens per square centimeter (mS/cm2), and PD as millivolts (mV). Caco-2 cell monolayers, pre-incubated for 20 min with GH (4 × 10⁻⁹ mol/L) on the serosal side, were exposed to CT (6 × 10⁻⁸ mol/L) on the mucosal side, in the presence or the absence of L-NAME (2 × 10⁻⁴ mol/L) added to both sides. The maximal effective concentrations of GH, CT and L-NAME were determined by dose-response experiments (data not shown). Cell viability was evaluated at the end of each experiment by measuring the electrical response to the serosal addition of theophylline (5 × 10⁻³ mol/L).
Intracellular cAMP concentration determination
To test the hypothesis that GH specifically counteracts the CT-induced cAMP increase, we determined the modifications in [cAMP]i after 1 h of incubation with GH and CT, alone or in combination, and in the presence or the absence of L-NAME. [cAMP]i in Caco-2 cells which was measured by using a commercial kit (Biotrak cyclic AMP assay system; Amersham International, Amersham, UK), as previously described[17].
Western blot analysis
Caco-2 cells were stimulated with GH (4 × 10⁻⁹ mol/L) for 1, 6 or 24 h. Cells were then scraped into PBS buffer and lysed in a buffer containing 1% Tergitol (Nonidet P-40) with the following composition: KCl, 60 mmol/L; β-mercaptoethanol, 14 mmol/L; EDTA, 2 mmol/L; HEPES pH 7.9, 15 mmol/L; sucrose, 0.3 mol/L; aprotinin, 5 μg/mL; leupeptin, 10 μg/mL; pepstatin, 2 μg/mL; phenylmethylsulfonyl fluoride, 0.1 mmol/L. Whole cellular extracts were centrifuged at 1500 g for 20 m at 4°C. Protein content was determined by the Bradford method (Bio-Rad Laboratories, Munchen, Germany). The supernatant containing the solubilized proteins was then boiled for 5 min in Laemly buffer (tris-HCl pH 6.8, 62.5 mmol/L; SDS 2%; glycerol 10%; 2-mercaptoethanol 5%; bromophenol blue 0.001%). Cell proteins (50 μg/lane) were added to an SDS-polyacrylamide gel electrophoresis (PAGE) and transferred onto a nitrocellulose membrane (BioBlot-NC-Costar, Corning Incorporated, Canada). Blots were blocked with T-TBS buffer (tris-HCl pH 8.8, 10 mmol/L; NaCl, 150 mmol/L; Tween 20, 0.05%) containing 3% albumin, and probed for 1 h with affinity purified anti-human NOS1 (1:2000) dilution ratio, NOS2 (1:200) or NOS3 (1:1000) rabbit polyclonal antibodies. Bound antibody was detected with anti-rabbit immunoglobulin horseradish peroxidase-linked whole antibody and developed by chemiluminescence reaction (Amersham Pharmacia Biotech, UK). Gamma-interferon (50 000 U/mL) was used as a positive control in experiments performed using anti-iNOS antibodies.
Nitrite/nitrate (NO2-/NO3-) production
The combined concentration of nitrite and nitrate, the degradation products of NO in the culture medium, was determined by the Griess reaction after nitrate reduction[18]. Total nitrite/nitrate production was referred to NO production. Experiments were performed using normal or Ca2+-free Ringer’s solution to investigate the involvement of the cNOS isoform (the Ca2+/calmodulin-dependent isoform or NOS1). The modified Ringer’s solution had the following composition (mmol/L): NaHPO4, 1.65; NaH2PO4, 0.3; NaHCO3, 15, NaCl, 53; KCl, 10; Na2SO4, 30.5; MgCl2, 2.35; glucose, 19; EDTA, 0.5.
Chemicals
All chemicals were of reagent grade and were obtained from Sigma Chemicals Co. (St. Louis, MO, USA). Culture media were from Life Technologies GIBCO BRL (Mascia e Brunelli, Milan, Italy). Transwell filters and supports were from Costar (Costar Italia, Milan, Italy). rhGH was obtained from Serono (Industria Farmaceutica Serono, Rome, Italy). Anti-cNOS and anti-iNOS polyclonal antibodies were obtained from Santa Cruz Biotechnology (Santa Cruz, CA, USA). Anti-iNOS polyclonal antibodies were purchased from Transduction Laboratories (ABD Company, Lexington, KY, USA).
Statistical analysis
Each experiment was run in duplicate and repeated at least 3 times. Results are expressed as mean ± SD. Repeated-measures ANOVA were applied using the Bonferroni test for multiple comparisons. The significance was set at 5%. The SPSS software package for Windows (release 11.0.1; SPSS Inc., Chicago, IL, USA) was used for statistical analysis.
RESULTS
Intestinal transport studies
GH (4 × 10⁻⁹ mol/L) and L- NAME (2 × 10⁻⁴ mol/L) caused opposite effects on basal Isc. GH induced a decrease and L-NAME induced an increase in Isc. Both effects were totally related to PD modifications, as no significant variations of G were recorded. Pre-treatment with L-NAME (2 × 10⁻⁴ mol/L) for 5 m almost abolished the electrical response to GH (Figure 1). The addition of CT (6 × 10⁻⁸ mol/L) to Caco-2 cells induced an increase in Isc. Both the GH and CT effects were Cl--dependent as demonstrated in the experiment done in Cl- free Ringer solution. Thus, in the absence of Cl- the electrical effects were virtually abolished indicating that they were entirely due to transepithelial Cl- transport modifications (data not shown). Pre-incubation with GH for 20 m substantially reduced the CT effect on Isc. However, pre-incubation with L-NAME resulted in total abrogation of the antagonistic effect of GH on the CT-induced electrical response (Figure 2).
Figure 1 A: Time course of the effect on short-circuit current (Isc) of GH (4 × 10⁻⁹ mol/L) and L-NAME (2 × 10⁻⁴ mol/L), alone or in combination, to Caco-2 cells mounted in Ussing chambers; B: Isc peak after L-NAME or GH addition, alone or in combination, to Caco-2 cells mounted in Ussing chambers.
Data are mean ± SD of 6 different observations. aP < 0.05 GH vs L-NAME + GH.
Figure 2 A: Time course of the GH (4 × 10⁻⁹ mol/L) effect on CT (6 × 10⁻⁸ mol/L)-induced short-circuit a current (Isc) increase in the absence or in the presence of L-NAME (2 × 10⁻⁴ mol/L) in Caco-2 cells mounted in Ussing chambers.
The arrows indicate the time of addition of each agent; B: Maximal Isc increase after CT addition, alone or in the presence of GH alone or in combination with L-NAME. A total abrogation of the antagonistic effect of GH on the CT-induced electrical response was observed in the presence of L-NAME. Data are mean ± SD of 6 different observations. aP < 0.05 CT alone vs GH + CT; cP < 0.05 GH + CT vs L-NAME + GH + CT.
Intracellular cAMP concentration determination
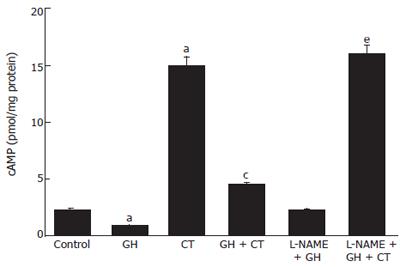
Incubation with GH (4 × 10⁻⁹ mol/L) resulted in significant reduction of basal [cAMP]i. On the contrary, incubation with CT induced an increase in [cAMP]i. The addition of L-NAME produced a significant increase in basal and in CT-stimulated [cAMP]i. Pre-incubation with GH for 20 min resulted in a reduction of the CT-induced [cAMP]i increase. Finally, the addition of L-NAME resulted in total inhibition of the GH-induced decrease in basal [cAMP]i as well as a total abrogation of the GH effect on CT-induced [cAMP]i increase (Figure 3). These results point to a role of NO either under basal conditions or in response to external stimuli which drive ion fluxes toward an absorption pattern.
Figure 3 Modification of intracellular cAMP concentration in Caco-2 cells after incubation with GH, CT, alone or in combination, in the presence or in the absence of L-NAME.
Data are mean ± SD of 6 different observations. aP < 0.05 vs control; cP < 0.05 CT alone vs GH + CT; eP < 0.05 GH + CT vs L-NAME + GH + CT.
Western blot analysis
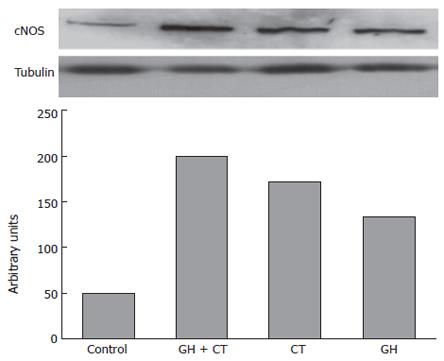
Caco-2 cells showed low but detectable basal cNOS protein expression (Figure 4). Western blot analysis performed after 1 h of incubation with GH revealed the amplification of a 160 kD band corresponding to human NOS 1. Simultaneous incubation of Caco-2 cells with either GH or CT resulted in further amplification of the NOS 1 band (Figure 4). On the contrary, NOS 2 and NOS 3 protein expressions were undetectable in unstimulated cells and in cells exposed to GH and CT alone or in combination for up to 24 h of incubation (data not shown).
Figure 4 The upper side of the figure shows the cNOS protein expression in Caco-2 cells after 1 h of incubation with GH and CT alone or in combination, as compared to tubulin expression.
The cNOS protein expression is revealed by the appearance of 160-kD band that corresponds to human NOS 1 (neuronal NOS). Shown is a representation of 3 separate experiments. In the lower side of the figure an optical densitometry analysis of the bands is also reported.
Nitrite/nitrate (NO2-/NO3-) production
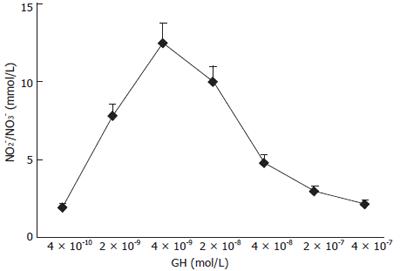
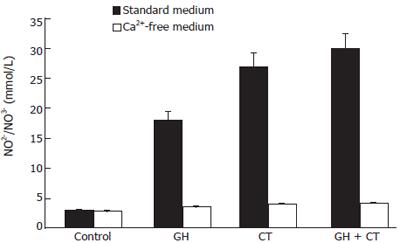
NO production by Caco-2 cells was determined in culture medium after 1 h of incubation with increasing GH doses. As shown in Figure 5 a dose-dependent increase in NO production was detected in response to the hormone. GH doses higher than 4 × 10⁻⁹mol/L did not induce further increase in NO production, indicating a saturation pattern of the effect. Caco-2 cell stimulation with simultaneous exposure to GH and CT resulted in a further increase in NO production compared to each individual substance. The effect was Ca2+-dependent, since in the absence of Ca2+, the NO increase in response to GH addition was abolished. This data suggests an involvement of the constitutive rather than the inducible NOS isoform in the GH effect
Figure 5 Effects of increasing concentration of GH on NO production in Caco-2 cells.
Increasing concentrations of GH were added to Caco-2 cell monolayers and NO production was determined after 1 h of incubation. Data are mean ± SD of 6 different observations.
(Figure 6).
Figure 6 Total NO production in Caco-2 cells under basal conditions and after stimulation with GH and CT, alone or in combination, in standard or in Ca2+-free medium.
Data are mean ± SD of 6 different observations. aP < 0.05 vs control.
DISCUSSION
We have previously shown that GH is able to increase intestinal fluid absorption under basal conditions and to inhibit ion secretion elicited by the 3 main intracellular second messengers of bacterial enterotoxins: cAMP, cGMP and Ca2+[2,4]. The data from this study provides new evidence on the ability of GH to regulate water and ion transport and implicates cNOS-NO activity for this effect. A complete abrogation of GH effects on Isc was seen in the presence of the specific NOS inhibitor L-NAME. An increase of cNOS activity and a subsequent Ca2+-dependent production of NO were observed in enterocytes treated with GH. These effects were associated with a Cl--dependent decrease in Isc, consistent with an anion absorptive effect. We have recently demonstrated that the CT-enterocyte interaction results in an enhanced NO production. Such an effect may be interpreted as a homeostatic mechanism operated by the enterocyte and functioning as a breaking force to limit ion secretion[3]. cNOS-NO system is activated by a yet unknown sensing mechanism and reacts to balance the stimulated secretion. The data in this work support and extend this hypothesis and suggest that the modulation of the cNOS-NO activity could also be dependent on extracellular stimuli control, namely on the GH signal transduction. In all instances, the target of cNOS-NO is cAMP. Our results are similar to those obtained using NO donors, which are able to inhibit forskolin-stimulated cAMP production by adenyl cyclase (AC) isoforms AC5 and AC6, in both T84 epithelial cells and mucosal scrapings from mouse colon[19-21], and are in agreement with those previously obtained in isolated cholangiocytes[22].
It has been recently suggested that GH inhibitory effect on intestinal ion secretion is related to the transactivation of epidermal growth factor (EGF) receptor and the subsequent activation of extracellular signal-regulated kinase (ERK, also known as p 44/42 mitogen activated protein kinase or MAPK) activity[23]. Interestingly, a NO stimulation through ERK-dependent upregulation of cNOS gene transcription has been recently demonstrated for proinsulin C-peptide in endothelial cells[24], and similar effects have been shown with the endothelium-derived hyperpolarizing factor (EDHF)[25]. Thus, it is possible to also hypothesize that the NO-mediated GH effects at the intestinal level could involve a MAPK activation. It also remains to be clarified whether GH effects are mediated by Ca2+. Overall the cNOS-NO system could be viewed as a regulator of ion transport acting on the enterocyte via three distinct patterns: (1) to keep cAMP production at a low level under basal conditions, in order to maintain an intestinal ion pro-absorptive tone; (2) during stimulation of ion secretion, such as that trigged by CT, to reduce ion secretion; (3) in response to extracellular pro-absorptive stimuli, namely acting as second messenger of the GH-induced ion absorption. In all these 3 instances the target of cNOS-NO is cAMP, the effect is Ca2+-dependent and involves Cl- transcellular flux. Thus the cNOS-NO-cAMP pathway plays a key role on the enterocyte fluid absorptive/secretory processes.


