Published online Jul 7, 2006. doi: 10.3748/wjg.v12.i25.4020
Revised: December 15, 2006
Accepted: December 26, 2006
Published online: July 7, 2006
AIM: To validate the statistic utility of both the Maddrey Discriminant Function score and the Model for End-Stage Liver Disease as predictors of short term (30 d and 90 d) mortality in patients with alcoholic hepatitis and to assess prognostic factors among clinical characteristics and laboratory variables of patients with alcoholic hepatitis.
METHODS: Thirty-four patients with the diagnosis of alcoholic hepatitis admitted to Hippokration University Hospital of Athens from 2000 to 2005 were assessed in the current retrospective study and a statistical analysis was conducted.
RESULTS: 30- and 90-d mortality rates were reported at 5.9% (2/34) and 14.7% (5/34), respectively. Significant correlation was demonstrated for the Model for End-Stage Liver Disease (P30 = 0.094, P90 = 0.046) and the Maddrey Discriminant Function score (P30 = 0.033, P90 = 0.038) with 30- and 90-d mortality whereas a significant association was also established for alanine aminotransferase (P = 0.057), fibrin degradation products (P = 0.048) and C-reactive protein (P = 0.067) with 90-d mortality. For 30-d mortality the Area Under the Curve was 0.969 (95%CI: 0.902-1.036, P = 0.028) for the Model for End-Stage Liver Disease score and 0.984 (95%CI: 0.942-1.027, P = 0.023) for the Maddrey Discriminant Function score with the optimal cut off point of 30.5 (sensitivity 1, specificity 0.937) and 108.68 (sensitivity 1, specificity 0.969), respectively. Accordingly, for 90-d mortality the Area Under the Curve was 0.762 (95%CI: 0.559-0.965, P = 0.065) for the Model for End-Stage Liver Disease score and 0.752 (95%CI: 0.465-1.038, P = 0.076) for the Maddrey Discriminant Function score with the optimal cut off point of 19 (sensitivity 0.6, specificity 0.6) and 92 (sensitivity 0.6, specificity 0.946), respectively. The observed Kaplan Meier survival rates for different score-categories were compared with log-rank tests and higher score values were correlated with a lower survival.
CONCLUSION: Equivalency of the Model for End-Stage Liver Disease and the Maddrey Discriminant Function score is implied by the current study, verified by the plotted Receiver Operative Curves and the estimated survival rates. A statistically significant utility of C-reactive protein, fibrin degradation products and alanine aminotransferase as independent predictors of 90-d mortality has also been verified.
- Citation: Soultati AS, Dourakis SP, Alexopoulou A, Deutsch M, Vasilieva L, Archimandritis AJ. Predicting utility of a model for end stage liver disease in alcoholic liver disease. World J Gastroenterol 2006; 12(25): 4020-4025
- URL: https://www.wjgnet.com/1007-9327/full/v12/i25/4020.htm
- DOI: https://dx.doi.org/10.3748/wjg.v12.i25.4020
Alcoholic hepatitis (AH) is an acute or acute-on-chronic inflammatory hepatic syndrome manifesting as a result of severe alcohol consumption and correlating with increased mortality rates[1]. Assessing the severity of the disease is essential for the stratification of patients in need of aggressive therapeutic intervention including corticosteroids and pentoxifylline. A disease severity index for such a purpose should not only have statistical and clinical validity but should preferably rely on a few, readily available, objective parameters and be generalizable to a heterogeneous group of patients[2].
In 1964 Child and Turcotte introduced the first classification index modified to assess prognosis in patients with severe liver disease. In 1972 Pugh improved that first classification in line with the criticisms of Conn[3]. The CTP classification is based on serum albumin, serum bilirubin, prothrombin time, ascites and encephalopathy. Although its statistical accuracy has not been methodically evaluated, CTP classification is used as a disease severity index to determine priority in organ allocation.
The Maddrey Discriminant Function (DF = 4.6*[PTsec-control PTsec] + serum total bilirubinmg/dL) was introduced in 1978 as a predictor of significant mortality risk in patients with AH and need for aggressive therapeutic intervention. A DF score of greater than 32 identified those patients who had greater than 50% mortality in 30 d outcome[4,5].
The Model For End-Stage Liver Disease (MELDscore = 3.8*loge[total bilirubin, mg/dL] + 11.2*loge[INR] + 9.6*loge[creatinine, mg/dL]) was derived from a heterogeneous group of patients from 4 medical centres in the United States and validated in an independent data set from the Netherlands to assess short term survival in cirrhotic patients undergoing elective Transjugular Intrahepatic Portosystemic Shunt (TIPS)[6]. In the MELD score variables are expressed as logarithm values to avoid extreme values, creatinine is co-evaluated and PT is expressed as an INR which does not depend on the sensitivity of the thromboplastin used by the laboratory.
The aim of the current study is to validate the statistic utility of both DF and MELD scores as predictors of short term (30-d and 90-d) mortality in patients with AH and to assess prognostic factors from among clinical characteristics and laboratory variables of patients with alcoholic hepatitis.
Thirty four patients with the diagnosis of AH admitted to Hippokration University Hospital of Athens between January 1, 2000 and April 30, 2005 were assessed in the current retrospective study. The patients were diagnosed with AH based on the following clinical characteristics: (1) total bilirubin > 1.5 mg/dL, (2) aspartate/alanine aminotransferase ratio above 1.5 with an aspartate aminotransferase level above 45 U/L, (3) alcohol consumption within 2 mo exceeding 40 g/d for male and 20 g/d for female patients and finally (4) absence of a coexistent primary cause of liver disease[7]. Patients with preexisting viral hepatitis were not excluded from the study on the basis that regeneration of the viral infection could not be established nor an acute viral hepatitis verified as the cause of hospital admission. Survival at 30 and 90 d following hospital admission was verified by chart review or telephone follow-up.
Only laboratory values obtained within 24 h of admission were utilized for calculation purposes. In those patients presenting several hospital admissions only the initial episode was included. The probability of 90-d mortality was calibrated to P = e(-4.3+0.16*MELD)/[1+e(-4.3+0.16*MELD)][7]. The epidemiological data included age, gender, history of alcohol consumption and days of abstinence. Several clinical characteristics and laboratory values were evaluated as independent prognostic variables including fever, corticosteroids or diuretic treatment, infection, hemoglobulin, mean corpuscular volume, platelets’ count, white blood cell count, spurrcells, aminotransferases, alkaline phosphatase, gamma-glutamyl transpeptidase, bilirubin, creatinine, C-reactive protein, erythrocyte sedimentation rate, α-fetoprotein, prothrombin time, international normalized ratio, fibrinogen, d-dimers, fibrin degradation products, albumin, ammonia. Clinical features of decompensated hepatic disease including ascites, encephalopathy and edema and also the presence of jaundice were reviewed from the admission history charts. Diagnosis of ascites was based on ultrasound findings and diagnosis of a coexisting infection was established by a positive culture. Hepatic encephalopathy was verified after exclusion of space occupying intracranial lesions, concurrent metabolic, endocrine, traumatic or epileptiform disorders and alcoholic or drug intoxication. Regarding diuretics only those patients receiving diuretics before their hospital admission were evaluated as positive. Non sufficient data was demonstrated regarding the patients’ history of alcohol consumption or alcohol abstinence resulting in a request for more detailed documentation of such information in the future.
We searched the database PubMed (1995-2005) using the following key-words: “alcoholic hepatitis”, “MELD score”, “DF score”, “prognosis in alcoholic hepatitis”. We also included review articles, book chapters, or commonly referenced older publications. We reviewed the refe-rence lists of articles identified by the search strategy and selected those we judged relevant. The search was restricted to papers published in English.
Data were analysed using SPSS 11.0 for Windows. Descriptive statistics including mean, median, ranges and standard. Deviation values were calculated for all the continuous baseline demographic, clinical and laboratory characteristics. Univariate logistic regression (backward elimination) was used to screen the variables for statistically significant association with respect to 30- and 90-d mortality. Variables that were statistically significant formed a pool of potential independent predictors. Multivariable logistic regression (backward elimination variables selection procedure) was performed for those variables. The significant factors were kept in the model if the maximum likelihood ratio criterion had a P-value below 0.10. Prognostic utility of the different scores was determined by generating a receiver operating characteristic curve (ROC curve). Concordance (range 0.0-1) is equivalent to the area under the curve (AUC) and quantifies the prognostic validities of the variables. Excellent diagnostic accuracy is indicated by AUC between 0.8-0.9 and a c-statistic greater than 0.7 is generally considered a useful test. From the ROC curve coordinates, cut-off points with best sensitivity and specificity of the different scores were determined and predictive values, likelihood and odds ratios were calculated. Overall survival was estimated from the admission data of the patient to the hospital to the date of last follow up or until the patient’s death. Kaplan Meier method was used to calculate median follow up and survival curves while the log rank test was used to compare time to events distributions with respect to MELD and DF categories. The death incidences in correlation with MELD and DF values were displayed on scatter plot diagrams.
Thirty four patients with a median age of 49 (± 7.74, 9 female and 25 male patients) who met the inclusion criteria were enrolled in the patients cohort. Patients were assessed for a median follow up period of 13 mo (Accrual: February 2000-April 2005; range, 0.6-61.8+; 95%CI: 2.5-23.4). Demographical, clinical and laboratory data were reviewed and mean, median values and ranges are presented (Table 1). Median admission MELD and DF values were 19 (range, 3-46) and 42.25 (range, 15.3-180.72), respectively. 30-d mortality was reported at approximately 5.9% (2/34) whereas 90-d mortality was calculated at 14.7% (5/34). Clinical features of decompensated hepatic disease including ascites, encephalopathy and edema were reported in 64.7%, 32.4% and 52.9% of the patients, respectively. Jaundice was documented in 94.1% of the patients whereas infection was verified in 20.6% of the patients. The presence of serum IgG antibodies indicating an underlying hepatitis A or hepatitis B viral infection was reported in 11.8% (4/24) and 14.7% (5/24) of the patients respectively whereas there was no laboratory confirmation of active viral hepatic infection.
| N1 | Range | Mean | Median | Std. deviation | |
| Age | 33 | 36.00-62.00 | 48.3939 | 49 | 7.7498 |
| Yrs of drink | 23 | 3.00-45.00 | 17.0000 | 15 | 10.3177 |
| Alc g/d | 22 | 50.00-360.00 | 157.7273 | 150 | 84.3565 |
| DF | 34 | 15.30-180.72 | 55.5650 | 42.25 | 38.0920 |
| MELD | 34 | 3.00-46.00 | 20.9118 | 19 | 8.5293 |
| Hb | 34 | 5.30-14.80 | 10.7088 | 10.85 | 2.3296 |
| MCV | 33 | 69.10-121.20 | 100.8606 | 102.3 | 11.6788 |
| WBC | 34 | 3000-27000 | 11300.0000 | 9340 | 6039.8068 |
| PLT | 34 | 31000-446000 | 171970.5882 | 150000 | 103840.6370 |
| PT | 34 | 13.10-40.00 | 20.0044 | 18.25 | 6.1619 |
| INR | 34 | 1.10-3.88 | 1.7415 | 1.6 | 0.5922 |
| FIBR/GEN | 30 | 50.00-1350.00 | 312.6700 | 289 | 237.3435 |
| ALBUMIN | 32 | 1.50-4.00 | 3.0500 | 3.05 | 0.4819 |
| SGOT | 34 | 33.00-970.00 | 164.4412 | 127.5 | 165.1286 |
| SGPT | 34 | 19.00-787.00 | 84.9706 | 46.5 | 132.8972 |
| γGT | 32 | 23.00-1967.00 | 534.7813 | 353.5 | 532.8706 |
| ALP | 32 | 65.00-561.00 | 196.4375 | 152.5 | 129.0354 |
| TOTAL BIL | 34 | 1.50-51.00 | 17.7841 | 14.73 | 13.5573 |
| CREAT. | 34 | 0.20-2.80 | 1.0353 | 0.95 | 0.5098 |
| NH3 | 25 | 4.84-235.00 | 127.3936 | 1.5 | 60.5252 |
| ESR | 28 | 6.00-141.00 | 69.0357 | 72.5 | 41.7253 |
| CRP | 25 | 1.40-126.00 | 45.8164 | 38 | 40.0220 |
The variables that were significantly associated with 30- and 90-d mortality in univariate logistic regression analysis are presented (Table 2). Significant correlation was demonstrated for MELD (P30 = 0.094, P90 = 0.046) and DF scores (P30 = 0.033, P90 = 0.038) with 30- and 90-d mortality whereas a significant association was also established for alanine aminotransferase, SGPT (P = 0.057), fibrin degradation products, FS (P = 0.048) and C-reactive protein, CRP (P = 0.067) with 90-d mortality. Notable variables that were not independently correlated with mortality in univariable logistic regression analysis included encephalopathy, ascites, jaundice and albumin. A statistically significant association couldn’t be verified for components that comprise the MELD and DF scores (creatinine, total bilirubin and INR). Variables that exhibited a significant correlation in univariate evaluation were thereafter entered in a multivariate logistic regression process. No additional variables increased the predictive accuracy of either MELD or DF score. In fact all the variables lost significance when they were co-evaluated in a backward variable selection procedure.
| Univariate logistic regression | Variable | P value | Odds ratio | 95.0%CI | |
| 30-d mortality | DF | 0.033 | 1.051 | 1.004-1.101 | |
| MELD | 0.094 | 1.357 | 0.950-1.939 | ||
| 90-d mortality | DF | 0.038 | 1.026 | 1.001-1.050 | |
| MELD | 0.046 | 1.132 | 1.002-1.278 | ||
| FS | 0.048 | 0.059 | 0.004-0.979 | ||
| SGPT | 0.057 | 7.199 | 0.944-54.931 | ||
| CRP (< 100) | 0.910 | 0.001 | 0.000-53.00 | ||
| CRP (> 100) | 0.067 | 14.000 | 0.83-235.080 | ||
| Multivariate logistic regression | |||||
| 30-d mortality1 | Step 1 | DF | 0.484 | 1.034 | 0.942-1.134 |
| MELD | 0.707 | 1.120 | 0.621-2.021 | ||
| Step 2 | DF | 0.033 | 1.051 | 1.004-1.101 | |
| 90-d mortality2 | Step 5 | DF | 0.994 | 12.488 | 0.00-1.91+297 |
| MELD | 0.997 | 0.129 | 0.000 | ||
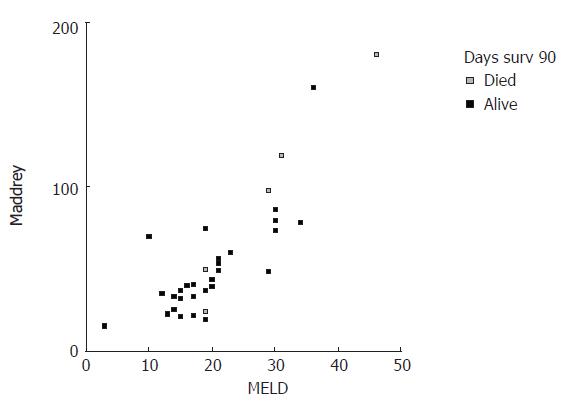
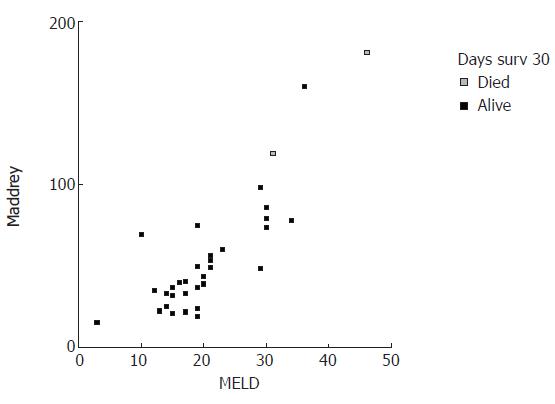
MELD and DF scores were plotted in correlation with 30- and 90-d mortality (Figures 1 and 2). Visual inspection of these plots demonstrates that higher MELD and DF values are correlated with an increased death incidence.
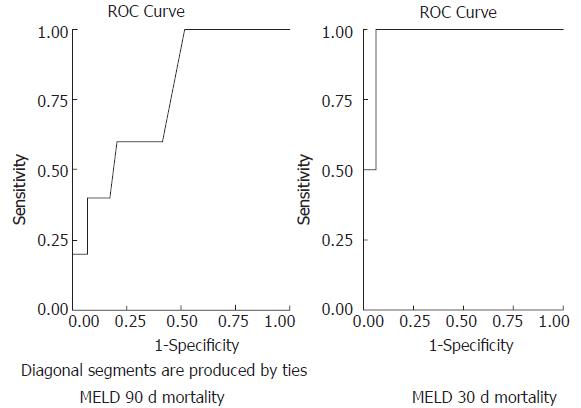
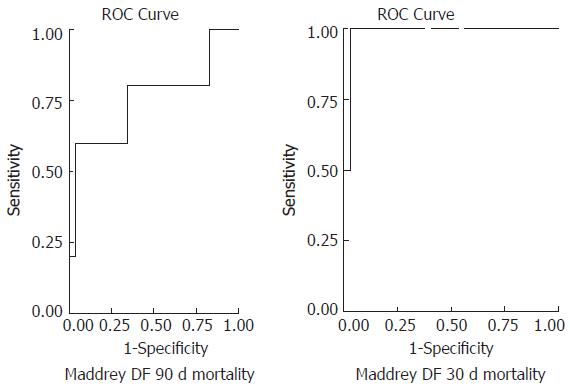
Receiver operating characteristics curves were generated in order to validate the predictive accuracy of different scores in assessing 30- and 90-d mortality (Figures 3 and 4). For 30-d mortality the AUC was 0.969 (95%CI: 0.902-1.036, P = 0.028) for the MELD score and 0.984 (95%CI: 0.942-1.027, P = 0.023) for the DF with the optimal cut off points of 30.5 (sensitivity 1, specificity 0.937) and 108.68 (sensitivity 1, specificity 0.969), respectively. Accordingly for 90-d mortality the AUC was 0.762 (95%CI: 0.559-0.965, P = 0.065) for the MELD score and 0.752 (95%CI: 0.465-1.038, P = 0.076) for the DF score with the optimal cut off points of 19 (sensitivity 0.6, specificity 0.6) and 92 (sensitivity 0.6, specificity 0.946), respectively.
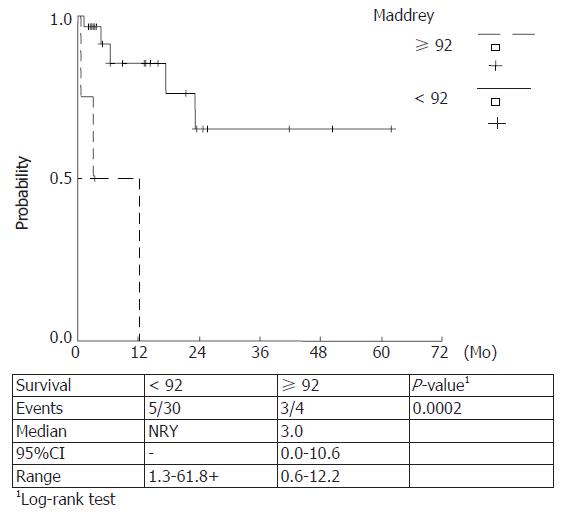
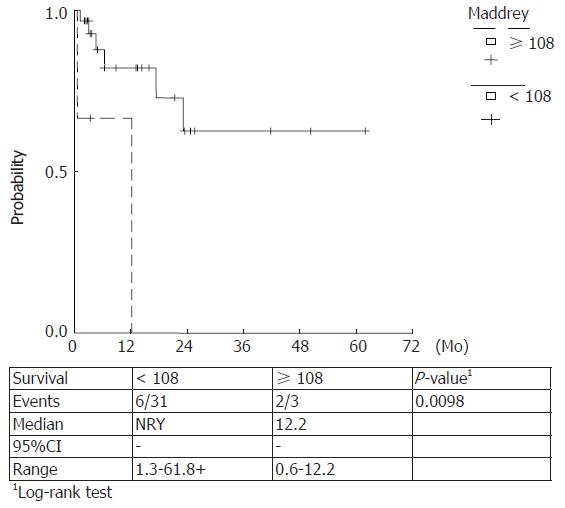
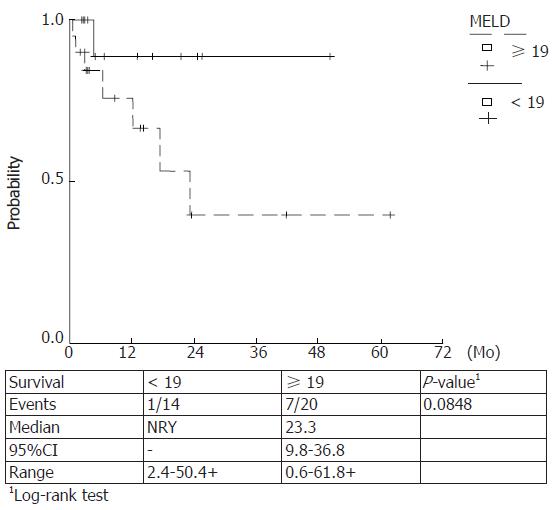
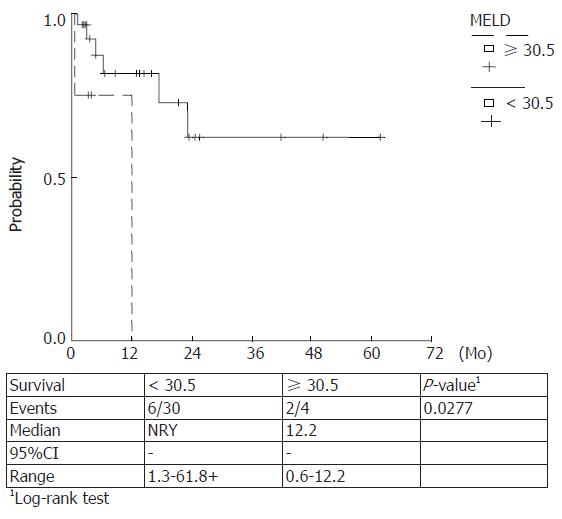
Kaplan Meier survival rates were estimated for Maddrey score values < 108, ≥ 108 (P = 0.0098) and ≥ 92, < 92 (P = 0.0002) and MELD scores ≥ 30.5, < 30.5 (P = 0.027) and ≥ 19, < 19 (P = 0.084). The observed survival rates for different score-categories were compared with log-rank tests and higher score values were correlated with a lower survival. (Figures 5-8)
Prognostic equivalency of MELD and DF scores is implied by the current study, verified by the plotted ROC curves and the cumulative survival curves. A statistically significant utility of CRP, FS and SGPT as independent predictors of 90-d mortality has also been verified.
Alcoholic liver disease (ALD) encompasses a clinicohistological spectrum of abnormalities ranging from fatty liver, to AH and irreversible liver cirrhosis (Laennec’s cirrhosis). The potentially fatal clinicopathological syndrome of AH develops in a minority of patients[9,10].
The major focus of management in AH is abstinence from alcohol, supportive care, treatment of clinical features of decompensated hepatic disease and maintenance of positive nitrogen balance through nutritional support. Although controversy is documented regarding therapeutic issues it is generally agreed that patients with mild disease need not be treated beyond general supportive and symptomatic care and patients with severe disease in extremis may be too ill to correspond in any form of therapy. Identification of those patients who might benefit from aggressive intervention, including corticosteroids or controversial treatment approaches (antioxidant therapy, stimulation of liver regeneration, supplemental amino-acids, inhibition of tumour necrosis factor α and stimulation of collagen degradation[1]) as well as patients in whom the therapeutic benefit/risk ratio is unfavourable, is currently an issue of great clinical interest.
On that ground the utility of prognostic models in predicting the short-term mortality in AH has been recently assessed by three series in the literature. In 2002 Sheth et al verified the fact that the MELD score performs as well as the DF score in predicting 30-d mortality in AH. A MELD score of greater than 11 or the presence of both ascites and an elevated bilirubin greater than 8 mg/dL should prompt consideration of aggressive therapeutic interventions such as corticosteroids or pentoxifylline according to the authors[11]. Three years later a retro prospective cohort study assessing 73 patients was conducted by Dunn et al[7], which identified a MELD score of 21 as having the highest sensitivity and specificity for predicting mortality with an estimated 90-d mortality of 20% for patients with this score also manifesting in ascites and encephalopathy. Recommendations were made for such patients to receive aggressive therapeutic agents. According to the authors MELD score maintained some practical and statistical advantages over DF in predicting mortality rates in these patients. Finally in the latest clinical trial conducted in a large cohort of 202 patients with AH, admission, first week and first week change in the MELD score were justified as independent predictors for in-hospital mortality. Also the MELD score outranged the DF and CTP scores when considering prognostic accuracy and cut off points of ≥ 18 for admission MELD score, ≥ 20 for the first week MELD score and ≥ 2 for the first week change in MELD score which were significantly correlated with mortality[8].
In our study a prognostic equivalency of MELD and DF scores was verified whereas the predictive utility of ascites or encephalopathy could not be established. On the other hand, a statistically significant utility of CRP, FS and SGPT as independent predictors of 90-d mortality has been demonstrated. No additional variables significantly changed the prognostic utility of the MELD or DF scores when they were entered in a multivariable analysis. The cut off points were 19 and 30.5 for MELD score and 92 and 108.68 for DF score for 90- and 30- d mortality, respectively.
Despite statistical analysis some practical points favouring the use of the MELD score in this setting should be considered. When compared with the Child-Pugh score the MELD score surpasses in the setting in that: (1) it uses objective parameters which are not subject to center-to-center variability, (2) it increases as the three constituent parameters deteriorate, whereas the individual scoring elements in the Child score remain fixed once a defined threshold has been reached[12]. Presumably CTP classification is an instrument of its time and implementation of the newest therapeutic strategies will require a more refined scale that accurately represents disease severity. Disadvantages were also demonstrated regarding the utility of the DF classification for AH including: the use of PT, a variable that is poorly standardized across different laboratories, an established risk of death of up to 17% in patients with a DF score greater than 32[13,14], and the fact that initial validation of DF correlation to mortality rates is based on series from several decades ago[7].
In summary, physicians should keep in mind that ALD when complicated by AH should be considered with skepticism and aggressive therapeutic options should be regarded. On that basis prognostic scores should be assessed with a MELD score dominating and presenting sufficient prognostic accuracy.
S- Editor Wang J L- Editor Alpini G E- Editor Bi L
| 1. | Menon KV, Gores GJ, Shah VH. Pathogenesis, diagnosis, and treatment of alcoholic liver disease. Mayo Clin Proc. 2001;76:1021-1029. [RCA] [PubMed] [DOI] [Full Text] [Cited by in Crossref: 98] [Cited by in RCA: 83] [Article Influence: 3.3] [Reference Citation Analysis (1)] |
| 2. | Altman DG, Royston P. What do we mean by validating a prognostic model. Stat Med. 2000;19:453-473. [RCA] [PubMed] [DOI] [Full Text] [Cited by in RCA: 16] [Reference Citation Analysis (0)] |
| 3. | Pugh RN, Murray-Lyon IM, Dawson JL, Pietroni MC, Williams R. Transection of the oesophagus for bleeding oesophageal varices. Br J Surg. 1973;60:646-649. [RCA] [PubMed] [DOI] [Full Text] [Cited by in Crossref: 5490] [Cited by in RCA: 5811] [Article Influence: 109.6] [Reference Citation Analysis (2)] |
| 4. | McCullough AJ, O'Connor JF. Alcoholic liver disease: proposed recommendations for the American College of Gastroenterology. Am J Gastroenterol. 1998;93:2022-2036. [RCA] [PubMed] [DOI] [Full Text] [Cited by in Crossref: 174] [Cited by in RCA: 158] [Article Influence: 5.6] [Reference Citation Analysis (0)] |
| 5. | Maddrey WC, Boitnott JK, Bedine MS, Weber FL Jr, Mezey E, White RI Jr. Corticosteroid therapy of alcoholic hepatitis. Gastroenterology. 1978;75:193-199. [PubMed] |
| 6. | Malinchoc M, Kamath PS, Gordon FD, Peine CJ, Rank J, ter Borg PC. A model to predict poor survival in patients undergoing transjugular intrahepatic portosystemic shunts. Hepatology. 2000;31:864-871. [RCA] [PubMed] [DOI] [Full Text] [Cited by in Crossref: 1967] [Cited by in RCA: 2100] [Article Influence: 80.8] [Reference Citation Analysis (0)] |
| 7. | Dunn W, Jamil LH, Brown LS, Wiesner RH, Kim WR, Menon KV, Malinchoc M, Kamath PS, Shah V. MELD accurately predicts mortality in patients with alcoholic hepatitis. Hepatology. 2005;41:353-358. [RCA] [PubMed] [DOI] [Full Text] [Cited by in Crossref: 357] [Cited by in RCA: 380] [Article Influence: 18.1] [Reference Citation Analysis (0)] |
| 8. | Srikureja W, Kyulo NL, Runyon BA, Hu KQ. MELD score is a better prognostic model than Child-Turcotte-Pugh score or Discriminant Function score in patients with alcoholic hepatitis. J Hepatol. 2005;42:700-706. [RCA] [PubMed] [DOI] [Full Text] [Cited by in Crossref: 181] [Cited by in RCA: 165] [Article Influence: 7.9] [Reference Citation Analysis (0)] |
| 9. | Propst A, Propst T, Zangerl G, Ofner D, Judmaier G, Vogel W. Prognosis and life expectancy in chronic liver disease. Dig Dis Sci. 1995;40:1805-1815. [RCA] [PubMed] [DOI] [Full Text] [Cited by in Crossref: 82] [Cited by in RCA: 66] [Article Influence: 2.1] [Reference Citation Analysis (0)] |
| 10. | Chedid A, Mendenhall CL, Gartside P, French SW, Chen T, Rabin L. Prognostic factors in alcoholic liver disease. VA Cooperative Study Group. Am J Gastroenterol. 1991;86:210-216. [PubMed] |
| 11. | Sheth M, Riggs M, Patel T. Utility of the Mayo End-Stage Liver Disease (MELD) score in assessing prognosis of patients with alcoholic hepatitis. BMC Gastroenterol. 2002;2:2. [RCA] [PubMed] [DOI] [Full Text] [Full Text (PDF)] [Cited by in Crossref: 123] [Cited by in RCA: 120] [Article Influence: 5.0] [Reference Citation Analysis (0)] |
| 12. | Forman LM, Lucey MR. Predicting the prognosis of chronic liver disease: an evolution from child to MELD. Mayo End-stage Liver Disease. Hepatology. 2001;33:473-475. [RCA] [PubMed] [DOI] [Full Text] [Cited by in Crossref: 140] [Cited by in RCA: 148] [Article Influence: 5.9] [Reference Citation Analysis (0)] |
| 13. | Kulkarni K, Tran T, Medrano M, Yoffe B, Goodgame R. The role of the discriminant factor in the assessment and treatment of alcoholic hepatitis. J Clin Gastroenterol. 2004;38:453-459. [RCA] [PubMed] [DOI] [Full Text] [Cited by in Crossref: 32] [Cited by in RCA: 35] [Article Influence: 1.6] [Reference Citation Analysis (0)] |
| 14. | Mathurin P, Mendenhall CL, Carithers RL Jr, Ramond MJ, Maddrey WC, Garstide P, Rueff B, Naveau S, Chaput JC, Poynard T. Corticosteroids improve short-term survival in patients with severe alcoholic hepatitis (AH): individual data analysis of the last three randomized placebo controlled double blind trials of corticosteroids in severe AH. J Hepatol. 2002;36:480-487. [RCA] [PubMed] [DOI] [Full Text] [Cited by in Crossref: 252] [Cited by in RCA: 230] [Article Influence: 9.6] [Reference Citation Analysis (0)] |


