Published online May 14, 2006. doi: 10.3748/wjg.v12.i18.2864
Revised: March 28, 2006
Accepted: April 10, 2006
Published online: May 14, 2006
The motor function of the gastrointestinal tract has primarily been studied using manometry and radiography, though more indirect tests have also been applied. Manometry and radiography do not provide detailed information about the muscle properties as can be assessed from studies of muscle properties in muscle strips in vitro. In recent years a technique based on impedance planimetric measurement of pressure-cross-sectional area relations in a distending bag has proven to provide more detailed information about the muscle function in vivo. This review shows examples of new muscle function analysis such as length-tension diagrams, force-velocity curves and preload-afterload diagrams.
- Citation: Gregersen H, Liao D. New perspectives of studying gastrointestinal muscle function. World J Gastroenterol 2006; 12(18): 2864-2869
- URL: https://www.wjgnet.com/1007-9327/full/v12/i18/2864.htm
- DOI: https://dx.doi.org/10.3748/wjg.v12.i18.2864
The gastrointestinal (GI) tract is a continuous channel through the body with oral and anal orifices for intake and output. It consists of a series of organs with the biliary tract as a major side-branch. These organs resemble one another in constitution, the elements being variously arranged in such a way as to produce cylinders, spheroids, or intermediate forms[1]. The wall of the GI tract is a laminated composite structure. The general structure is an outer muscle coat consisting of a longitudinal muscle layer and a circular muscle layer. The collagen-rich submucosa layer and a mucosa layers are found inside the outer muscle coat. A third layer of muscle, the muscularis mucosae, exists throughout almost the entire tract. A network of nerves, the myenteric plexus, is embedded in the loose collagen matrix of the intermuscular plane. This set of nerves is essential in the regulation of the contractions of the adjacent musculature, the two layers of the muscularis propria. The motions of the GI tract must, at all times, keep the contents of the tract in their intended place, i.e. to bring them to the site of absorption. This means not only that they accomplish net antegrade flow but also that they mix the contents and move it across the surface where absorption occurs. The contractile patterns and transit varies greatly from one part of the tract to another. The muscle layers provide the forces that distort the cylindrical conduit in the form of contractions. The connective tissue layers provide a framework, or stroma, that determines the passive physical properties of the gut wall.
As stated above, the gross mechanical function of the GI tract depends on the coordinated muscle function and neuromuscular circuits. In bioengineering terms the mechanical properties of the GI tract has mainly been studied in vitro under standardized isometric and isotonic conditions and length-tension and force-velocity characteristics have been described[2]. The muscle function is altered in a number of organic and functional GI diseases, as well as it can be modified by drugs. Despite the importance of the muscle function, only few methods exist to evaluate the mechanics of GI muscle function in vivo. Manometry has become a standard method for clinical motility testing but it merely provides a proxy of the force developed by the muscles and is in many diseases poorly related to the organ dysfunction and symptoms[3].
Heart muscle function has attracted more attention that GI muscle function in the past and pressure-volume loops and ventricular function curves can be generated from measurements obtained in vivo[4,5]. Inspired by the cardiovascular research similar “muscle function” curves can now be obtained in the GI tract from impedance planimetric studies and such analyses provide new insight into the behavior and function of the GI tract. The review provides the background for advanced muscle analysis in vivo and takes the readers through some examples.
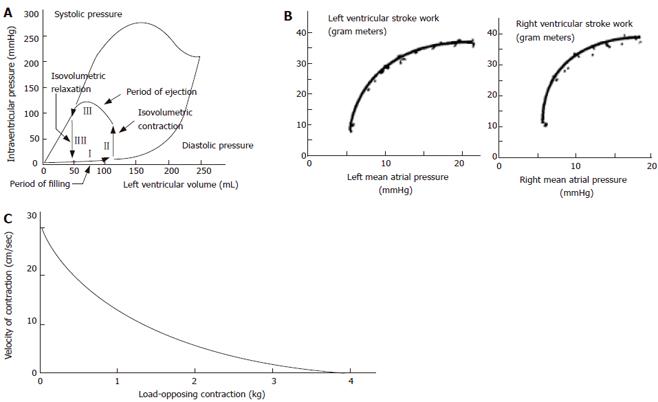
The cardiac cycle and cardiac mechanics-function relationship have been studied in much more detail than contractile properties of GI smooth muscle in vivo. Curves are often derived from pressure-volume data where four phases during the cardiac cycle can be identified (Figure 1A), and from stroke work output as function of atrial pressures (Figure 1B). Such data are clinically useful for explaining the pumping mechanics of the left ventricle. One of the best known relationships concerning muscle action is the hyperbolic force-velocity relation[4,6] (Figure 1C). Although this relationship originally was derived for isolated muscle, it has been confirmed for whole striated muscle movements[7]. The curve implies that velocity of muscle contraction is inversely proportional to the load, that a large force cannot be exerted in very rapid movements, that the greatest velocities are attained under conditions of low loading, and that the intermediate values of force and velocity depend on the maximal isometric force.
Most mechanical studies in vitro on GI smooth muscle is isometric length-tension experiments conducted at resting conditions in small organ baths and during stimulation or inhibition with pharmacological substances[2]. Such studies have given valuable information about the regulation of contractions and passive tissue properties.
Only few methods are established for evaluation of GI motor and biomechanical function in vivo. Luminal pressure recordings are the key measurement technique for determining the contractile pattern in many parts of the GI tract. Manometry has been used for more than 50 years to monitor motility in the gastrointestinal tract. These systems often use reliable perfused hydraulic-capillary systems where pressure at a sensor outside the body can be used to accurately measure pressure at a point along a catheter via a low flow rate perfused channel. This system has been used extensively to measure force via a pressure measurement in lumens and in liquid filled balloons. Other tests may give a more indirect measure of the motor function. These include transit time studies, pH-metry in the esophagus, radiography, etc. The measurement of luminal pressure, however, is not a direct measure of muscle tone and tension. It is a proxy of changes in force generated by the surrounding tissues[8,9].
During recent years, bag distension has become popular as a research tool for GI studies, primarily because mechanical data may be obtained. Furthermore, distension provokes pain and therefore can be used to study the sensory function in patients with functional chest pain[10]. Only few distension studies using inhibitory drugs focused on separating phasic and tonic contractions[11,12]. Recently, tools were developed for studying both the active (phasic and tonic contractions) and passive behavior using impedance planimetric distension before and during administration of inhibitory drugs[9,13,14]. Tension, stress and strain are of principal interest because these parameters give information about the esophageal elastic properties and mechanoreceptors respond more directly to these parameters than to pressure and volume[9]. Furthermore, the muscle function is better evaluated when the forces and tensions can be measured rather than the pressure generated by contractions[1,15]. The most used bag distension technique is the barostat but other techniques such as impedance planimetry and distensions combined with imaging techniques give more detailed geometric information. Rather than analyzing pressure-volume relationships based on the barostat, impedance planimetry enables data on the CSA of the bag during distension to be gathered. CSA shows a better relationship to the diametrical changes in the alimentary lumen than volume[1].
Impedance planimetry is a technique for performing bag distensions in hollow visceral organs. It has been used to measure CSA together with bag pressure in animal and human studies and the wall tension and strain in the organ can be estimated[1,16]. From Ohm´s law we know that
V= IZ
where V, I and Z denote the potential difference, the current and the electrical impedance. In the case of a fluid filled bag on a probe with an alternating constant current set up between two excitation electrodes (E), Ohms law will apply for the field between two inner sensing electrodes (S). The impedance depends on the distance (D) between the S electrodes, the conductivity (ς) of the liquid in the bag and the CSA of the bag between the S electrodes. Since
Z=D/ ςCSA
the potential difference can be written as
V=DI/ ςCSA
If the conductivity of the solution remains constant (the temperature must be constant), the distance between the S electrodes is fixed, and the current source exciting the E electrodes is kept constant, then
V=α(1/ CSA),
where α is a calibration constant. Thus, the voltage crossing the S electrodes is proportional to the inverse of the CSA. Direct proportionality can be obtained by reciprocation. Data are conditioned and stored on a PC for further analysis.
The new analysis consist of in vivo (1) phasic and tonic length-tension diagrams; (2) preload-afterload analysis (3) pressure-CSA and tension-radius plots (4) force-velocity and force-power plots.
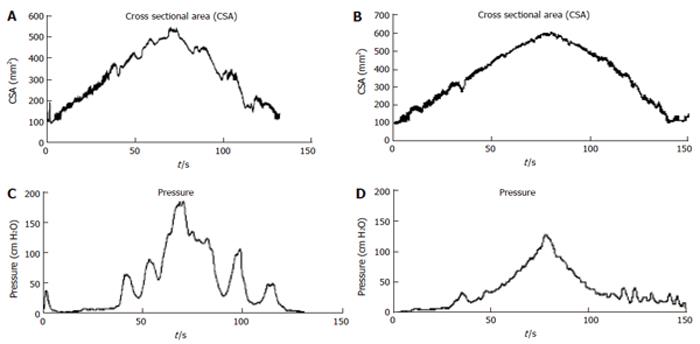
The studies have been done using different step or volume-controlled ramp protocols. An example of CSA and pressure recordings is shown in Figure 2 where a volume-controlled ramp distension was done using an infusion rate of 25 mL/min. The data provide information on the contractile pattern and can be used for computation of elasticity.
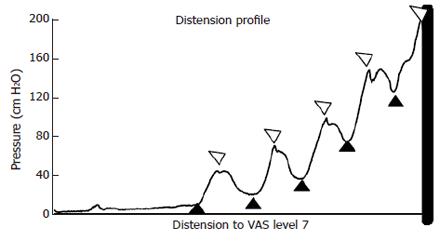
Length-tension diagrams can be obtained in vivo in the GI tract using impedance planimetry. Passive curves obtained during administration of butylscopolamine and active curves in terms of both phasic and tonic curves can be generated by analyzing data in accordance with the tracings in Figure 3. For simplicity in the first approach, the circumferential wall tension (T) is calculated according to the law of Laplace for cylindrical structures.
T = ΔPr
where T is the circumferential wall tension and r is the bag radius and ΔP is the transmural pressure. The radius is calculated assuming a cylindrical shape of the bag during distension and by knowing the CSA. The circumferential stretch ratio can be computed as the fractional change in radius (r/ro) where r is the radius at any distension state and r0 is the reference radius.
The distentions induce contractile activity. For each contraction, tonic tension (tension computed from pressure and CSA between phasic contractions) and phasic tension (tension during maximum contraction) can be identified from the tension-time curve. Since both active and passive tissue properties contribute to the total tension developed in the small intestine during distension, both the tonic and the phasic tensions must be separated into active and passive components. The passive tension can be derived from the distensions during butylscopolamine infusion and the total tension. Thus, the active tensions can be computed as:
Ttonic-total = T tonic-active + Tpassive and Tphasic-total =Tphasic-active + Tpassive
where Ttonic-total Ttonic-active, Tphasic-total Tphasic-active and Tpassive are the total tonic tension, the active tonic tension, the total phasic tension, the active phasic tension, and passive tension, respectively.
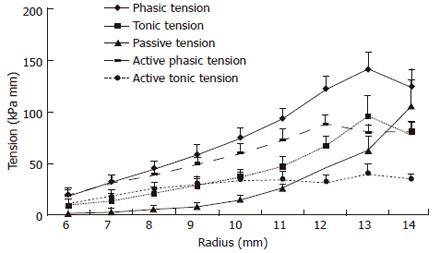
The graph in Figure 4 shows averaged data from the normal human esophagus. The passive tension increased exponentially as function of the radius, whereas the tonic and combined phasic-tonic tension increased until a maximum at a radius of 13 mm. This corresponded with the pain threshold. The active tension decreased at higher radii. The major finding was that both active curves exhibited a maximum tension. The active tensions were most important at low distending loads whereas the passive tension was predominant at higher loads. Thus, the esophagus can contribute its largest active force to transport the bolus within the physiological range. The maximum active tension appears close to the pain threshold and before overstretching the esophageal wall. Thus, the esophagus has its physiological function in the ascending leg of the length-tension curve. Exceeding this level it becomes inefficient, like the heart that also functions at the ascending leg of the curve. The maximum active tension is presumably reached at a level of optimum overlap between the sliding filaments in the intestinal muscle cells. When the esophageal wall was stretched to a degree where pain appeared, the passive tension predominated. The passive curves were exponential-like in accordance with findings in other soft tissues. The exponential behavior protects the tissue against overdistension and damage at high luminal pressure loads, while distending easily and facilitating flow in the physiological pressure range.
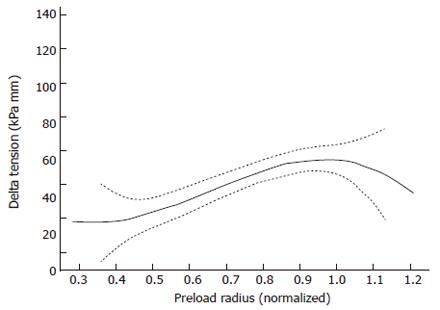
A way to express the Frank-Starling mechanism in the heart is preload-afterload curve (Figure 1B). In Figure 5 this concept was borrowed from cardiac physiology and it is shown that GI muscle behaves in a similar fashion. The change in tension during individual distension-induced contractions (afterload) was analyzed as function of the radius immediately before the contractions (preload radius). In a similar way the change in radius during distension-induced contractions was plotted as function of the preload radius. These diagrams correspond to heart function curves in terms of the ventricular stroke work as function of the mean atrial pressure. Such curves demonstrate the Frank-Starling mechanism of the heart[4,5]. The change in tension during bag-distension-induced contractions increased at normalized radii (radius divided by the radius at the pump reverse point) up to 0.95 (corresponding to radii of 5-12 mm) (Figure 5). This may be called the ascending leg of the curve. At higher radii the change in tension decreased again (the descending leg).
The preload is considered to be the initial muscle length (radius) preceding the contraction during the distension, whereas the afterload is evaluated as the active tension during the contraction. In cardiac physiology the preload is usually considered to be the end-diastolic pressure or radius and the afterload is considered to be the arterial pressure during the systole. The explanation of the Frank-Starling mechanism is that when an extra amount of blood flows into the ventricles, the cardiac muscle itself is stretched to greater length. This causes the muscle to contract with increased force because the actin and myosin filaments are brought to a more nearly optimal degree of interdigitation for force generation. In cardiac physiology the importance of the concept of preload and afterload is that in many abnormal functional states of the heart and circulation, the pressure during filling of the ventricle or the arterial pressure against which the ventricle must contract, or both, are severely altered from the normal. Transferring this concept to GI physiology, the development may have interest for evaluation of normal GI physiology, aging and in the pathophysiology of gastro-esophageal reflux disease, systemic sclerosis, obstruction, achalasia, functional chest pain, spasms and other esophageal disorders.
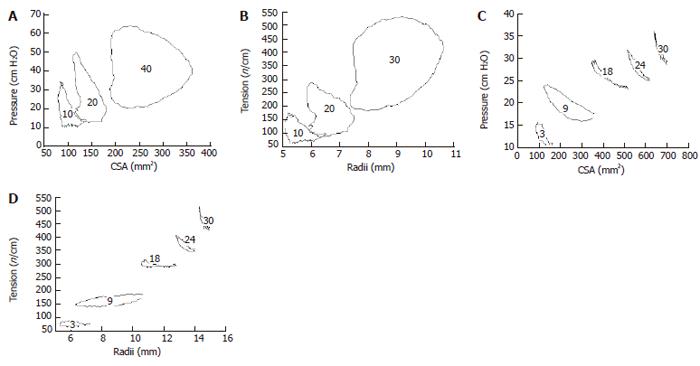
These curves correspond to the well known pressure-volume curves obtained in the heart (as shown in Figure 1A. The data below was generated from analyzing pressure and CSA data during contractile events at various levels of bag distension in the esophagus and duodenum (Figure 6). It is clearly shown that loops consisting of different “phases” can be determined. However, definition of contraction and relaxation phases seems not as clear cut as in the heart. It is evident that duodenum and esophagus muscle behaves in a very different way. Especially the esophagus curves show a large degree of hysteresis. The area enclosed by the tracing is a measure of the work done during the contraction.
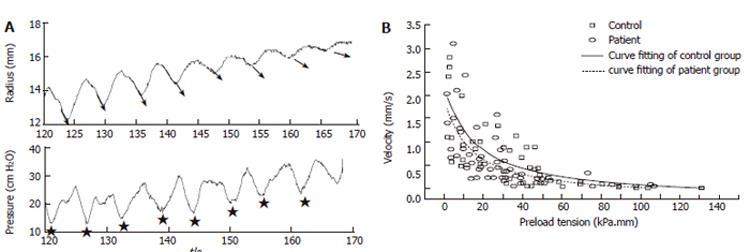
Figure 1C shows a schematic of the well known force-velocity relationship for muscle tissue and Figure 7 shows data obtained in the GI tract. The tension and shortening velocity were quantified from the contraction waves in the tension-time and radius-time curves simultaneously. For each contraction the preload tension was defined as the tension preceding the contraction. The shortening velocity was defined as the radius shortening rate which is the slope of the radius-time curve for each contraction (arrows in Figure 7A). Since it turned out that the tension-shortening velocity relationship was a hyperbola similar to that described for skeletal muscle, Hill’s equation can be used to characterize this relationship[5].
(T + a)(V + b)= (Tmax + a)b
where T represents tension, V the velocity of shortening, Tmax the maximum tension at which the muscle is first unable to move, a and b are constants with dimensions of force and velocity, respectively. Figure 7A shows the bag radius (derived from the CSA) and the pressure during ramp distension of the duodenum. The slope of the contraction curve (arrows representing the contraction velocity) decrease as a function of the degree of distension. Force-velocity curves expressed as circumferential preload tension-radius shortening velocity diagrams are shown in Figure 7B for the duodenum in controls and systemic sclerosis patients. The velocity of shortening decreased with increasing preload tension. Tmax and the muscle power were lowest in the patients and association was found between the duration of the disease and the maximum stretch ratio. Decreased muscle function may explain the GI symptoms reported in this patient group and should be considered as an important factor in the diagnosis and treatment.
In conclusion, current understanding of the “mechanical” physiology of the GI tract is based on measurement techniques such as manometry. The development of new analysis of bag distention data will contribute significantly to the understanding of digestion in health and disease in the future. The impact of the proposed analysis is to better understand the muscle properties and how they relate to mechanism involved in symptom generation in organic and functional diseases in visceral hollow organs. Examples of frequent diseases of great interest are GERD, non-cardiac chest pain and functional dyspepsia. The perspective is that future treatment of GI disorders with affection of neuromuscular pathways can be mechanism- and evidence based with respect to such function curves.
S- Editor Pan BR E- Editor Bi L
| 1. | Gregersen H. Biomechanics of the gastrointestinal tract. London: Springer-Verlag 2002; . |
| 2. | Tøttrup A, Forman A, Uldbjerg N, Funch-Jensen P, Andersson KE. Mechanical properties of isolated human esophageal smooth muscle. Am J Physiol. 1990;258:G338-G343. [PubMed] |
| 3. | Pandolfino JE, Kahrilas PJ. AGA technical review on the clinical use of esophageal manometry. Gastroenterology. 2005;128:209-224. [RCA] [PubMed] [DOI] [Full Text] [Cited by in Crossref: 233] [Cited by in RCA: 195] [Article Influence: 9.3] [Reference Citation Analysis (0)] |
| 4. | Guyton AC, Hall JE. Heart muscle; the heart is a pump. In Textbook of medical physiology. Philadelphia WB Saunders Co. London: Springer-Verlag 2002; . |
| 5. | Fung YC. Biomechanics. Mechanical properties of living tissues. New York: Springer-Verlag 1993; . |
| 6. | HILL AV. A reinvestigation of two critical points in the energetics of muscular contraction. Proc R Soc Lond B Biol Sci. 1953;141:503-510. [RCA] [PubMed] [DOI] [Full Text] [Cited by in Crossref: 10] [Cited by in RCA: 14] [Article Influence: 0.2] [Reference Citation Analysis (0)] |
| 7. | Komi P. Neuromuscular performance: Factors influencing force and speed production. Scand J of Sports Sci. 1979;1:2-15. |
| 8. | Gregersen H, Christensen J. Gastrointestinal tone. Neurogastroenterol Motil. 2000;12:501-508. [RCA] [PubMed] [DOI] [Full Text] [Cited by in Crossref: 42] [Cited by in RCA: 39] [Article Influence: 1.5] [Reference Citation Analysis (0)] |
| 9. | Gregersen H, Gilja OH, Hausken T, Heimdal A, Gao C, Matre K, Ødegaard S, Berstad A. Mechanical properties in the human gastric antrum using B-mode ultrasonography and antral distension. Am J Physiol Gastrointest Liver Physiol. 2002;283:G368-G375. [PubMed] |
| 10. | Rao SS, Gregersen H, Hayek B, Summers RW, Christensen J. Unexplained chest pain: the hypersensitive, hyperreactive, and poorly compliant esophagus. Ann Intern Med. 1996;124:950-958. [RCA] [PubMed] [DOI] [Full Text] [Cited by in Crossref: 147] [Cited by in RCA: 133] [Article Influence: 4.4] [Reference Citation Analysis (0)] |
| 11. | Mayrand S, Diamant NE. Measurement of human esophageal tone in vivo. Gastroenterology. 1993;105:1411-1420. [RCA] [PubMed] [DOI] [Full Text] [Cited by in Crossref: 51] [Cited by in RCA: 48] [Article Influence: 1.5] [Reference Citation Analysis (0)] |
| 12. | Zhang X, Tack J, Janssens J, Sifrim DA. Neural regulation of tone in the oesophageal body: in vivo barostat assessment of volume-pressure relationships in the feline oesophagus. Neurogastroenterol Motil. 2004;16:13-21. [RCA] [PubMed] [DOI] [Full Text] [Cited by in Crossref: 20] [Cited by in RCA: 18] [Article Influence: 0.8] [Reference Citation Analysis (0)] |
| 13. | Drewes AM, Pedersen J, Liu W, Arendt-Nielsen L, Gregersen H. Controlled mechanical distension of the human oesophagus: sensory and biomechanical findings. Scand J Gastroenterol. 2003;38:27-35. [RCA] [PubMed] [DOI] [Full Text] [Cited by in Crossref: 54] [Cited by in RCA: 55] [Article Influence: 2.4] [Reference Citation Analysis (0)] |
| 14. | Gao C, Petersen J, Arendt-Nielsen L, Drewes AM, Gregersen H. Age-related variation in mechanical and sensory function of the human duodenum. J Appl Res. 2004;4:99-110. |
| 15. | Gregersen H, Kassab G. Biomechanics of the gastrointestinal tract. Neurogastroenterol Motil. 1996;8:277-297. [RCA] [PubMed] [DOI] [Full Text] [Cited by in Crossref: 221] [Cited by in RCA: 206] [Article Influence: 6.9] [Reference Citation Analysis (0)] |
| 16. | Gregersen H, Barlow J, Thompson D. Development of a computer-controlled tensiometer for real-time measurements of tension in tubular organs. Neurogastroenterol Motil. 1999;11:109-118. [RCA] [PubMed] [DOI] [Full Text] [Cited by in Crossref: 24] [Cited by in RCA: 25] [Article Influence: 0.9] [Reference Citation Analysis (0)] |


