INTRODUCTION
Hepatocyte growth factor (HGF) is a known multifunctional cytokine that affects a variety of cell types and plays roles in various cell behaviors. It has a potent mitogenic effect on hepatic cells during the process of regeneration after the liver injury[1]. It stimulates motility of some normal and tumor cells[2,3] and it contributes to the progression of cancers such as the invasiveness of hepatocellular carcinoma[4]. In addition, HGF has a protective effect on liver progenitor cells against apoptosis while enhancing angiogenesis and tumorigenesis[5-7]. Previous evidences have indicated that HGF is secreted from liver myofibroblasts and its functional role is initiated by the interaction with the receptor (c-Met) on the target cell surface[4]. The binding of HGF to c-Met induces receptor dimerization and autophosphorylation at the intracellular tyrosine kinase domain of the b-subunit of the receptors. This tyrosine kinase activation mediates the binding of signaling molecules such as Src, PI3K, PLC, and Grb2 to c-Met multifunctional docking site, which will further activate several signaling pathways leading to functional alterations of the cells[8,9] such as growth and motility[10].
Src is a 60-ku non-receptor protein tyrosine kinase, encoded by a proto-oncogene c-Src. It consists of a unique N-terminal segment, an SH3 domain, an SH2 domain, a catalytic domain, and a short C-terminal tail[11]. Src SH2 domain is available for binding with phosphotyrosine residues of the other molecules such as c-Met and focal adhesion kinase (FAK)[10,12]. It could be mutated and constitutively activated in transformed cells[13]. Increase in Src expression has been reported in several human cancers including colorectal cancer[14], pancreatic carcinoma[15] and breast cancer[16]. Studies on Src activation in cancer cell lines[17] and in animal model[18] have implicated it to the invasiveness of the cells.
FAK is a 125-ku cytoplasmic protein tyrosine kinase that is implicated in integrin-mediated signaling pathways involved in the process of cell cycle, cell spreading and migration and prevention of cell apoptosis[19-21]. FAK overexpression has been observed in a variety of invasive tumors[22-25] as well as in tumor cell lines[26,27]. The function of FAK in the promotion of cancer cells proliferation has been previously demonstrated in an animal model[28].
Both Src and FAK seem to play a crucial role in the transformation and progression of tumor cells. The relationship between them has been extensively investigated, but the mechanism remains unclear. Evidences have indicated that in integrin-mediated signaling or adhesion-dependent pathway, the binding of integrin to its extracellular ligands recruits FAK to aggregate at the focal contact and initiates its autophosphorylation at tyrosine 397[29,30]. The activated FAK functions as a binding site for several downstream signaling molecules including Src[29,30], which interacts with autophosphorylated FAK by its SH2 domain[12,31]. Then, Src phosphorylates FAK at other tyrosine positions such as 576, 577, 861, and 925[32,33]. Phosphorylated FAK, especially at tyrosine 925, becomes a binding site for Grb2, one of the upstream molecules in Ras/MAPK pathway, which consequently activates this signaling pathway and eventually facilitates cell proliferation and migration[29-31]. The downstream pathway after Src and FAK interaction also involves the interaction of phosphorylated FAK with PI3K[34] or Grb7[35] that participated in actin cytoskeleton organization and cell migration. In the adhesion-independent pathway, however, evidence from the study in Phe397-FAK mutant cells has indicated that the SH3 domain of v-Src (a mutated and constitutive activated form of c-Src) could bind with the proline rich region of FAK and is able to mediate cell transformation without external stimuli[13]. The downstream pathway after Src and FAK interaction in these cells could be similarly involved with PI3K or Grb7 as in the adhesion-dependent pathway. Moreover, both FAK and Src have binding association with the exchange factors of the small GTPases in the Rho family, which are then activated by phosphorylation. These in turn regulate cytoskeleton organization and initiate cell migration[36,37].
In this study, we have attempted to clarify the associated function between Src and FAK in HGF-mediated cell proliferation and invasion, using human cholangiocarcinoma cell line, HuCCA-1, as a model. This cell line was isolated and established from a Thai patient who had cancer of the intrahepatic bile duct epithelium[38,39]. This is one of the most aggressive cancers that cause a high fatality rate in Thailand. It rapidly metastasizes to other parts of the body and there is no effective treatment available to date. The relative function of Src and FAK in the cancer cells was determined from their phosphotyrosine activities before and after Src inhibition by using a novel Src inhibitor (AZM555130).
MATERIALS AND METHODS
Materials
Mouse mAbs to cytokeratin 19, a-smooth muscle actin (SMA), FAK and phosphotyrosine (PY20) were purchased from DAKO, Sigma, Pharmingen, and Santa Cruz, respectively. Rabbit polyclonal antibody to FAK (a-KC) was produced in the laboratory at Cornell University, Ithaca, NY, USA. Rabbit polyclonal antibody to Src was purchased from Santa Cruz. Goat anti-mouse IgG-FITC, anti-mouse IgG-HRP, and anti-rabbit IgG-HRP were purchased from Zymed Laboratories Inc. Protein A-Sepharose 4B beads were purchased from Sigma. Recombinant human hepatocyte growth factor (rhHGF) was purchased from Biosource International. Src inhibitor (AZM555130) was a gift from AstraZeneca.
Cell culture
Human cholangiocarcinoma cell line, HuCCA-1, was cultured in HamF-12 medium (Hyclone) containing 10% fetal bovine serum (FBS) at 37 °C in 50 mL/L CO2 incubator. To characterize the cells, immunofluorescent staining for cytokeratin 19 was performed to confirm the epithelial origin of these cells.
Immunofluorescent staining
HuCCA-1 cells were seeded on 12-mm coverslips and placed on a 24-well plate at the density of 5104 cells/well. The cells were cultured until 80-90% confluence. The coverslips from each well were removed and placed on parafilms in cell-side up position. The cells were fixed by immersing in ice-cold methanol: acetone (1:1) and kept at -20 °C for 10 min, air dried at room temperature and rinsed thrice with PBS. Cells were covered with blocking buffer (1% BSA in PBS) at 37 °C for 30 min. After that, the blocking buffer was removed and the cells were incubated with mAbs against cytokeratin 19 (CK-19) or SMA, at room temperature for 1 h. The primary antibodies were removed and the cells were washed thrice with PBS. Then, cells on the coverslips were covered with FITC-conjugated goat anti-mouse IgG for 1 h at room temperature, and washed thrice with PBS. The stained cells were visualized under the Nikon fluorescent microscope at a wavelength of 450-490 nm.
Reverse transcriptase-polymerase chain reaction (RT-PCR)
Evaluation of mRNA expression for HGF and c-Met in HuCCA-1 cells were semiquantitated by RT-PCR. Total RNA was isolated from the cells using TRIzol reagent and RT-PCR was performed using OneStep RT-PCR kit (QIAGEN), following themanufacturer’s instructions. Two micrograms of total RNA and 0.6 µmol/L of each primer were used in each reaction. The specific primer pairs included (1) for hHGF:“5’-GCCTGAAAGATATC-CCGACA-3’” and “5’-TTCCATGTTCTTGTCCCACA-3’”(523 bp), (2) for c-Met: “5’-TCTTGGGACATCAG-AGGGTC-3’” and “5’-TGACTGCAGGACTGGAAATG-3’”(222 bp), (3) for GAPDH (internal control): “5’-TGACTGCAGGACTGGAAATG-3’”(222 bp), and “5’-TCCTTG-GAGGCCATGTG GCCAT-3’”(240 bp).
Immunoprecipitation and Western blotting assays of FAK and Src phosphorylation
Cultured HuCCA-1 cells were washed with ice-cold PBS and digested with radioimmunoprecipitation assay (RIPA) lysis buffer containing phosphatase and protease inhibitors (50 mmol/L sodium fluoride, 1 mmol/L sodium orthovanadate, 1% aprotinin, 2 mmol/L phenylmethylsulfonyl fluoride and 10 µg/mL leupeptin). Whole cell lysates that contained ≥500 µg of total protein were pre-cleared by incubation with protein A-Sepharose beads at 4 °C for 30 min. The beads containing lysates were centrifuged and supernatants were collected. Rabbit polyclonal anti-FAK or anti-Src antibody was added and incubated overnight at 4 °C. Then, protein A-Sepharose beads were added and incubation was continued at 4 °C for an additional 1.30 h. Immunocomplexes were collected by centrifugation and the supernatants were discarded. The beads with immunocomplexes were washed with RIPA lysis buffer, mixed with SDS-PAGE sample buffer, boiled for 5 min and resolved by SDS-polyacrylamide gel electrophoresis. Western blotting was performed using mouse monoclonal anti-phosphotyrosine (PY20) antibody followed by HRP-conjugated goat anti-mouse IgG. The desired protein bands on the membrane were detected by using the enhanced chemiluminescence system (Lumiglo, KPL). To confirm the amount of total FAK or Src in each sample, the same membranes were stripped and reprobed with mouse monoclonal anti-FAK or rabbit polyclonal anti-Src antibody. The density of the bands was measured by densitometry.
Co-immunoprecipitation assay of Src and FAK
HuCCA-1 cells were washed with ice-cold PBS and lysed with NP-40 lysis buffer without salt (1% NP-40, 50 mmol/L Tris-HCl pH 7.4) containing phosphatase and protease inhibitors. Whole cell lysates were processed as above, but the immunoprecipitation was first complex with rabbit polyclonal anti-Src antibody. Then, the complex was resolved by SDS-PAGE and proteins were transferred to nitrocellulose membrane. The membrane was incubated with mouse monoclonal anti-FAK antibody followed by HRP-conjugated goat anti-mouse IgG. The desired protein bands were evaluated as above. The same membrane was stripped and reprobed with anti-Src antibody to confirm the amount of total Src used in each sample.
Cell proliferation assay
Cell proliferation assay was performed by using the In Vitro Toxicology Assay Kit MTT Based (Sigma) following themanufacturer’s instruction. Briefly, HuCCA-1 cells were seeded in a 96-well plate at a density of 1104 cells/well in 100 µL of HamF-12 media containing 10% FBS and cultured overnight in 37 °C, 50 mL/L CO2 incubator. Then, cells were starved in 100 µL of serum-free HamF-12 media for 24 h. Fresh medium (200 µL) with or without 10 or 20 ng/mL rhHGF were replaced and further incubated for 24-48 h. Then, the medium was changed to 100 µL of HamF-12, and 10µL of reconstituted MTT was added into each well. The plate was incubated at 37 °C in 50 mL/L CO2 incubator for 4 h. After incubation, 100 µL of MTT solubilizing solution (10% Triton X-100, 0.1 mol/L HCl in anhydrous isopropanol) was added into each well to dissolve the resulting formazan crystals. Absorbance at a wavelength of 570 nm was measured using a microplate reader. The negative control of the system was performed as the experimental one but without cells. Absorbance at 690 nm was measured to determine the background of the system, and was subtracted from each measurement. The data was statistically analyzed using Student’s t-test and compared with the untreated group. A P value lesser than 0.05 was considered significant.
Cell invasion assay
HuCCA-1 cells, in the density of 1105 cells/200 µL of HamF-12 and 0.1% BSA, were seeded on each upper chamber of 24-well transwell plate (8-µm pore-sized membrane, Costar) coated with 100 µL of 30 µg matrigel (Becton-Dickinson). In the lower chamber, 400 µL/well of HamF-12 with or without 20 ng/mL rhHGF was added. After incubation at 37 °C in 50 mL/L CO2incubator for 48 h, the media in both chambers were removed. The cells that remained on the upper surface of the membrane were wiped off with wet cotton buds. Invasive cells bounded on the lower surface of the membrane were fixed with 25% methanol and stained with 5% crystal violet in 25% methanol. The number of invading cells on each membrane was counted, under light microscope at 40 magnification, for six random microscopic fields per membrane and averaged. Each assay was performed in triplicate.
Inhibition assay of Src-FAK interaction
Cultured HuCCA-1 cells were treated with 0, 0.1, 0.5, and 1.0 µmol/Lof Src inhibitor (AZM555130) for 1 h. Then, they were further incubated with 20 ng/mL rhHGF or without rhHGF for 48 h. The whole cell lysates were extracted for immunoprecipitation and Western blotting assay to determine the level of Src and FAK phosphorylation. Cell proliferation was performed by MTT assay as described above. The effect on cell invasion was performed by incubation of the cells with 0, 0.1, or 1.0 µmol/L of AZM555130 for 1 h and then seeded onto the upper chambers of 24-well transwell plates. HamF-12 medium with or without 20 ng/mL rhHGF was added in the lower chambers and the cells were cultured for 48 h. The number of cells invading through matrigel was analyzed as described above.
RESULTS
Characterization of HuCCA-1 cells
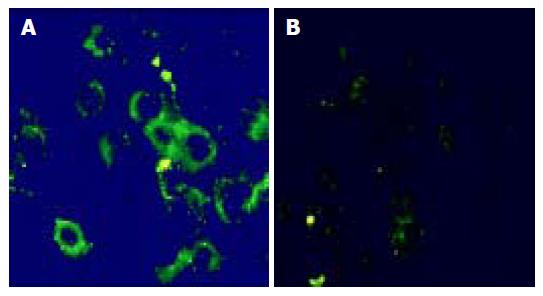
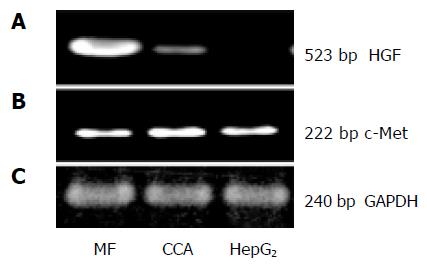
HuCCA-1 cells were intensely labeled with anti-cytokeratin-19 (CK19, Figure 1A) but not with SMA antibodies (Figure 1B), which indicated the epithelial origin of the cells. This confirms the previous characterization by the establishers[38,39]. The semi-quantitative determination of mRNA expression for HGF and its receptors (c-Met), by RT-PCR analysis, showed a high level of c-Met but a low level of HGF mRNA gene expression (Figures 2A-C). Liver myofibroblasts and hepatocellular carcinoma cell line, HepG2, were used as positive controls for HGF and c-Met gene expression, respectively.
Figure 1 Immunofluorescent study in HuCCA-1 cells shows positive staining to human CK-19 mAb (A) and negative staining to SMA mAb (B) (40×magnification).
Figure 2 mRNA expression level of HGF (A) and c-Met (B) was observed by RT-PCR technique.
HuCCA-1 (CCA) expressed low HGF but a high level of c-Met mRNA. Liver myofibroblasts (MF) and hepatocellular carcinoma cell line (HepG2) were used as positive controls for HGF and c-Met, respectively. Equal amount of total RNA from each cell was confirmed by GAPDH (C).
Effect of HGF on HuCCA-1 cell proliferation and invasion
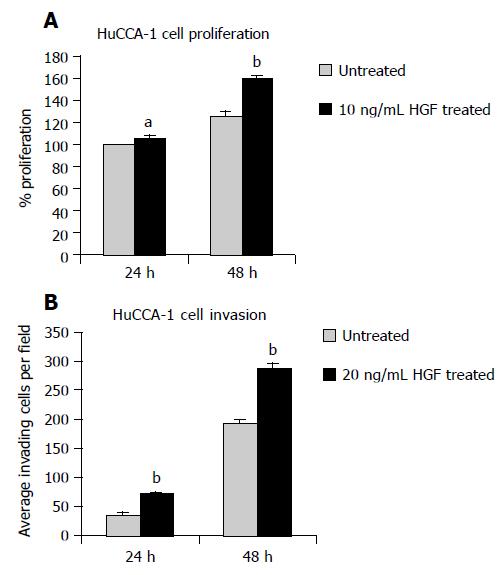
HuCCA-1 cell proliferation and invasion were enhanced by treatment with rhHGF, in a time-dependent fashion (Figures 3A and B). After 24-48 h treatment with 10 ng/mL rhHGF, HuCCA-1 cell proliferation was significantly increased when compared to the control (P < 0.05 and 0.01 at 24 and 48 h, respectively, Figure 3A). The number of invading cells was also increased significantly when 20 ng/mL rhHGF was added into the lower chamber without the serum (P < 0.001 and 0.001 at 24 and 48 h, respectively, Figure 3B).
Figure 3 Cell proliferation assay showed significantly increased proliferating cell number after 10 ng/mL rhHGF treatment in HuCCA-1 cells for 24 and 48 h (A).
Invasion assay also showed significantly increased invading cells after 24 and 48 h treatment of 20 ng/mL rhHGF (B). Data are expressed as mean±SE, aP < 0.05 and bP < 0.01, compared to the HGF-untreated cells at the corresponding time.
Effect of HGF on phosphorylation of FAK and Src
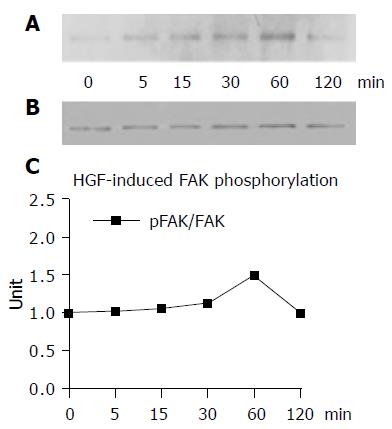
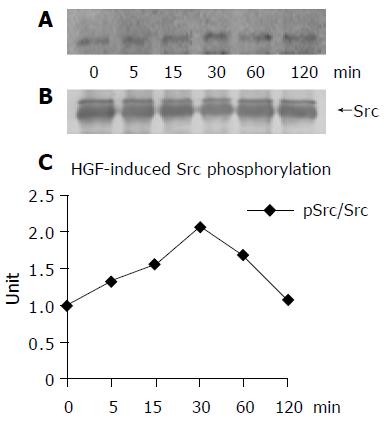
The immunoprecipitation and Western blotting assays demonstrated that HGF promoted FAK and Src phosphorylation in a time-dependent manner. The maximal level of tyrosine phosphorylation on FAK was reached after 60 min of HGF induction and then declined to the basal level after 120 min (Figures 4A and B). For Src phosphorylation, the level was peaked at 30 min after HGF induction (Figures 5A and B).
Figure 4 Treatment of HuCCA-1 cells with 20 ng/mL rhHGF for 0, 5, 15, 30, 60, and 120 min showed increased degree of FAK phosphorylation in a time-dependent manner.
The maximal level of FAK phosphorylation was reached at 60 min and then sharply decreased at 120 min (A). Equal amount of FAK protein used in each time point was confirmed by reprobing the membrane with anti-FAK antibody (B). The density of bands was measured and pFAK/FAK value was plotted in a graph (C).
Figure 5 Treatment of HuCCA-1 cells with 20 ng/mL rhHGF for 0, 5, 15, 30, 60, and 120 min showed an increased degree of Src phosphorylation in a time-dependent manner.
The maximal level of Src phosphorylation was reached at 30 min (A). Equal amount of Src protein (upper bands) used in each time point was confirmed by reprobing the membrane with anti-Src antibody (B). The density of bands was measured and pSrc/Src value was plotted in a graph (C).
The interaction between Src and FAK after HGF induction
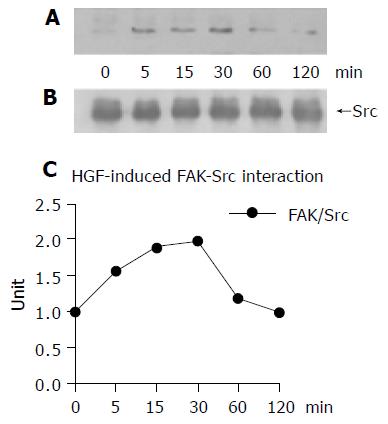
Co-immunoprecipitation of Src and FAK in HGF-induced cells revealed that HGF promoted Src and FAK interaction. The Src-FAK immunoprecipitation level reached a maximum at 30 min (Figures 6A-C). This was well correlated to the level of Src phosphorylation (Figure 5) indicating that the Src-FAK complex was formed before FAK became phosphorylated.
Figure 6 The interaction between Src and FAK was demonstrated in HGF-treated HuCCA-1 cells by co-immunoprecipitation at varied time points.
The resulting bands showed a positive correlation of FAK with Src phosphorylation, which reached a maximum at 30 min and then declined (A). The amount of Src protein (upper bands) used in each time point was confirmed (B). The density of bands was measured and the ratio between FAK and Src was plotted in the graph (C).
Effect of Src inhibitor (AZM555130) on Src and FAK phosphorylation
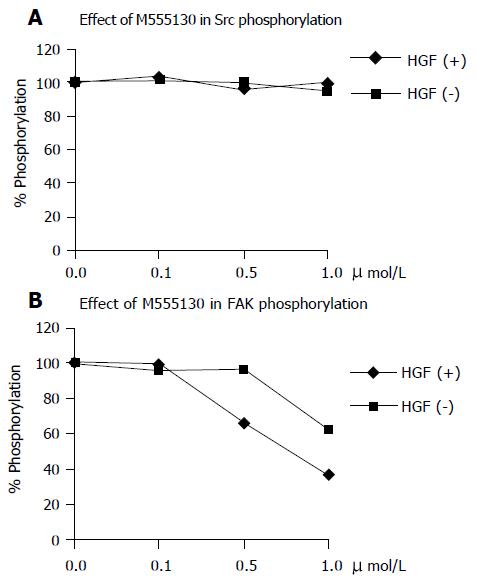
After 48 h treatment, Src inhibitor had no inhibition effect on Src phosphorylation (Figure 7A) both in HGF-induced and non-induced cells, but it had inhibition effect on FAK phosphorylation in a dose-dependent manner (Figure 7B). In HGF-induced FAK phosphorylation, a low dose at 0.1 µmol/L was not inhibited, but higher doses (0.5 and 1.0 µmol/L) were gradually inhibited. In non-HGF-induced cells, the inhibition effect was significant at a higher dose (1.0 µmol/L) than for HGF-induced cells.
Figure 7 Treatment of cells with 0.
1, 0.5, and 1.0 µmol/L of AZM555130 for 48 h showed no inhibition of Src phosphorylation both in HGF-treated and untreated cells (A). The HGF-induced FAK phosphorylation was not inhibited after 48 h treatment of0.1 µmol/L AZM555130 but showed 34% and 63% inhibition by 0.5 and 1.0 µmol/L treatment, respectively. The 37% inhibition of FAK phosphorylation was observed by treatment of 1.0 µmol/L AZM555130 in non-induced cells (B). These values were compared with the levels of Src and FAK phosphorylation in AZM555130-untreated cells which is equal to 100%.
Effect of Src inhibitor (AZM555130) on HuCCA-1 cell proliferation
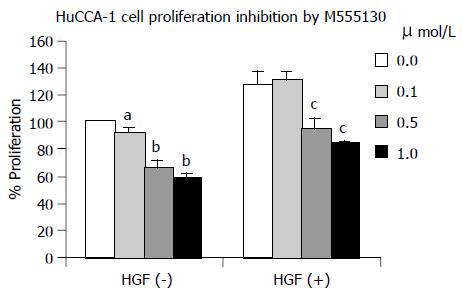
HuCCA-1 cell proliferation in both HGF-induced and non-induced conditions was significantly inhibited by the treatment with AZM555130 (Figure 8). The non-induced cells were more affected than the induced cells. In HGF-induced cells, cell proliferation was reduced by 25% and 34% at the doses of 0.5 and 1.0 µmol/L,, respectively (P < 0.01, both). In the non-induced cells, the cell proliferation was reduced by 9% (P < 0.05), 33% (P < 0.01) and 41% (P < 0.01) at the doses of 0.1, 0.5, and 1.0 µmol/L,, respectively.
Figure 8 The HGF-mediated cell proliferation was not inhibited by 0.
1 µmol/L AZM555130 but was significantly inhibited by 0.5 and 1.0 µmol/L of AZM555130 for 25% and 34%, respectively. Without HGF, cell proliferation was inhibited by 0.1, 0.5, and 1.0 µmol/L of AZM555130 for 9%, 33%, and 41%, respectively. All values are mean±SE, aP < 0.05 and bP < 0.01, compared to the control in HGF-untreated cells; dP < 0.01, compared to the control in HGF-treated cells.
Effect of Src inhibitor (AZM555130) on HuCCA-1 cell invasion
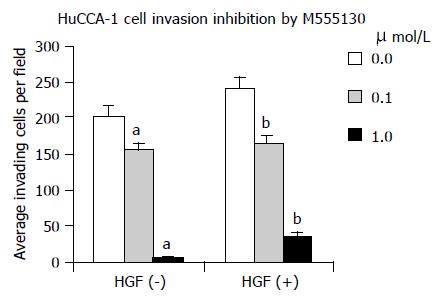
Treatment of HuCCA-1 cells with AZM555130 reduced cell invasiveness in both HGF-induced and non-induced conditions, in a dose-dependent manner (Figure 9). The induced cells were more sensitive than the non-induced cells at the low dose, but the non-induced cells were more sensitive than the induced cells at the high dose. At the concentration of 0.1 and 1.0 µmol/L, AZM555130 significantly decreased the invasive ability of the HGF-induced cells by 32% and 85%, respectively and of the non-induced cells by 23% and 98%, respectively (P < 0.01, all).
Figure 9 The HGF-mediated invasion of HuCCA-1 cells was significantly decreased by 0.
1 and 1.0 µmol/L of AZM555130 for 32% and 85%, respectively. Without HGF, cell invasion was also significantly decreased by 0.1 and 1.0 µmol/L of AZM555130 for 23% and 98%, respectively. All values are mean±SE, bP < 0.01, compared to the control in HGF-untreated cells; dP < 0.01, compared to the control in HGF-treated cells.
DISCUSSION
Cholangiocarcinoma cells (HuCCA-1) showed high c-Met mRNA expression, thus they responded well to HGF induction. The profound effects of HGF in enhancing HuCCA-1 cell proliferation and invasion demonstrated here reflect the events in cholangiocarcinoma patients with high HGF (produced from the liver myofibroblasts) that exerted its action through c-Met to promote the rapid progression of cancer. Since various cancers respond differently to various growth factors and/or cytokines, their signaling mediators were believed to be very diverse[3,40]. The signaling molecules mediated by growth factors and/or cytokines to regulate normal-cell proliferation have been previously determined[41,42]. The implication of FAK activation via integrin-mediated signaling to promote cell migration in normal and embryonic cells has also been reported[29,43]. This study emphasized the signaling mechanism mediated by Src and FAK after the binding of HGF to c-Met. We found that in association with its promoting cell proliferation and invasiveness, HGF was also found to maximize the cytoplasmic tyrosine phosphorylation of Src and FAK in HuCCA-1 cells (Figures 4 and 5). FAK phosphorylation increased slightly at 30 min after the induction and reached the maximum level at 60 min. Src phosphorylation occurred prior to FAK phosphorylation and the level peaked at 30 min after the induction. Although the basal levels of both Src and FAK phosphorylation were high in the non-induced stage, the earlier and higher effect of HGF on Src phosphorylation was observed than on FAK phosphorylation in the induced stage. These results suggest that HGF-mediated signaling via Src. When Src was co-immunoprecipitated with FAK in the HGF-induced cells, Src phosphorylation pattern and time course level was similar to the pattern and level of the non-induced cell. It was suggested that Src phosphorylation and Src-FAK interaction occurred side by side and Src probably was the upstream effector molecule to FAK. Therefore, the sequences of signaling mechanism in HGF-induced HuCCA-1 cells could be (i) The binding of HGF to c-Met induced the conformational change and autophosphorylation of the receptors[44]. (ii) The binding of Src SH2 domain to the phosphorylated receptors at tyrosine 1349 and 1356 positions of the c-Met multifunctional docking site[45]. (iii) The phosphorylation of Src, and (iv) Src further activated FAK by Src kinase activity. However, previous investigation has indicated that FAK has no specific binding site on c-Met but Src was a substrate and a binding partner of FAK[29,46]. Apparently, the functional relationship between Src and FAK molecules was reversed in the induced HuCCA-1 cells. To act on its substrate FAK, Src might have to use its SH2 domain to bind c-Met and SH3 domain to bind the proline-rich region of FAK[12,21,47]. Subsequently, Src catalytic domain phosphorylates FAK at other tyrosine residues leading to the cascade of signaling pathways for cell proliferation such as activation of Ras/MAPK pathway. This pathway has been raised in the study of human embryonic kidney 293 cells under the induction of HGF, where FAK was suggested as an adaptor molecule in Src phosphorylation[48]. In addition, the activation through Src/p130Cas-signaling cascade was believed to use FAK as a mediator necessary for HGF-induced cell growth and invasiveness in MDCK cells[49].
To confirm that the signaling pathway mediated by HGF-c-Met interaction has Src as an upstream molecule to FAK, we inhibited Src by using a novel Src inhibitor (AZM555130). The results showed that AZM555130 could not inhibit Src phosphorylation (Figure 7A) but inhibit FAK phosphorylation (Figure 7B) since the inhibitor AZM555130 acted by specifically binding to its tyrosine kinase domain to block the enzyme activity[50], not to its tyrosine phosphorylation. Therefore, Src tyrosine phosphorylation remained stable (Figure 7A). However, when Src kinase activity was inhibited, the downstream signaling molecules, which were substrates for Src including FAK could not be further phosphorylated (Figure 7B). The effect of inhibitor to Src on FAK phosphorylation was concentration-dependent and more sensitive in HGF-induced cells than in the non-induced cells (Figure 7B). This further supported that Src was an intermediate linker between c-Met and FAK and Src enzyme activity was directly inhibited by AZM555130. Without HGF, the response of Src (as a kinase for FAK) to the inhibitor was low and required higher concentration of AZM555130 to reduce FAK phosphorylation.
The proliferation of HGF-induced cells was decreased after Src inhibitor treatment, at the concentration of 0.5-1.0 祄ol/L, which was well correlated with FAK phosphorylation inhibition. In the non-induced cells, decreased cell proliferation by Src inhibitor was also detected but at the lower extent. Inhibition of HuCCA-1 cell invasion was found to be dependent on AZM555130 concentration both in cells with and without HGF induction indicating the high efficiency of the inhibitor.
The overall results implied that Src and FAK were the pivotal signaling molecules that mediated signaling pathway for HGF-induced cells. Src catalytic activity was enhanced in HGF-induced cells and functioned as a kinase for FAK. FAK was phosphorylated and further led to the downstream pathways to cell proliferation and invasion. In order to effectively stop the progression of cancers such as cholangiocarcinoma, in which FAK phosphorylation was specifically induced by the paracrine effect of HGF, inhibition of FAK or blocking of Src-FAK interaction should be taken into consideration.


