INTRODUCTION
Angiogenesis is a process by which new capillaries develop from an existing microvascular network. It is associated with a number of physiologic and pathologic conditions including malignancies, diabetic retinopathy, and rheumatoid arthritis. Angiogenesis in fibrin-based matrix is especially interesting because it is essential in tumor angiogenesis and wound healing.
Angiogenesis was first observed in vitro by Folkman and Haudenschild 20 years ago[1]. After culture of endothelial cells, these cells organize spontaneously into capillary-like structures (CLS) with the presence of lumina. From a physiological point of view, an ideal in vitro system would take into account all the representative steps of in vivo angiogenesis, from detachment of endothelial cells from the vascular wall to final tubular morphogenesis and vascular network formation. It should be also rapid, easy to use, reproducible, and easily quantifiable. Depending on the way the cells reorganize, the in vitro models of angiogenesis described to date can be roughly classified into two categories: two-dimensional (2-D) and three-dimensional (3-D). While 2-D angiogenesis models lack the third dimension and obviously do not reflect all physiological steps, the 3-D models are closer to the in vivo environment, because they consider more steps of angiogenesis[2].
A variety of 3-D in vitro models of angiogenesis have been developed in the past few years[3-7] and have thus significantly increased our understanding of the roles of endothelial cells, extracellular matrix (ECM), growth factors and other bioactive molecules in angiogenesis.
In this study, we described an in vitro system of angiogenesis, which was based on microcarriers (MCs), human microvascular endothelial cells (HMVECs) and fibrin extracellular matrix. With this system, the angiogenic effect of basic fibroblast growth factor (bFGF) and vascular endothelial growth factor (VEGF) and their synergism were tested.
MATERIALS AND METHODS
Cell isolation and culture
HMVECs were isolated from juvenile foreskin as described previously[8,9]. Briefly, the foreskin was cut into small pieces, washed with PBS and incubated with 15-20 mL of 2 g/L dispase in DMEM (Gibco BRL Cat# 11885-084) overnight (18-24 h) at 4 °C. The tissue pieces were transferred into DMEM and scratched with a scalpel. The remnants were discarded and the resulting cell suspension (containing HMVEC and other contaminating cell types) was centrifuged at 1000 r/min for 5 min. The pellet was re-suspended in 10-15 mL of endothelial growth medium (EGM) consisting of endothelial basal medium (EBM) (Clonetics, San Diego, CA), supplemented with 10 ng/mL epidermal growth factor (EGF) (Clonetics), 12 μg/mL bovine brain extract (BBE) (Clonetics), 1.0 μg/mL hydrocortisone (Clonetics), 100 U/mL penicillin (Clonetics), and 100 mg/mL streptomycin (Clonetics) in the presence of 150 mL/L normal human serum and seeded into a gelatin-coated 75-cm2 tissue culture flask. Culture medium was changed every 2-3 d. Before the cultures were confluent (normally 5-7 d after seeding), the HMVECs were separated from the other cells in culture by immuno-magnetic isolation with CD31-Dynabeads following the manufacturer’s instructions (Dynal A.S, Oslo, Norway). Endothelial cell cultures were characterized and determined to be > 99% pure on the basis of the formation of typical cobblestone monolayer in culture and positive immuno-staining for factor VIII-related antigen (Beijing Zhongshan Biotechnology Co., Ltd). The purified HMVECs were cultured in EGM at 37 °C (50 mL/L CO2) on gelatin-coated cell culture surfaces. All assays were conducted with cells in passages 6 to 8.
Microcarrier cell culture
Gelatin-coated cytodex-3 microcarriers (MCs) (Amersham Pharmacia Biotech, Piscataway, NJ) were prepared according to the recommendations of the supplier. Freshly autoclaved MCs were suspended in EGM and endothelial cells were added to a final density of 50-80 cells/MC. The cells were allowed to attach to the MCs in a 1.5 mL Eppendorf tube for 4 h at 37 °C. The MCs were then re-suspended in a larger volume of medium and cultivated for another 24-48 h at 37 °C (50 mL/L CO2). MCs were gently agitated to prevent aggregation of individual MCs. MCs were used for angiogenesis assay when the endothelial cells on the MCs reached confluence[10,11].
Microcarrier-based fibrin gel angiogenesis assay
The microcarrier-based fibrin gel angiogenesis assay was performed as described[10] with some modifications. Working solution of fibrinogen (Shanghai Raas Blood Product Co., Ltd) was prepared by dissolving the stock solution of fibrinogen (20 mg/mL in PBS) in EBM to a concentration of 1.0 mg/mL, supplemented with EGF and hydrocortisone at 10 ng/mL and 1.0 μg/mL, respectively. The 24-well plates were used for the assay. The bottom of each well was first covered with 250 μL fibrinogen solution, and the clotting was induced by addition of thrombin (0.5 U/mL). After 30 min of polymerization, another 250 μL of fibrinogen solution containing about 250 EC-coated MCs was added. The MCs were evenly distributed in the fibrinogen by gently shaking the culture plates, and polymerization was induced as described above. After complete polymerization, 1.0 mL of EBM supplemented with 10 ng/mL of EGF, 1.0 μg/mL of hydrocortisone and 50 mL/L adult human serum was added on the gel. To prevent excess fibrinolysis by fibrin-embedded cells, aprotinin was added to the growth media at 200 KIU/mL. For the experiments, which required bFGF (PeproTech EC Ltd) and/or VEGF (PeproTech EC Ltd), the components were added to both of the fibrinogen solution and the supernatant medium at the desired concentrations.
Quantification and statistics
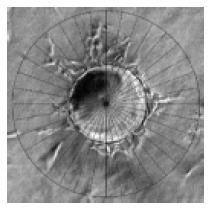
At the time point of interest, six random fields of vision for every well were digitally photographed under inverted microscope, and the pictures were transferred to a computer. The quantification of capillary-like structure formation was performed as described by Xue and Greisler with some modifications[12]. Briefly, a special grid was made by dividing a circle with radially oriented lines around 360 degrees with 10-degree intervals using Photoshop (version 6.0; Adobe Systems Inc). The digital photographs were transparently layered with the grid. For each photographed microcarrier, the lengths of sprouts were measured on each of the grid lines and summed (Figure 1). The lengths of sprouts from each MC were averaged in each well. The average lengths of sprouts (ALS) from 8 replicate wells of each testing group were analyzed and expressed as mean ± SD. SPSS system for one-way ANOVA was used to compare the differences during the time courses and the General Liner Model (GLM) was used to determine the synergism. P < 0.05 was considered statistically significant.
Figure 1 Quantification of angiogenesis.
Each MC in random photographed fields was overlaid with a grid that was equally divided around 360o at 10-degree intervals (original magnification × 100). For each photographed microcarrier, the lengths of sprouts were measured on each of the grid lines and summed. The lengths of sprouts from each MC were averaged in each well. The average lengths of sprouts (ALS) from 8 replicate wells of each testing group were analyzed. Bar: 100 mm.
RESULTS
Sequential steps of capillary formation
In 1995, Nehls and Herrmann described a microcarrier-based in vitro model of angiogenesis[9]. In their model, the endothelial cells coated on the microcarriers invaded the fibrin gel, forming elongated capillary-like structure in a response to angiogenic factors. However, this model was performed with large vascular endothelial cells of calf pulmonary artery origin. Although in later studies, they used human microvascular endothelial cells to investigate their response to the co-cultured tumor cells, but no positive result was found[13]. In the present study, by modifying the system, we successfully established the microcarrier-based in vitro model of angiogenesis with human microvascular endothelial cells in fibrin.
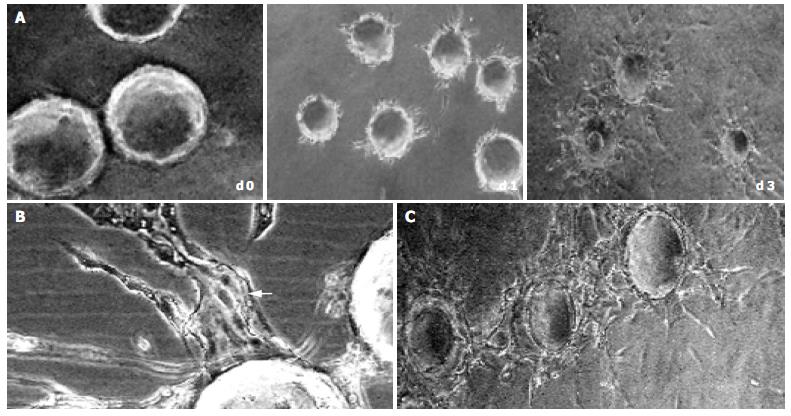
In the early stages of capillary growth (about 16 h after polymerization of the fibrin gel), the HMVECs on microcarriers migrated into fibrin matrix to form sprouts without detectable lumina. At about 16-48 h, sprouts elongated, and small intracellular or intercellular lumina was formed. Usually, broad lumina developed at the base of the sprouts. The lumina frequently contained cellular debris, which could be seen to float by shaking the culture dishes, indicating that lumina contents had liquefied. The tips of capillary sprouts were generally solid or showed only primitive, slit-like lumina, which in later stages anastomosed to other sprouts, and finally formed capillary-like network (at about 5-7 d) (Figure 2). This result was not consistent with what was observed by Nehls and Herrmann, who assumed that due to the presence of serum, anastomosis of capillary sprouts occurred rarely[14].
Figure 2 Sequential steps of capillary formation.
During 3 d after polymerization of the fibrin gel, the HMVECs (bFGF 40 ng/mL) on microcarriers migrated into fibrin matrix to form sprouts, which elongated (A) with intracellular or intercellular lumina formed (bFGF 40 ng/mL). The lumina frequently contained cellular debris, which can be seen to float by shaking the culture dishes, indicating that lumina contents had liquefied (B, arrow). In the late stage (d 5), the capillary sprouts anastomosed to each other, and finally formed capillary-like network (C) (original magnification × 100).
Capillary sprout formation induced by bFGF and VEGF
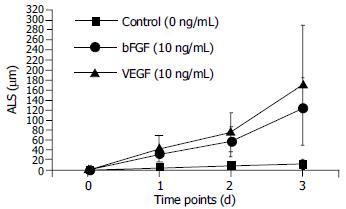
In the absence of growth factors, capillary sprout formation in our model was minimal. Both bFGF and VEGF induced obvious EC sprouting. The curves for both cytokines increase significantly with time. The angiogenic effects of both cytokines were dose- dependent over the range from 10 to 40 ng/mL. At d 1, 10 ng/mL of bFGF and VEGF induced angiogenesis with an ALS of 32.13 ± 16.6 μm and 43.75 ± 27.92 mm, respectively, which was significantly higher than that of the control (5.88 ± 4.45 mm, P < 0.01). With the time going, on the difference became more significant (Figure 3). Within the dose range, angiogenesis increased correspondingly in both extent and rapidity as the concentration increased (Figure 4).
Figure 3 Time course of HMVEC angiogenesis in fibrin.
Microcarriers coated with HMVECs were embedded in fibrin. The angiogenic effects of either bFGF or VEGF were dose-dependent over the range from 10 to 40 ng/mL. At day 1, 10 ng/mL of bFGF and VEGF induced angiogenesis with an ALS of 32.13 ± 16.6 μm and 43.75 ± 27.92 mm, respectively, which were significantly higher than that of the control (5.88 ± 4.45 mm, P < 0.01). The difference became more significant, as the time increased.
Figure 4 Dose responses of bFGF and VEGF on angiogenesis.
Both bFGF and VEGF exhibited dose-dependent angiogenic effects in the range from 10 to 40 ng/mL. At d 1, 10 ng/mL of bFGF and VEGF induced angiogenesis with an ALS of 32.13 ± 16.6 µm and 43.75 ± 27.92 µm, respectively, which were significantly higher than that of the control (5.88 ± 4.45 µm, P < 0.01). With the concentration increasing, the difference became more significant.
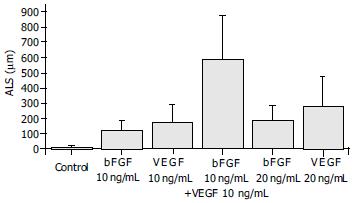
Exposure of ECs to both bFGF and VEGF in combination stimulated an angiogenic response that was greater than sum of their individual effects, and that occurred more rapidly than the response to either growth factor. The ALS induced by 10 ng/mL of bFGF plus 10 ng/mL of VEGF in combination was 590.75 ± 289.15 mm, which was greater than the total effects of 10 ng/mL of bFGF (124.00 ± 62.12 mm) and 10 ng/mL of VEGF (171.38 ± 119.42 mm) and also greater than that induced by 20 ng/mL of either bFGF (187.25 ± 98.14 mm) or VEGF (280.5 ± 198.23 mm) (Figure 5). The synergism of bFGF and VEGF was confirmed by the GLM test, which showed that the effect of the combination of bFGF plus VEGF was greater than the sum of the individual effects of bFGF and VEGF alone (P = 0.011) (Figure 5).
Figure 5 Synergism of bFGF and VEGF.
The samples were quantitated at d 3. The combination of 10 ng/mL bFGF and 10 ng/mL VEGF induced an angiogenic response that was greater than the sum of the effects by each cytokine alone at the same dose (P = 0.011).
DISCUSSION
Three-dimensional angiogenesis assays are based on the capacity of activated endothelial cells to invade 3-D substrates. The matrix may consist of collagen gels, plasma clot, purified fibrin, matrigel, or a mixture of these proteins with others. The culture medium may be added to the gel before polymerization or on top of the gel. Depending on the culture medium composition (percentage of serum, addition of cytokines), cells can be induced to sprout, proliferate, migrate, differentiate, and tubular endothelial cell phenotypes in the 3-D configuration. Thus, one can in vitro observe the morphogenic responses of isolated ECs, which characterize the in vivo angiogenesis. In fact, a variety of 3-D angiogenesis models have provided great advances in the understanding of angiogenesis and the investigation of angiogenic/anti-angiogenic factors[2].
In 3-D angiogenesis models, the ECs were usually reorganized in the following ways: directly overlaid by gels[15,16], sandwiched between two gel layers[17], seeded dispersedly[18] or clustered as spheroids in gels[3,4], or attached onto microcarrier beads. Microcarrier-based angiogenesis model was firstly developed by Nehls and Drenckhan[10], who suggested, in their later studies, that in the presence of serum, the anastomosis of capillary sprouts occurred only rarely[14].
In this study, we also established an in vitro angiogenesis system based on microcarrier, but it was with human dermal microvascular endothelial cells (HMVECs). With this system, we observed all of the angiogenic steps that characterize the in vivo angiogenesis, including sprouting (16-24 h), branching (24-48 h), and capillary network formation (after 72 h), as described above. However, not in agreement with the observation by Nehls and Drenckhan, we found that the anastomosis of capillary sprouts occurred commonly in the later stage (3-5 d), even in the presence of up to 100 mL/L serum in our system (data not shown). After 5 d, the capillary-like network could be seen around/between MCs.
Since one of our goals was to characterize the gene expression patterns at the different steps of angiogenesis including sprouting, branching and networking, our 3-D angiogenesis model thus gave a good supporting. However, because of the morphological complexity, the capillary-like network at the late stage of the model was difficult to be quantified. So, we confined our observation to the first 3 d of the culture for the angiogenic quantification of the growth factors.
Angiogenesis in physiological conditions is characterized by strict regulation and occurs mostly through a collagen-rich extracellular matrix and leads to the formation of an organized capillary network. In contrast, in different pathological conditions as they are associated with tumor growth or wound healing, capillary sprouting processes are known to primarily occur in a fibrin-rich matrix and the stimulation of new vessels is exaggerated, leading to the formation of a disorganized[4,19], capillary network. As one of the native ECM components involved in angiogenesis, fibrin is formed by the polymerization of fibrinogen after the proteolytic cleavage by thrombin. This scenario naturally takes place at sites of wound healing and tumor under the stimulation of VEGF and other factors, and leads to the deposition and stabilization of local fibrin clots. These fibrin clots serve as a temporary matrix that provides a solid support for invading cells, such as fibroblasts and endothelial cells.
In vitro angiogenesis in fibrin is affected by EC fibrinolysis involving both plasmin and metalloproteinase systems and the spatial structure of the gel[20,21]. Cell surface fibrinolytic activity is crucial for EC invasion and migration in fibrin[22,23]. The presence of aprotinin is necessary to maintain the integrity of fibrin. In the absence of aprotinin, fibrin was unable to support EC angiogenesis because it would be degraded before capillary-like structure formation. The configuration and mechanical properties of fibrin were determined by the conditions in which it polymerized. Various factors, including pH, ionic strength, fibrinogen and thrombin concentrations could affect the structural feature of fibrin[24]. It is thus important to prepare fibrin at a well-controlled condition when performing fibrin matrix-based angiogenic experiments, and to avoid any modification between the groups when comparing the potency of different angiogenic factors.
Many growth factors have been found to have angiogenic effects. FGFs and VEGFs are the best characterized among them. FGFs and VEGFs bind with high specificity to their cognate receptor tyrosine kinases, inducing activation of the intrinsic enzymatic activity of these receptors. This activity leads to tyrosine phosphorylation of the receptors, as well as of substrates for the kinases. In some cases, growth factors may induce angiogenesis by regulating the expression of some other growth factors and their receptors[19]. It is noteworthy that FGF and VEGF may act synergistically in induction of angiogenesis. Synergy of these growth factors in in vivo angiogenesis has been reported[25], and combination of the two factors also yielded a synergistic response in collagen-based in vitro system[26,27]. The mechanisms responsible for this synergism are that these two growth factors closely interact with each other in angiogenic process. bFGF could induce expression of endogenous VEGF and its receptors in ECs[28-30], and VEGF-receptor antagonists inhibited bFGF-induced angiogenesis in spite of its lack of activities against bFGF receptors[31]. The capacity of VEGF to induce u-PA-plasmin activity and angiogenesis depended on endogenous bFGF produced by ECs[32]. In our fibrin and microcarrier-based angiogenesis model, we also found that both bFGF and VEGF demonstrated angiogenic effects on HMVECs in a dose-depended manner, and when applied in combination these two factors also acted synergistically.
In conclusion, we have successfully established a microcarrier-based in vitro three-dimensional angiogenesis model that offers a unique system for quantitative analysis of angiogenesis. The model is especially applicable to in vitro evaluation and screening of novel angiogenic or angiostatic factors. It may also shed light on the study of molecular mechanism of angiogenesis.


