©The Author(s) 2003.
World J Gastroenterol. Aug 15, 2003; 9(8): 1734-1738
Published online Aug 15, 2003. doi: 10.3748/wjg.v9.i8.1734
Published online Aug 15, 2003. doi: 10.3748/wjg.v9.i8.1734
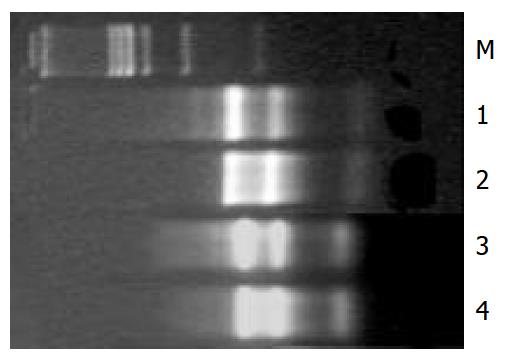
Figure 1 Result of total RNA electrophoresis and hot-stabili-zation test.
M: PCR marker; 1: RNA of HGF/SF-treated group; 2: RNA of control group; 3: RNA of HGF/SF-treated group after hot-treatment; 4: RNA of control group after hot-treatment.
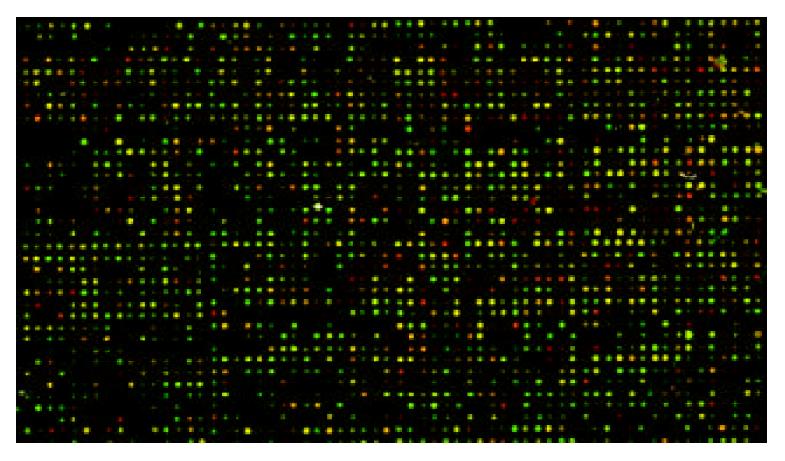
Figure 2 The overlaying image for bicolor fluorescence label on gene chip.
red: high expression; green: low expression; yellow: no change in expression.
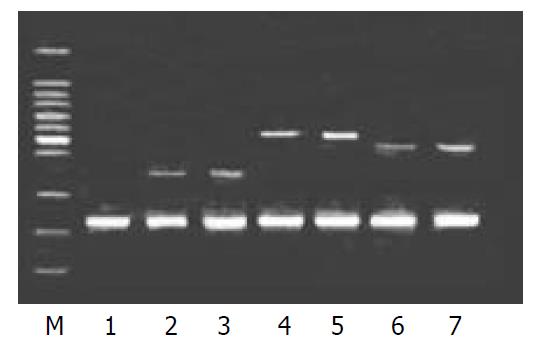
Figure 3 Result of RT-PCR for up-regulated genes.
M: 100 bp DNA ladder marker; 1: negative control; 2: CAMK4 blank control; 3: CAMK4 HGF 80 ng/ml; 4: SHPG blank control; 5: SHPG HGF 80 ng/ml; 6: Heregulin blank control; 7: Heregulin HGF 80 ng/ml.
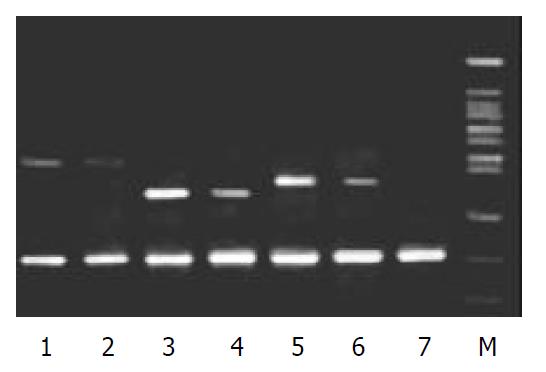
Figure 4 Result of RT-PCR for down-regulated genes.
1: p130 blank control; 2: p130 HGF 80 ng/ml; 3: DAP-1 blank control; 4: DAP-1 HGF 80 ng/ml; 5: TRAMP blank control; 6: TRAMP HGF 80 ng/ml; 7: negative control; M: 100 bp DNA ladder marker.
- Citation: Li XN, Ding YQ, Liu GB. Transcriptional gene expression profiles of HGF/SF-met signaling pathway in colorectal carcinoma. World J Gastroenterol 2003; 9(8): 1734-1738
- URL: https://www.wjgnet.com/1007-9327/full/v9/i8/1734.htm
- DOI: https://dx.doi.org/10.3748/wjg.v9.i8.1734


