Copyright
©The Author(s) 2003.
World J Gastroenterol. Jun 15, 2003; 9(6): 1241-1245
Published online Jun 15, 2003. doi: 10.3748/wjg.v9.i6.1241
Published online Jun 15, 2003. doi: 10.3748/wjg.v9.i6.1241
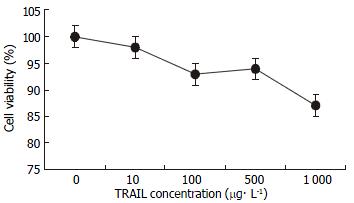
Figure 1 Effect of TRAIL on SW480 cells.
SW480 cells were treated with TRAIL at the concentrations of 0, 10, 100, 500 and 1000 μg•l-1 for 24 h. Cell growth inhibition was assessed by MTT assay and confirmed by flow cytometry assay. Compared with TRAIL-sensitive leukaemic cell line Jurkat (IC50 0.42 μg•l-1), SW480 cells (IC50 > 1000 μg•l-1) were not responsive to TRAIL at concentration more than 100 times those active on Jurkat.
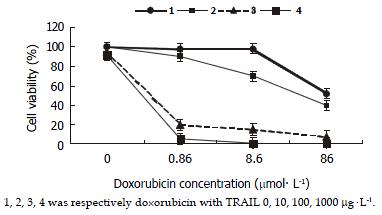
Figure 2 Effect of TRAIL and doxorubicin on SW480 cells.
SW480 cells were treated with doxorubicin alone or a combination of doxorubicin with TRAIL at different concentrations. The combination resulted in the reduction of doxorubicin IC50 in cells (P < 0.05). Doxorubicin IC50 was 65.25 ± 3.48 when cells were treated by doxorubicin alone, while it was further reduced with the increased concentrations of TRAIL. Doxorubicin IC50 was 43.17 ± 2.54 μmol•l-1 when it was combined with 10 mg•l-1of TRAIL, 0.51 ± 0.02 μmol•l-1IC50 when combined with 100 μg•l-1 TRAIL, and 0.44 ± 0.02 μmol•l-1 IC50 when combined with 1000 μg•l-1TRAIL.
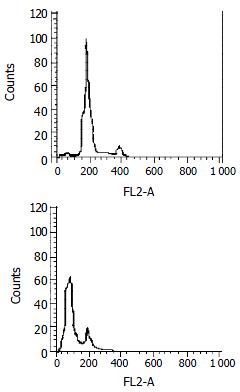
Figure 3 Apoptosis assay by flow cytometry.
SW480 cells were treated with doxorubicin (0.86 μmol•l-1) alone, TRAIL (100 μg•l-1) alone or a combination of them for 24 h. The apoptosis-inducing effect was quantified by PI stain flow cytometry assay. A: There was no hypodiploid DNA peak before G1 phase which was similar to normal cells when treated with TRAIL (100 μg•l-1) or doxorubicin (0.86 μmol•l-1) alone. B: There was an obvious hyperdiploid DNA peak before G1 phase in combination treatment, with apoptotic rate of 76.82% ± 1.93%. It was in accordance with cytotoxicity by MTT assay.
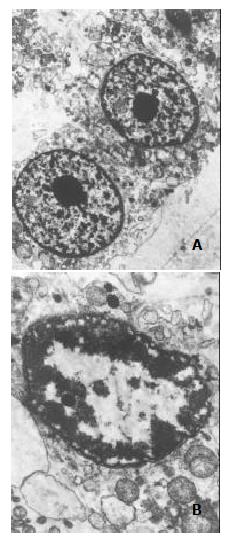
Figure 4 Subcellular morphology of SW480 cells under treatment of TRAIL (100 mg•l-1), doxorubicin (0.
86 mmol•l-1), or the combination of them. The electron microscopic morphology was observed after 24 h treatment at the given concentration.A: TRAIL (100 μg•l-1) or doxorubicin (0.86 μmol•l-1) alone didn't affect the morphology of cells, with complete construction and evenly distributed chromatin (× 5000). B: The combination of TRAIL (100 μg•l-1) and doxorubicin (0.86 μmol•l-1) induced apoptosis in many cells, presented as condensed chromatin, distributing along nuclear perimeter (× 15000).
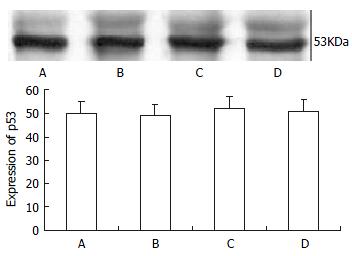
Figure 5 p53 protein level by Western blot assay.
They were detected after 24 h of treatment. A, B, C, D were respectively normal control, TRAIL (100 μg•l-1), doxorubicin (0.86 μmol•l-1) and TRAIL (100 μg•l-1) + doxorubicin (0.86 μmol•l-1) groups. There was no difference in p53 protein expression among these four groups (P > 0.05).
- Citation: Xu LH, Deng CS, Zhu YQ, Liu SQ, Liu DZ. Synergistic antitumor effect of TRAIL and doxorubicin on colon cancer cell line SW480. World J Gastroenterol 2003; 9(6): 1241-1245
- URL: https://www.wjgnet.com/1007-9327/full/v9/i6/1241.htm
- DOI: https://dx.doi.org/10.3748/wjg.v9.i6.1241


