©The Author(s) 2003.
World J Gastroenterol. May 15, 2003; 9(5): 1014-1019
Published online May 15, 2003. doi: 10.3748/wjg.v9.i5.1014
Published online May 15, 2003. doi: 10.3748/wjg.v9.i5.1014
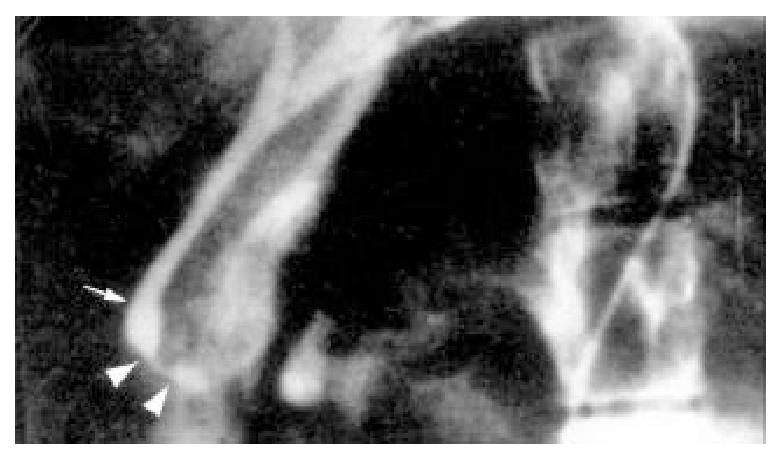
Figure 1 During bile draining in control group.
It was showed that the mOS portion was in a peristaltic movement ↑→▲ and the narrow distal segment (▲→▲) was portion of the mOS and SO segment of bile duct. Between the end of choledochus and the cCS portion was demarcated by in notch (↑).
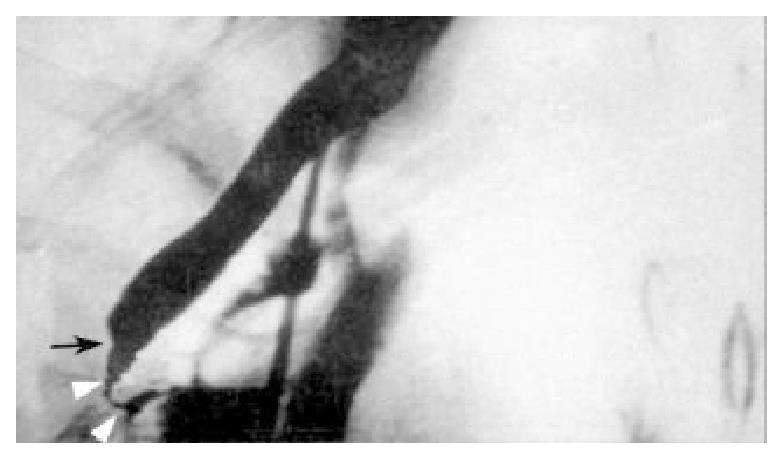
Figure 2 In experimental group of bile drainage.
During bile draining the remarkable notch to keep up still in between the choledochus and the cCS portion, and it appeared to be in an "infundibulum" shape at the cCS portion and there was no significant contraction in the form of spastic cCS portion of bile duct and no significant peristelsis movement and there appeared to be a narrow lumen as a "thin line", to last until the bile draining period ended at the mOS segment. Infusion of 33.3% MgSO4 after, no significant change was seen in the diameter of cCS partion (↑→▲) and mOS segment (▲→▲) of bile duct.
Figure 3 Pressure curves of the cCS and mOS portion and duodenum in control group.
There is high pressure zone and rythmical contractile movement was appeared in the mOS portion of bile duct and pressure of the cCS portion of bile duct is lower than pressure of the mOS and the SO portion of bile duct.
Figure 4 Reaction to the injection of 33.
3% MgSO4 in control group. 10 min after 20 ml of 33.3% MgSO4 was injected through the catheter placed in duodenum, the pressure of mOS seg-ment of bile duct is decreased, compared that before the injection, and unregular pressure curves was appeared in the mOS segment of bile duct.
Figure 5 A pressure curves before MgSO4 solution infusion in the study group.
Signs of the pressure curves is similar to the control group in the mOS segment of bile duct.
Figure 6 A pressure curves ofter MgSO4 solution infusion in the study group.
Signs of the pressure curves is similar to the pressure curves before MgSO4 solution infusion.
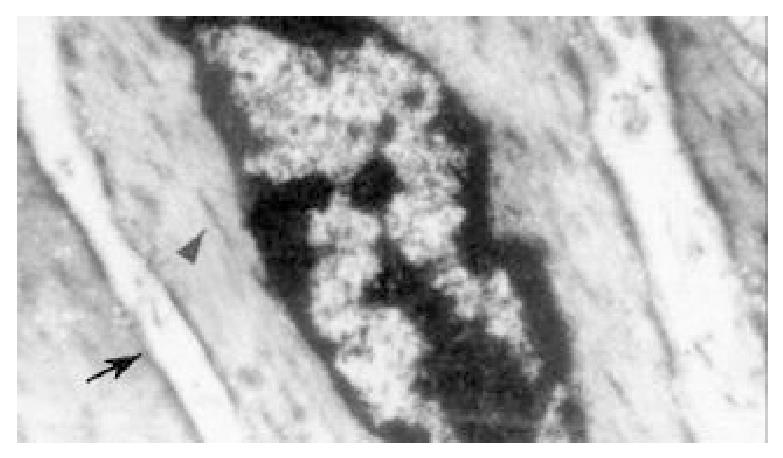
Figure 7 The figure is a transection of cCS portion of bile duct in the control group.
It is showed that the smooth muscular cell membrane (↑) was flat, the myofilament and dense body appeared to be longitudinal arrangement in parallel to the long axis of smooth muscular cell and the dense body like spindles (▲). The structure of the mitochondrion was normal, which evenly distributed itself among the cytoplasm.
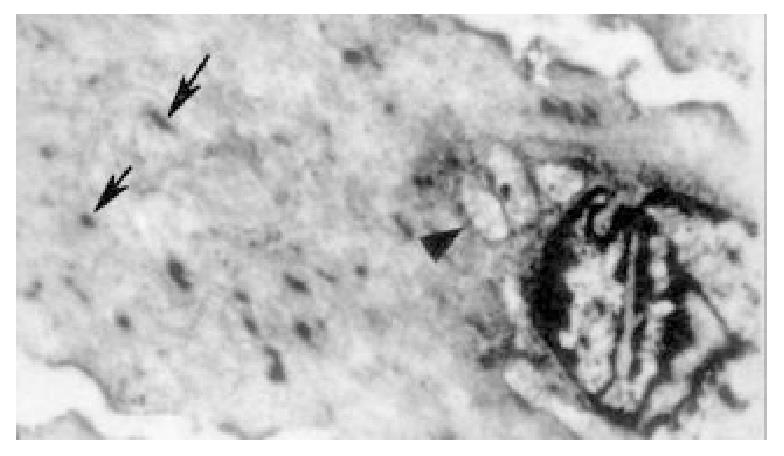
Figure 8 The figures is a transection of cCS portion of bile duct in experimental group.
Under the electronmicroscope the cell membrane twisted like billows, and the myofilament density was not even, shaping like "whirl". The dense body showed derangement and various shapes (↑). The mitochondrions clustered at the end of the nucleus, and vacuolation (▲) was seen.
- Citation: Wei JG, Wang YC, Liang GM, Wang W, Chen BY, Xu JK, Song LJ. The study between the dynamics and the X-ray anatomy and regularizing effect of gallbladder on bile duct sphincter of the dog. World J Gastroenterol 2003; 9(5): 1014-1019
- URL: https://www.wjgnet.com/1007-9327/full/v9/i5/1014.htm
- DOI: https://dx.doi.org/10.3748/wjg.v9.i5.1014


