©The Author(s) 2003.
World J Gastroenterol. Apr 15, 2003; 9(4): 683-687
Published online Apr 15, 2003. doi: 10.3748/wjg.v9.i4.683
Published online Apr 15, 2003. doi: 10.3748/wjg.v9.i4.683
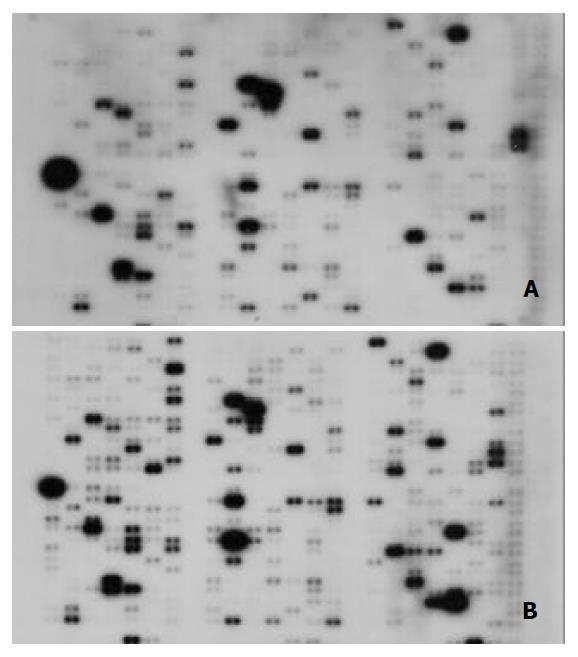
Figure 1 Parallel analyses of gene expression profiles in hu-man hepatoma cell line HLE and normal liver tissues.
Atlas human cancer cDNA expression array (Clontech, USA) was hybridized with 32P-labeled cDNA probes in normal liver tis-sues (A) and human hepatoma cell line HLE (B).
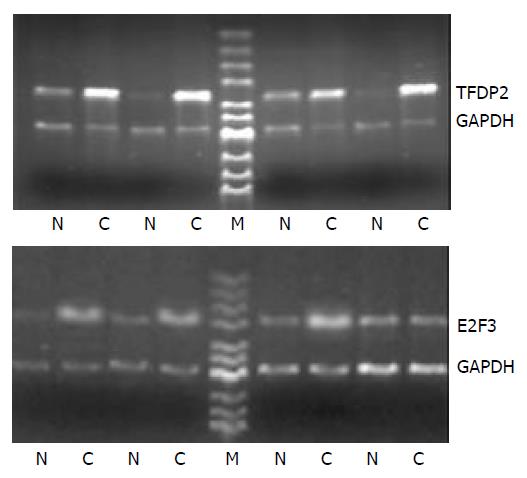
Figure 2 Partial semi-quantitative RT-PCR for 2 genes in 24 paired tissues.
A total of 10 µl RT-PCR products were electro-phoresed on 2% agarose gel containing ethidium bromide. GAPDH was used as an internal control. (RT-PCR, reverse tran-scription polymerase chain reaction; N, adjacent normal liver tissue; C, human hepatocellular carcinoma tissue; GAPDH, glyceraldehyde-s-phosphate dehydrogenase; M, pUC Mix Maker).
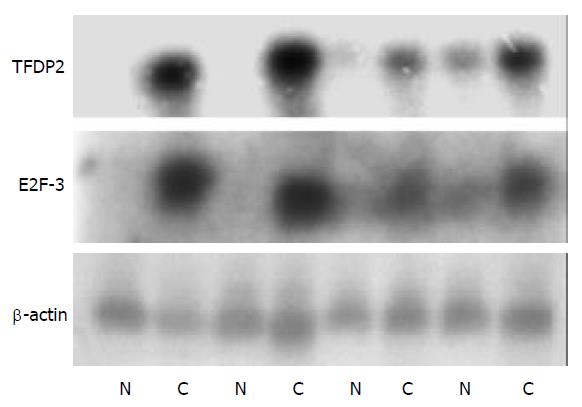
Figure 3 Northern blot analysis of 2 genes to confirm the Atlas human cancer cDNA expression array.
Four paired cases were used to determine these genes expression patterns. Twenty µg RNA was analyzed on a 1.2% denaturing agrose gel and trans-ferred onto a nylon membrane. 32P-labeled cDNA probes for these genes were hybridized to the RNA-blotted membranes. After stringent washes, membranes were exposed to X-ray film overnight at -70 °C. The same membranes were rehybridized with human β-actin for an RNA loading control (N, adjacent normal liver tissue; C, human HCC tissue).
- Citation: Liu LX, Liu ZH, Jiang HC, Zhang WH, Qi SY, Hu J, Wang XQ, Wu M. Gene expression profiles of hepatoma cell line HLE. World J Gastroenterol 2003; 9(4): 683-687
- URL: https://www.wjgnet.com/1007-9327/full/v9/i4/683.htm
- DOI: https://dx.doi.org/10.3748/wjg.v9.i4.683


