Copyright
©The Author(s) 2003.
World J Gastroenterol. Dec 15, 2003; 9(12): 2737-2741
Published online Dec 15, 2003. doi: 10.3748/wjg.v9.i12.2737
Published online Dec 15, 2003. doi: 10.3748/wjg.v9.i12.2737
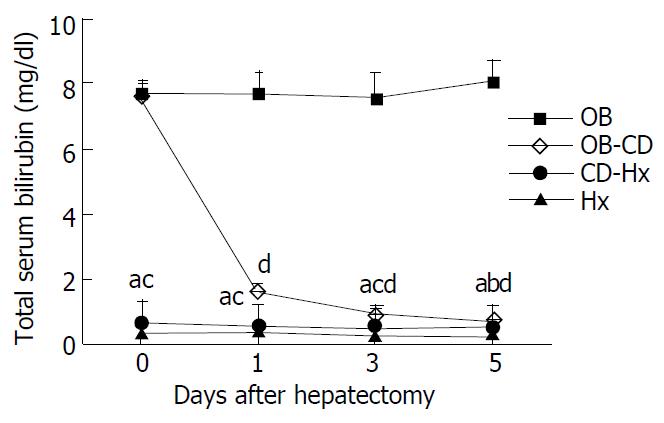
Figure 1 Changes of total serum bilirubin after hepatectomy.
Blood was withdrawn from the tail vein while each rat was under ether anesthesia, and serum was obtained by means of centrifugation. Each point represents the mean ± SEM for six animals. aP < 0.01 CD-Hx group vs OB group, bP < 0.05 CD-Hx group vs OB-CD group, cP < 0.01 CD-Hx group vs OB-CD group, dP < 0.01 OB-CD group vs OB group.
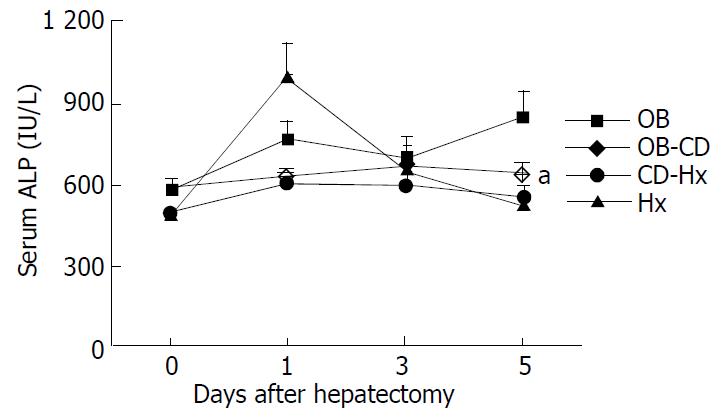
Figure 2 Changes of serum ALP after hepatectomy.
Six rats were used for each group. Results were the mean ± SEM. aP < 0.05 CD-Hx group vs OB group.
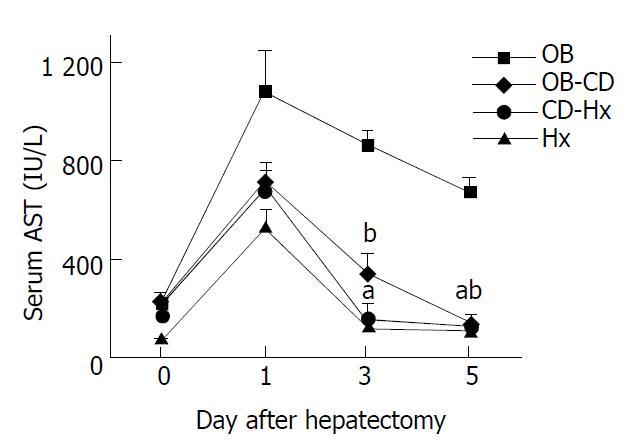
Figure 3 Changes of serum AST after hepatectomy.
Six rats were used for each group. Results were the mean ± SEM. aP < 0.01 CD-Hx group vs OB group, bP < 0.01 OB-CD group vs OB group.
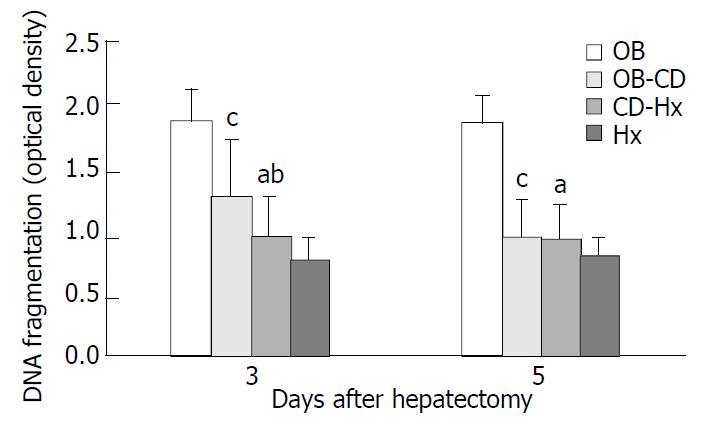
Figure 4 Quantification of oligonucleosomal DNA fragments.
The supernatant from the liver homogenate was subjected to a sandwich ELISA designed to detect DNA/histone fragments. Each group consisted of 6 rats. Values were expressed as mean ± SEM. aP < 0.01 CD-Hx group vs OB group, bP < 0.05 CD-Hx group vs OB-CD group, cP < 0.01 OB-CD group vs OB group.
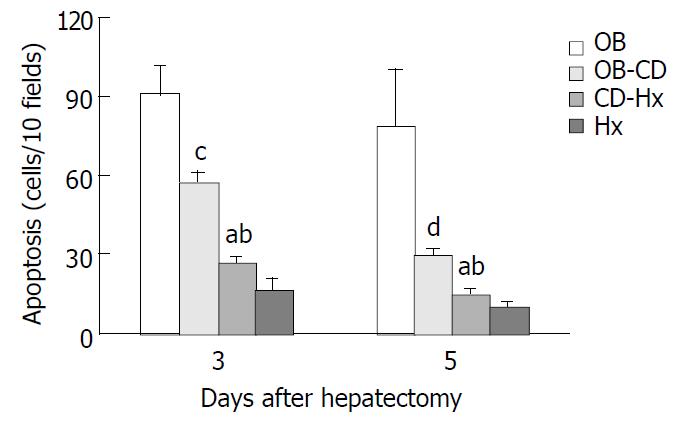
Figure 5 Changes of hepatocellular apoptotic index after hepatectomy.
Morphometric analysis of the positive cells in tissue stained by TUNEL method was performed under high power magnification (×400) in a blinded fashion. Each group consisted of 6 rats. The number of positive cells was counted and expressed as the total number of apoptotic cells seen in every ten high-power fields sections. Values were expressed as mean ± SEM. aP < 0.01 CD-Hx group vs OB group, bP < 0.01 CD-Hx group vs OB-CD group, cP < 0.05 OB-CD group vs OB group, dP < 0.01 OB-CD group vs OB group.
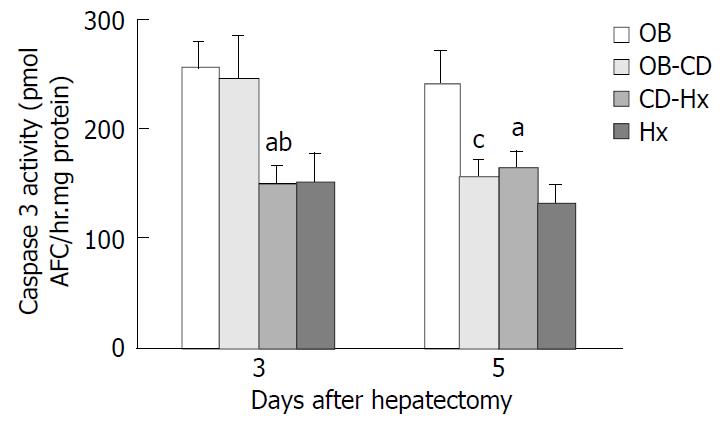
Figure 6 Changes of Caspase-3-like protease activity after hepatectomy.
50 µM DEVD-AFC was added to whole cell lysates (50 µg of total protein) for 1 h. The activity of Caspase-3-like protease was measured by determining the cleaved fluorogenic substrates using a spectrofluorometer at 400/505 nm. Each group consisted of 6 rats. Values shown represented mean ± SEM. aP < 0.05 CD-Hx group vs OB group, bP < 0.05 CD-Hx group vs OB-CD group, cP < 0.05 OB-CD group vs OB group.
- Citation: Wang DS, Dou KF, Li KZ, Gao ZQ, Song ZS, Liu ZC. Hepatocellular apoptosis after hepatectomy in obstructive jaundice in rats. World J Gastroenterol 2003; 9(12): 2737-2741
- URL: https://www.wjgnet.com/1007-9327/full/v9/i12/2737.htm
- DOI: https://dx.doi.org/10.3748/wjg.v9.i12.2737


