Copyright
©The Author(s) 2003.
World J Gastroenterol. Dec 15, 2003; 9(12): 2681-2685
Published online Dec 15, 2003. doi: 10.3748/wjg.v9.i12.2681
Published online Dec 15, 2003. doi: 10.3748/wjg.v9.i12.2681
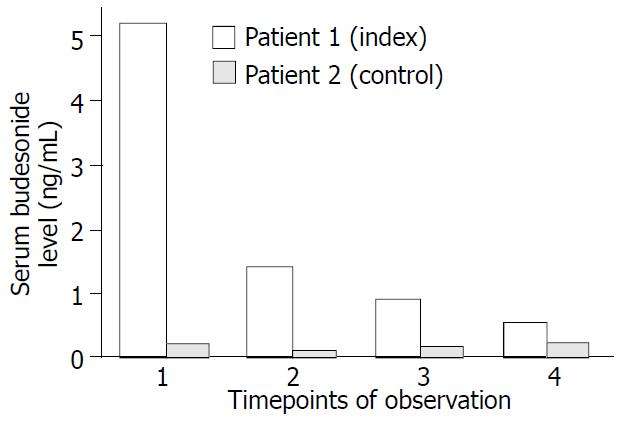
Figure 1 Serum concentration of budesonide.
Serum levels of budesonide were analyzed 3 hours after intake of 6 mg 4 times during a 5-month period of follow-up. Budesonide levels were largely elevated in the index case compared to the control patient 2 with average drug levels of 1.9 ± 2.1 ng/mL and 0.15 ± 0.07 ng/mL, respectively. The dashed line indicates serum levels of heathy controls.
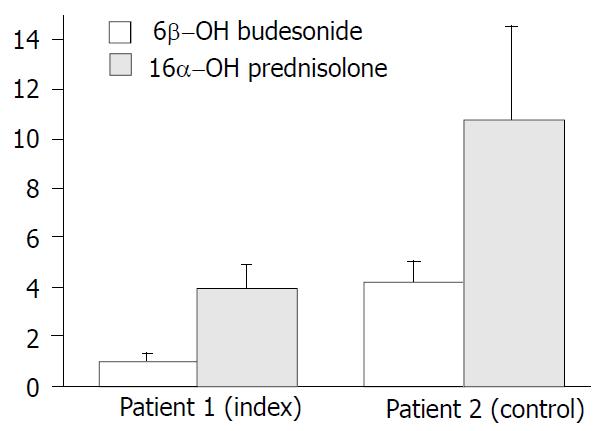
Figure 2 Ratio of metabolites to budesonide.
6β-OH-budesonide and 16α-OH-prednisolone serum levels were determined at the same time points as given in Figure 1. Metabolite-to-drug ratios were calculated and data are given as average ± SEM.
Figure 3 Portosystemic shunt index.
Summed images with regions of interest over heart and liver of patients 1 (A) and 2 (B) after per rectal scintigraphy using 340MBq Tc-99m petechnetate.
- Citation: Geier A, Gartung C, Dietrich CG, Wasmuth HE, Reinartz P, Matern S. Side effects of budesonide in liver cirrhosis due to chronic autoimmune hepatitis: influence of hepatic metabolism versus portosystemic shunts on a patient complicated with HCC. World J Gastroenterol 2003; 9(12): 2681-2685
- URL: https://www.wjgnet.com/1007-9327/full/v9/i12/2681.htm
- DOI: https://dx.doi.org/10.3748/wjg.v9.i12.2681


