Copyright
©The Author(s) 2002.
World J Gastroenterol. Dec 15, 2002; 8(6): 1035-1039
Published online Dec 15, 2002. doi: 10.3748/wjg.v8.i6.1035
Published online Dec 15, 2002. doi: 10.3748/wjg.v8.i6.1035
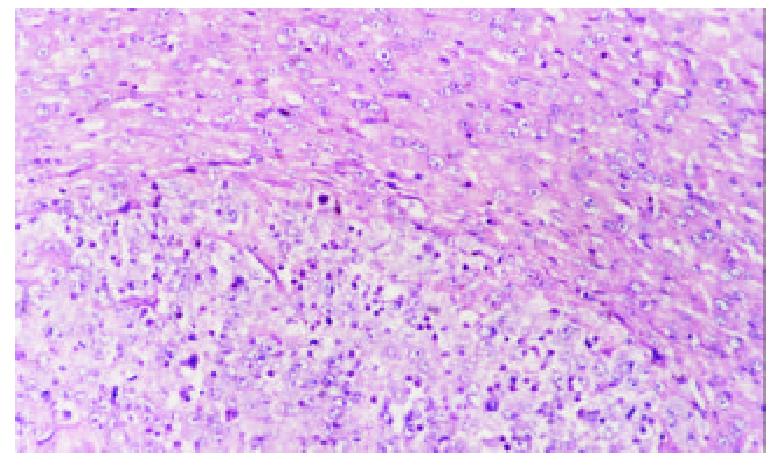
Figure 1 Control group, 7 days after hepatic artery infusion, show tumor and thin capsule.
Hematoxylin-eosin × 200
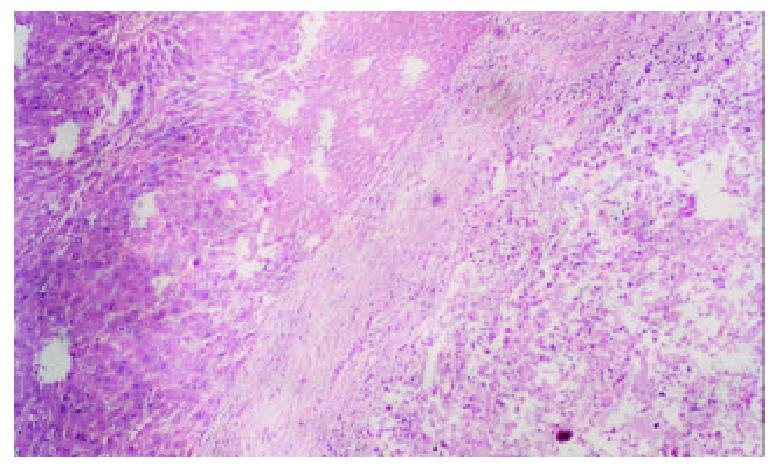
Figure 2 TACE group, 7 days after hepatic artery embolization, show tumor center necrosis, thick fibrous capsules, and de-generation or necrosis in normal hepatic parenchyma adjacent the tumor.
Hematoxylin-eosin × 100.
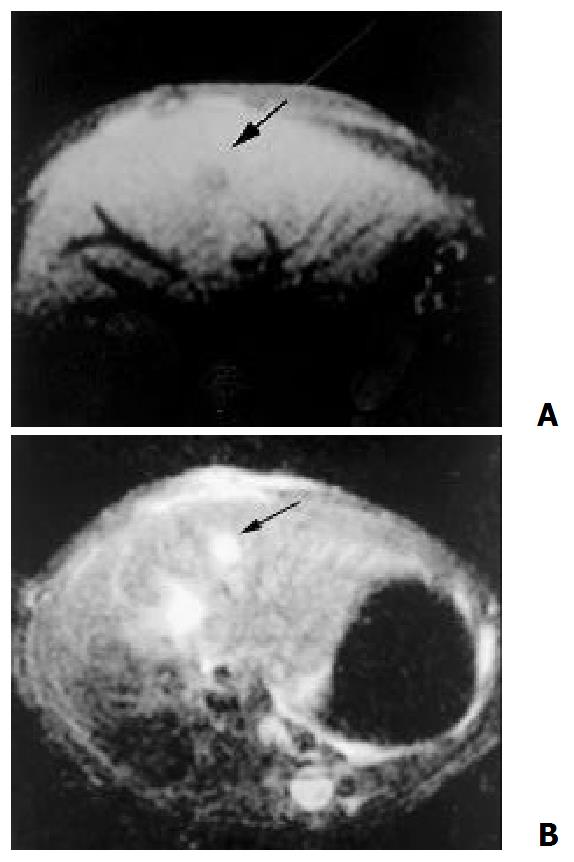
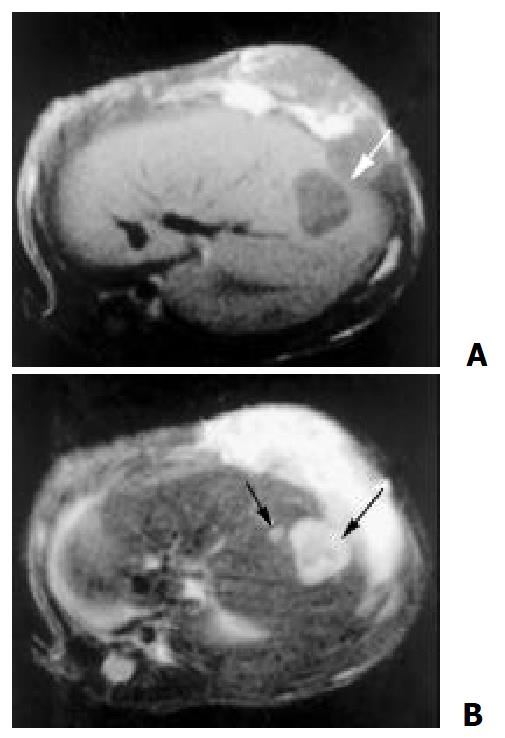
Figure 3 8 days after the implantation, MR demonstrate a node with clear shape, hypointensity on T1- weighted (A) and hyperintensity on T2 – weighted (B)
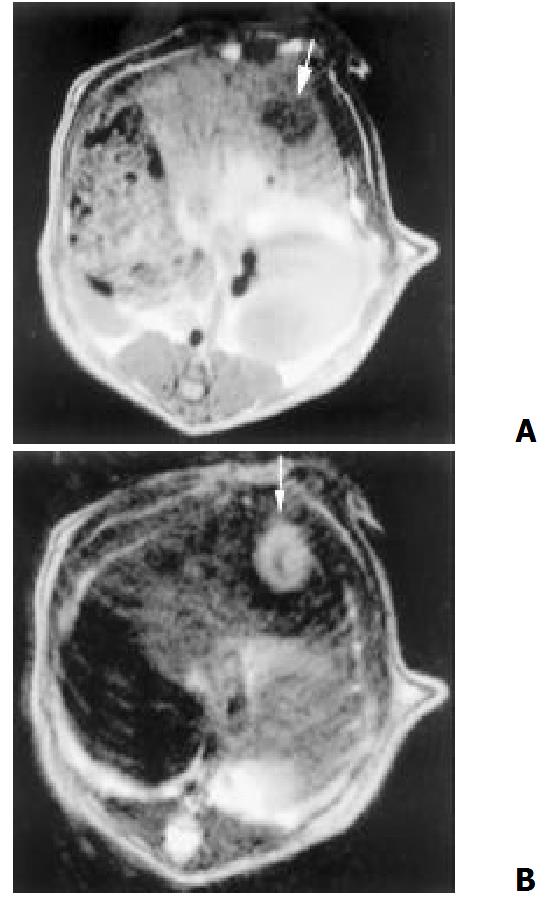
Figure 4 14 days after the implantation, tumor center showed lower intensity on T1 (A) and T2-weighted (B) than that of periphery, which indicate coagulation necrosis
Figure 5 One week after TACE, MR showed center necrosis, periphery rim sign of slight higher T1 (A) and T2 (B) intensity, and the satellite nodular (B)
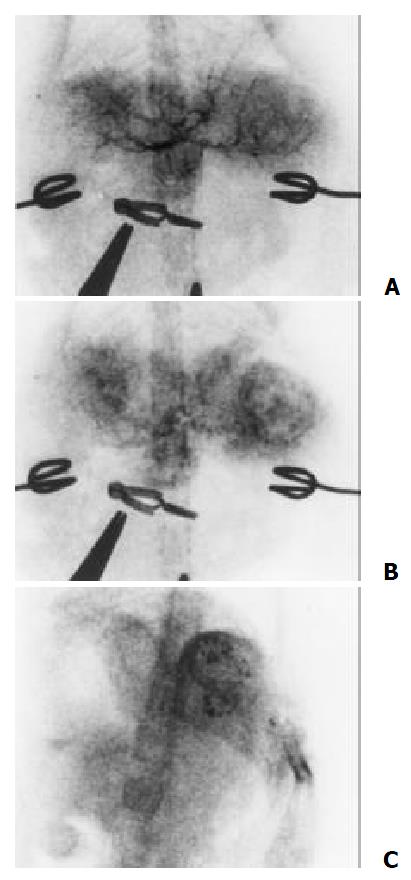
Figure 6 The tumor were mainly fed by the hepatic artery.
Angiography features including hypervascularity, irregular tortuous and convoluted vessels (A), tumor stain (B) and the deposition of iodized oil in tumor after embolization (C)
- Citation: Li X, Zheng CS, Feng GS, Zhuo CK, Zhao JG, Liu X. An implantable rat liver tumor model for experimental transarterial chemoembolization therapy and its imaging features. World J Gastroenterol 2002; 8(6): 1035-1039
- URL: https://www.wjgnet.com/1007-9327/full/v8/i6/1035.htm
- DOI: https://dx.doi.org/10.3748/wjg.v8.i6.1035


