Copyright
©The Author(s) 2002.
World J Gastroenterol. Aug 15, 2002; 8(4): 686-693
Published online Aug 15, 2002. doi: 10.3748/wjg.v8.i4.686
Published online Aug 15, 2002. doi: 10.3748/wjg.v8.i4.686
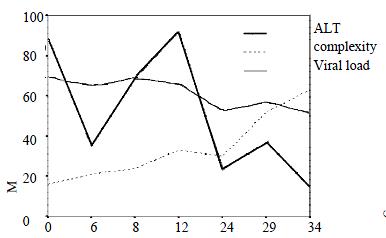
Figure 1 Changes in HCV viral load, ALT level, and HCV-E2 sequence clonotype ratio at serial samples from six individuals with HCV infection.
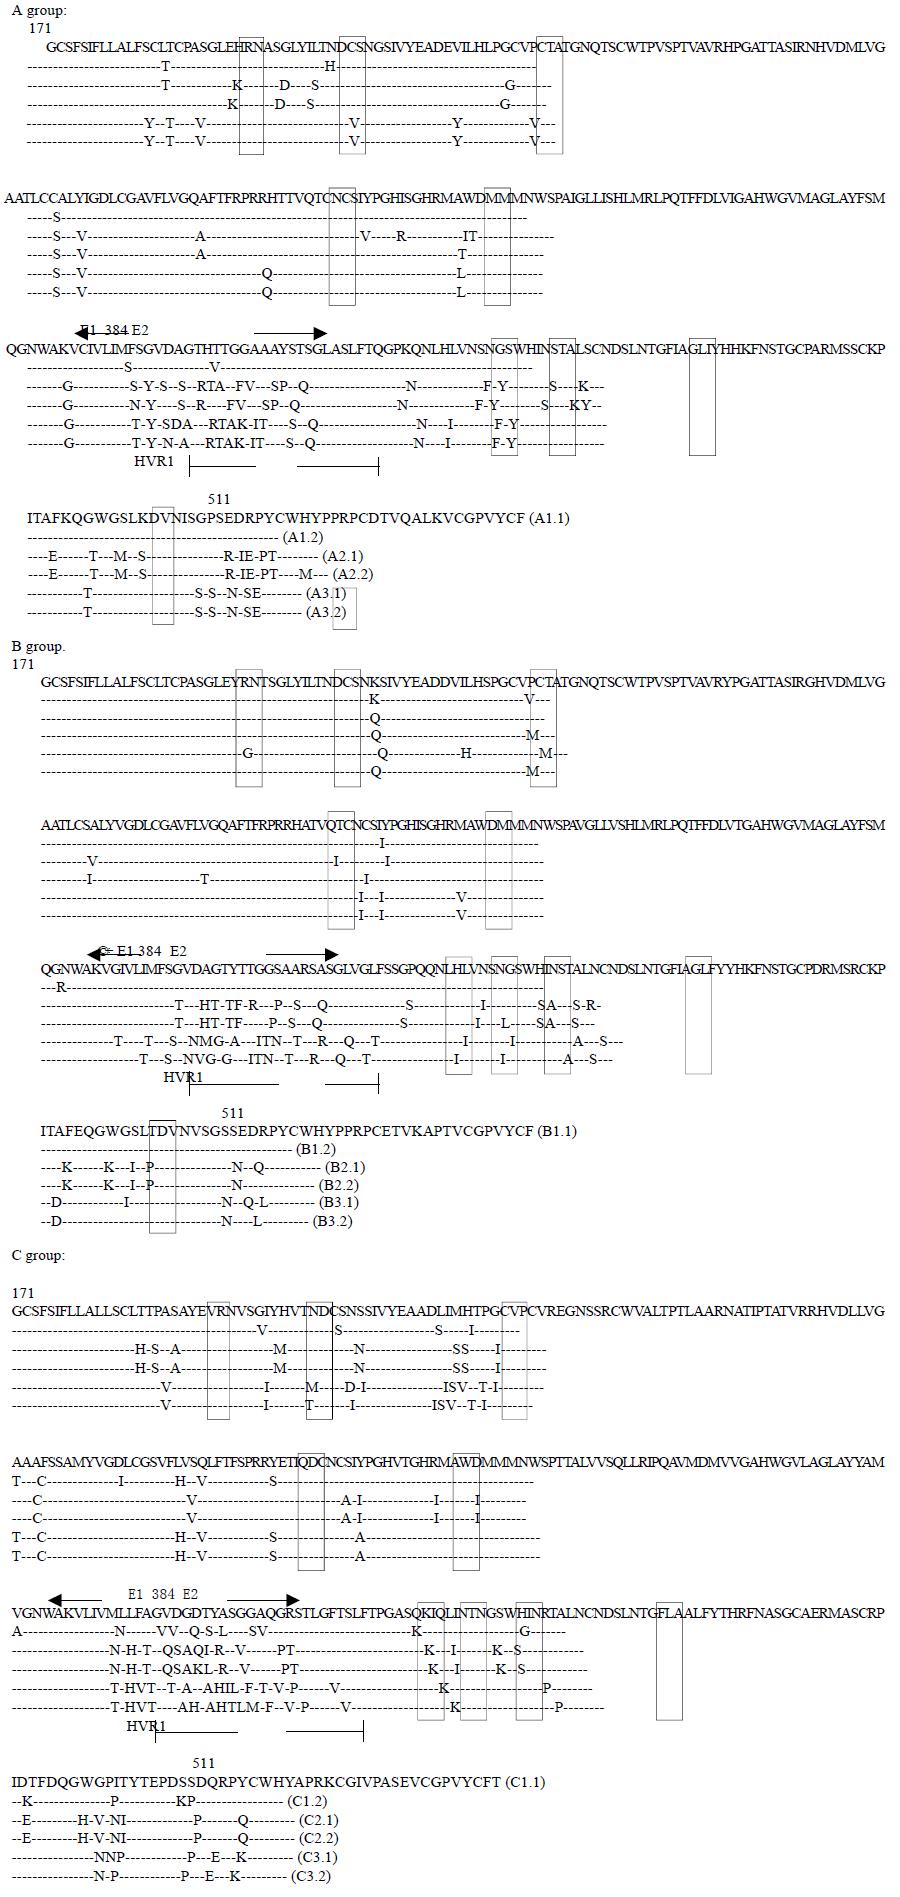
Figure 2 Alignment of inferred amino acid sequences for the majority clonotype and each clonotype from each subjects.
A, B: F at different time points. In the last column, an alphabetical label is given for each subject. Period indicate identity to the amino acid at that position in the first sequence. Position of the E1 and E2 region are in dicated above the alignment, whereas that of HVR1 is indicated below the alignment at the N terminus of E2. potential N-linked glycosylation site are boxed. For each subject, numbers indicate the different clones obtained.
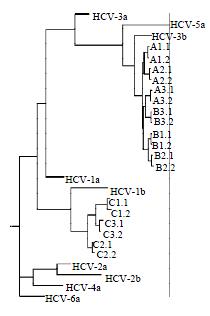
Figure 3 Unrooted tree showing the diversity of 372-nt E2/HVR1 sequences cloned from IDUs with HCV subtype 3b (A, B) and 1b (C).
Identifiers correspond to those in Table 1, followed by the timing of the specimen (as defined in Materials and Methods). Representative sequences obtained from the GenBank database are shown in bold type. The number and line at the bottom denote the proportion of nucleotides substituted for a given horizontal branch length. The dendrogram was producted using Neighor-joining program in the PHYLIP suite of programs.
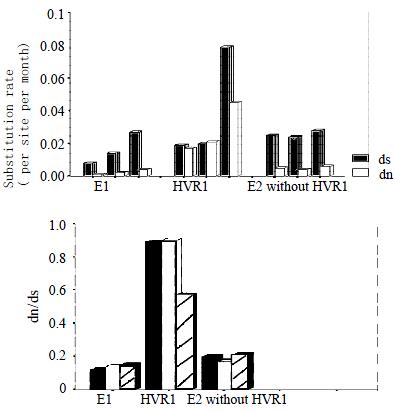
Figure 4 ds and dn, and dn/ds for acute-phase samples and persistent-phase samples from three individuals with HCV infection.
. In each panel, The individuals are presented in the order A, B.
- Citation: Chen S, Wang YM. Genetic evolution of structural region of hepatitis C virus in primary infection. World J Gastroenterol 2002; 8(4): 686-693
- URL: https://www.wjgnet.com/1007-9327/full/v8/i4/686.htm
- DOI: https://dx.doi.org/10.3748/wjg.v8.i4.686


