Copyright
©The Author(s) 2001.
World J Gastroenterol. Dec 15, 2001; 7(6): 836-840
Published online Dec 15, 2001. doi: 10.3748/wjg.v7.i6.836
Published online Dec 15, 2001. doi: 10.3748/wjg.v7.i6.836
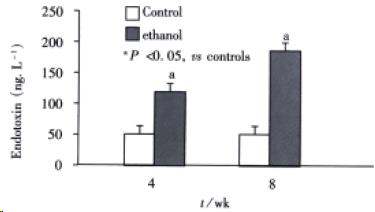
Figure 1 Chenges of endotoxin levels in two groups at different time points.
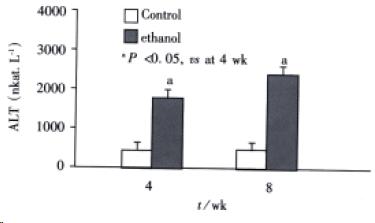
Figure 2 Changes of serum transaminase levels in two groups at different time points.
Figure 3 Liver section from rats (HE × 200) A: 4wk after ethanol liquid diet, steatosis and accumulation of blood cells in the sinusoidal lining; B: 8wk after ethanol diet, steatosis, cell infiltration and necrosis.
Figure 4 Ethanol-fed rats.
A: Steatosis degeneration and necrosis in hepatocytes TEM × 5000 B: Focal cytoplasmic degeneration and many myelin figures (TEM × 20000).
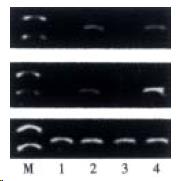
Figure 5 Expression of LBP and CD14 mRNA by RT-PCR analysis.
M: Marker; Lane 1, 3: Group C in 4, 8 wk respectively. Lane 2, 4: Group E in 4, 8 wk.
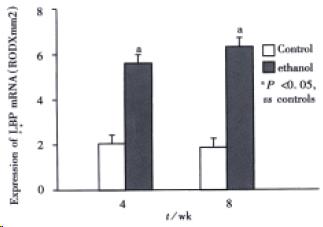
Figure 6 Expression of LBP mRNA.
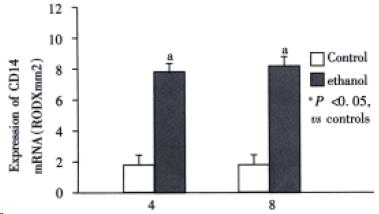
Figure 7 Expression of CD14 mRNA.
- Citation: Zuo GQ, Gong JP, Liu CA, Li SW, Wu XC, Yang K, Li Y. Expression of lipopolysaccharide binding protein and its receptor CD14 in experimental alcoholic liver disease. World J Gastroenterol 2001; 7(6): 836-840
- URL: https://www.wjgnet.com/1007-9327/full/v7/i6/836.htm
- DOI: https://dx.doi.org/10.3748/wjg.v7.i6.836


