Copyright
©The Author(s) 2001.
World J Gastroenterol. Jun 15, 2001; 7(3): 381-386
Published online Jun 15, 2001. doi: 10.3748/wjg.v7.i3.381
Published online Jun 15, 2001. doi: 10.3748/wjg.v7.i3.381
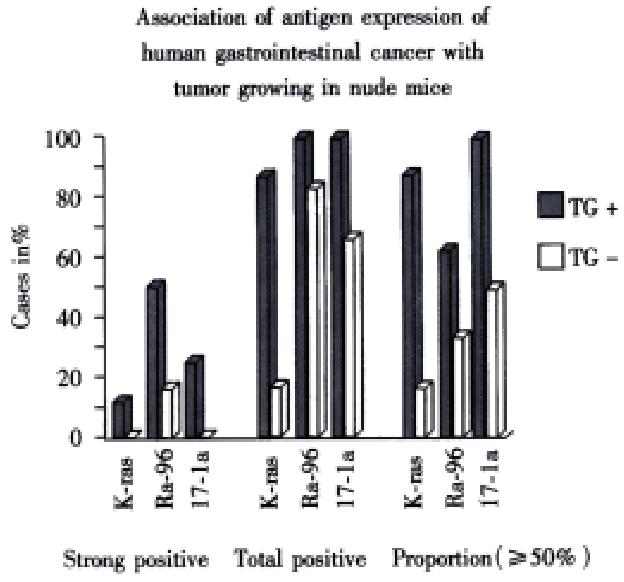
Figure 1 Ki-ras, Ra-96 and 17.
1a antigen expression of original tumors. Strong positive: with the positive intensity from "++" to "+++". Total positive: with the positive intensity from "+" to "+++". Proportion (≥ 50%): ≥ 50% of tumor cells in the section with positive staining. TG + (n = 8): = with tumor growth. TG - (n = 6): = without tumor growth
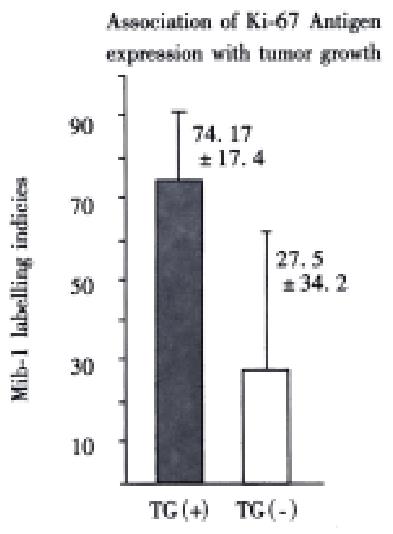
Figure 2 Ki-67 antigen expression of original tumors.
TG (+): 74.2 ± 17.4 (n = 9). TG (-): 27.5 ± 34.2 (n = 7) (P < 0.005)
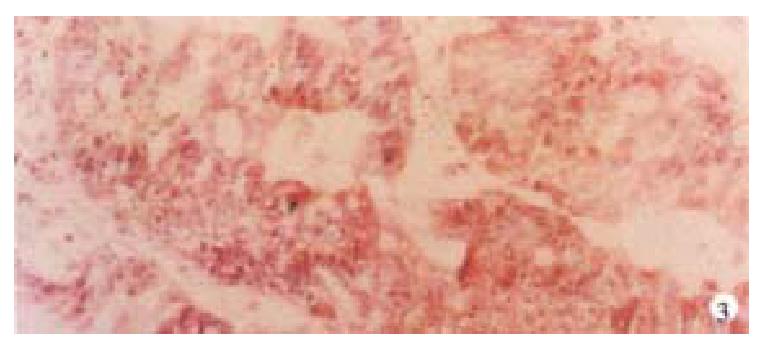
Figure 3 Human colon cancer.
HE × 20
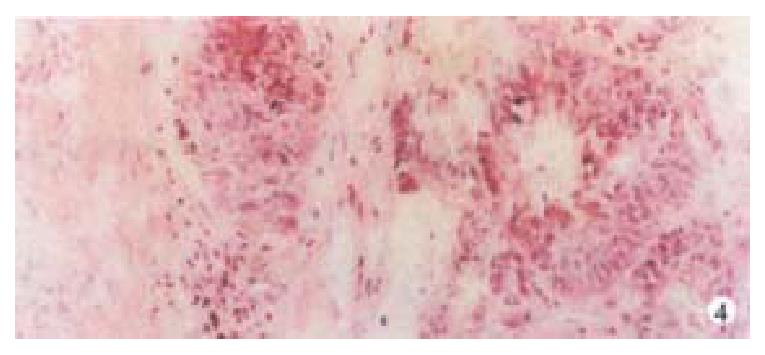
Figure 4 transplanted orthotopic cancer.
HE × 20
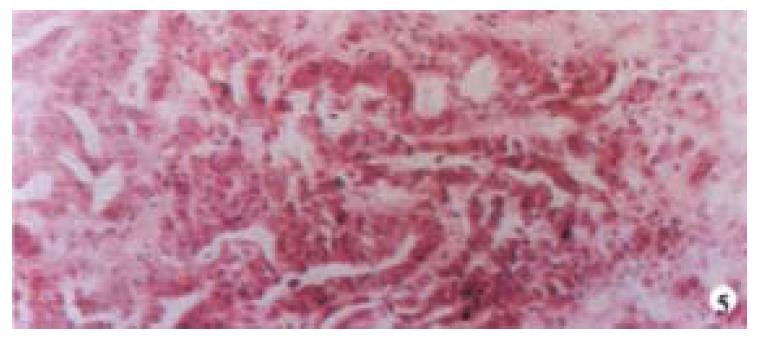
Figure 5 Human pancreatic cancer.
HE × 20
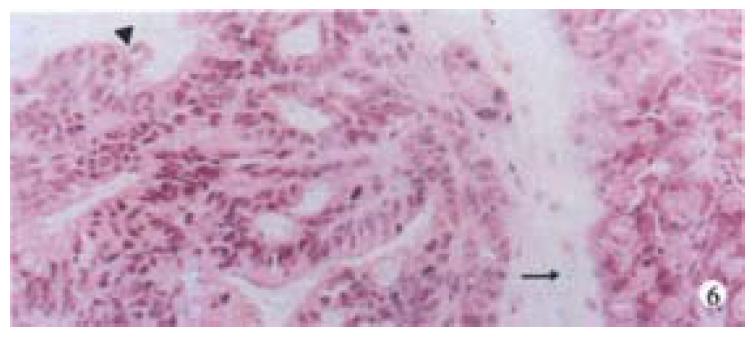
Figure 6 Transplanted orthotopic pancreatic cancer.
HE × 20
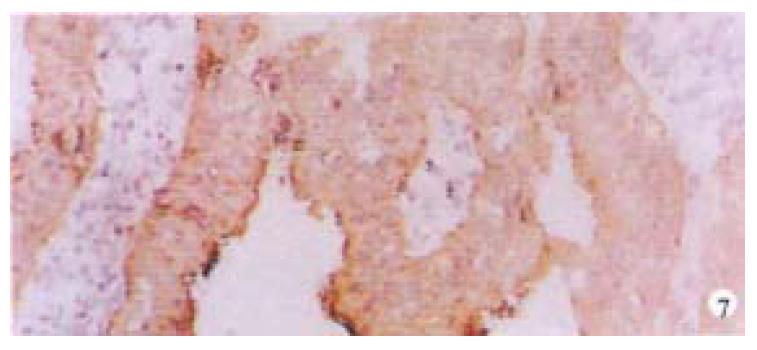
Figure 7 CEA expression of human colon cancer, with immunostaining.
× 20
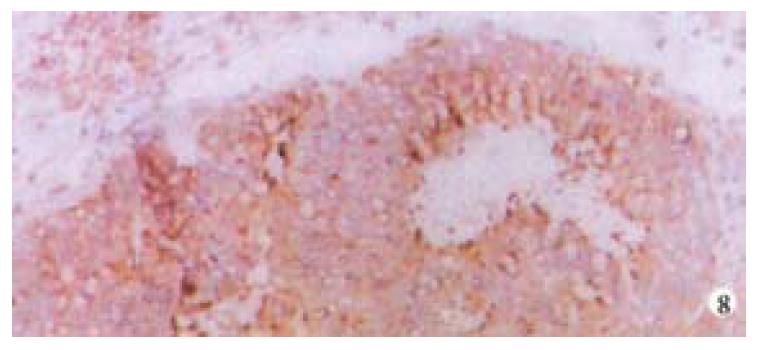
Figure 8 CEA expression of transplanted orthotopic colon cancer, with immunostaining.
× 20
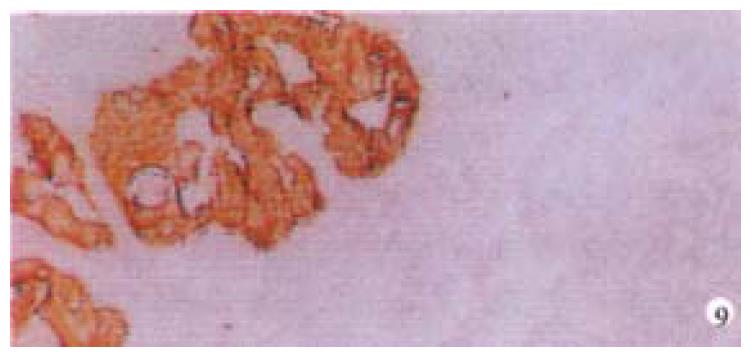
Figure 9 Transplanted orthotopic colon cancer, with immunostaining staining.
× 20
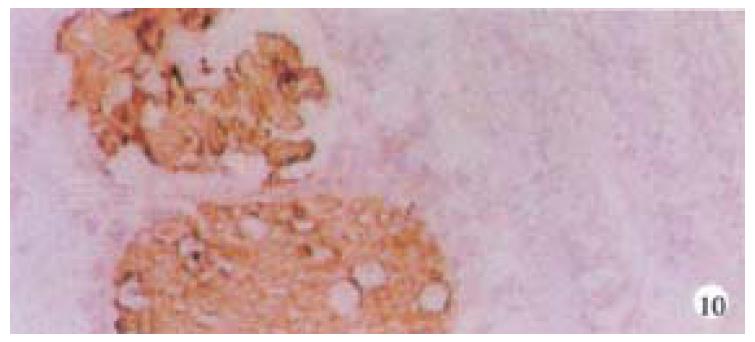
Figure 10 Metastatic colon cancer in the lung of nude mouse, with immunostaining.
× 20
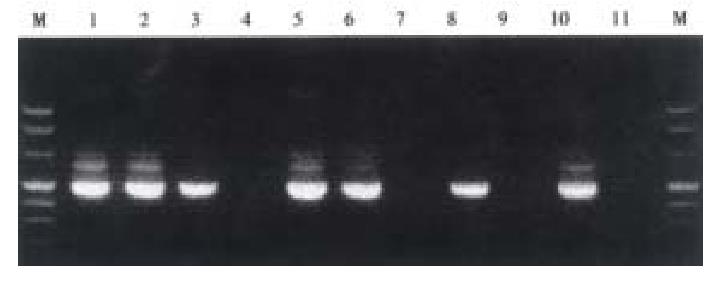
Figure 11 Specimens of 2 μg total RNA were subjected to CK-20 specific RT-PCR (485 bp product).
M. DNA molecular marker; 1: sc tumor (case A); 2: Orthotopic tumor (case A); 3: Liver (case A); 4: Lung (case A); 5: sc tumor (case B); 6: Orthotopic tumor (case B); 7: Liver (case B); 8: Lung (case B); 9: H2O; 10: A818.4 cell line (50 μg·L-1); 11: A818.4 cell line (50 μg·L-1) without reverse transcriptase.
- Citation: Cui JH, Krueger U, Henne-Bruns D, Kremer B, Kalthoff H. Orthotopic transplantation model of human gastrointestinal cancer and detection of micrometastases. World J Gastroenterol 2001; 7(3): 381-386
- URL: https://www.wjgnet.com/1007-9327/full/v7/i3/381.htm
- DOI: https://dx.doi.org/10.3748/wjg.v7.i3.381


