
















Copyright: ©Author(s) 2027.
World J Gastroenterol. Jan 14, 2027; 33(2): 127120
Published online Jan 14, 2027. doi: 10.3748/wjg.127120
Published online Jan 14, 2027. doi: 10.3748/wjg.127120
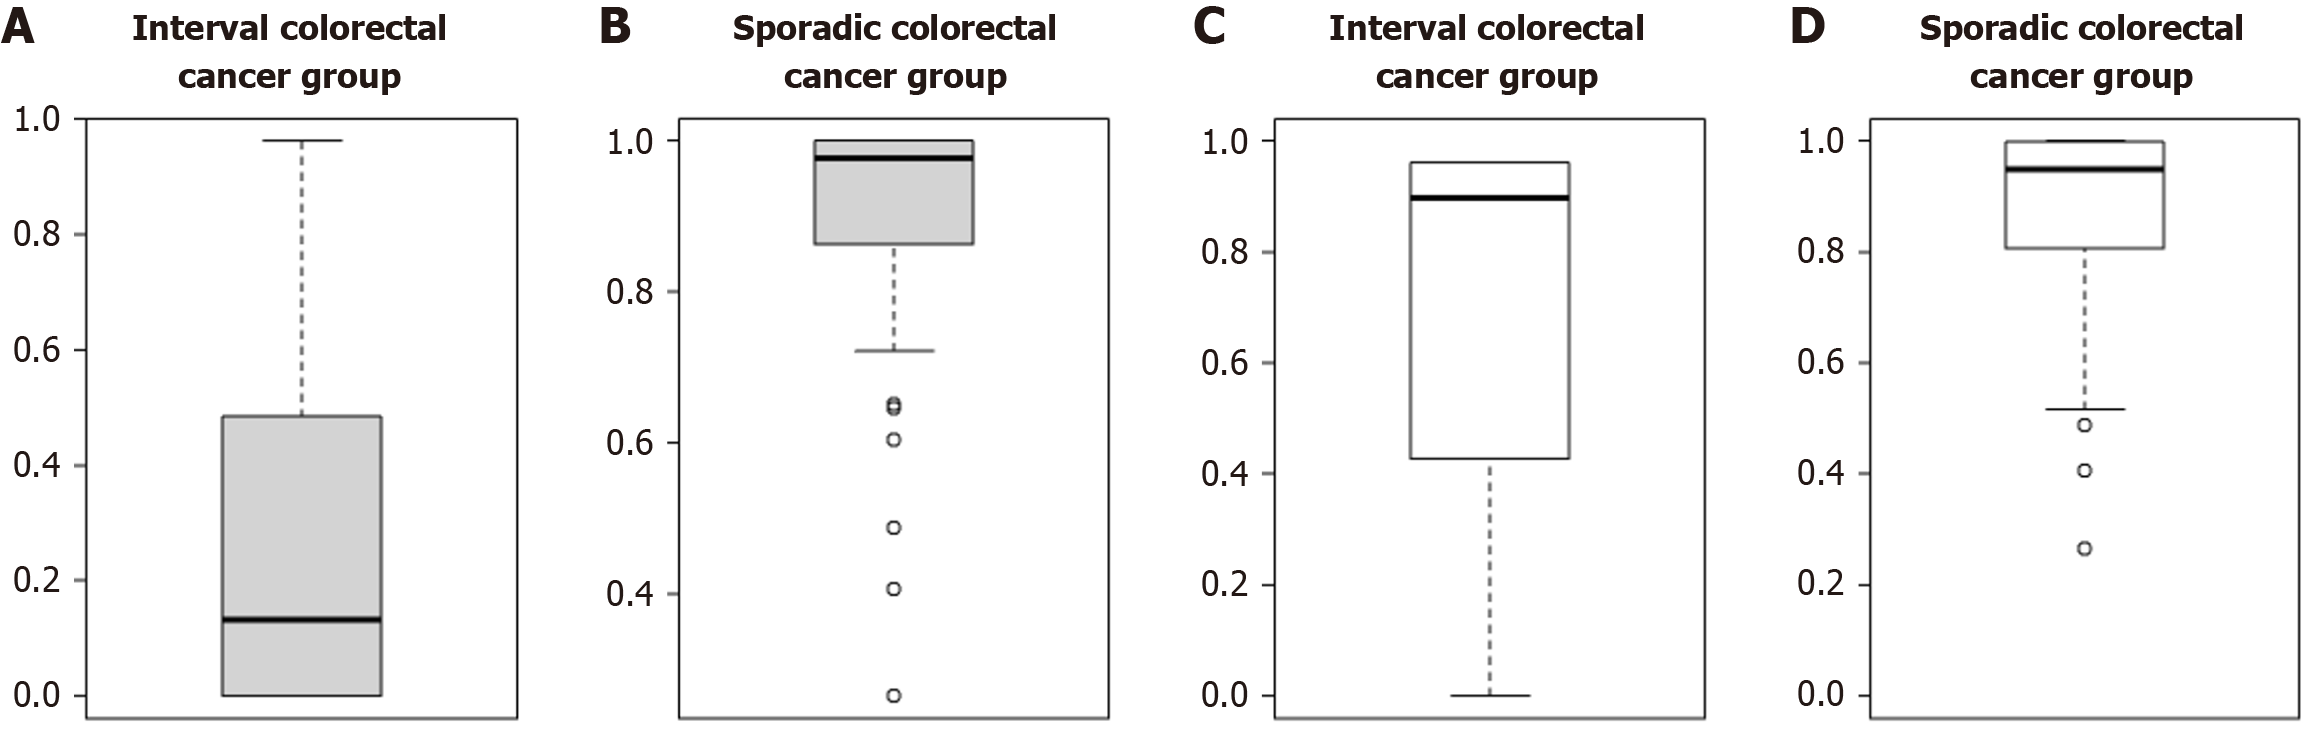
Figure 1 Box plots of the differences in variables between the interval and sporadic colorectal cancer groups before and after propensity score weighting.
A: Interval colorectal cancer group before propensity score weighting (PSW); B: Sporadic colorectal cancer group before PSW; C: Interval colorectal cancer group after PSW; D: Sporadic colorectal cancer group after PSW. Box-and-whisker plot: First quartile (Q1 or 25th percentile), the bottom line in the box; Median (Q2 or 50th percentile), the middle line in the box; Third quartile (Q3 or 75th percentile), the top line in the box. The whiskers represent the minimum and maximum observations.
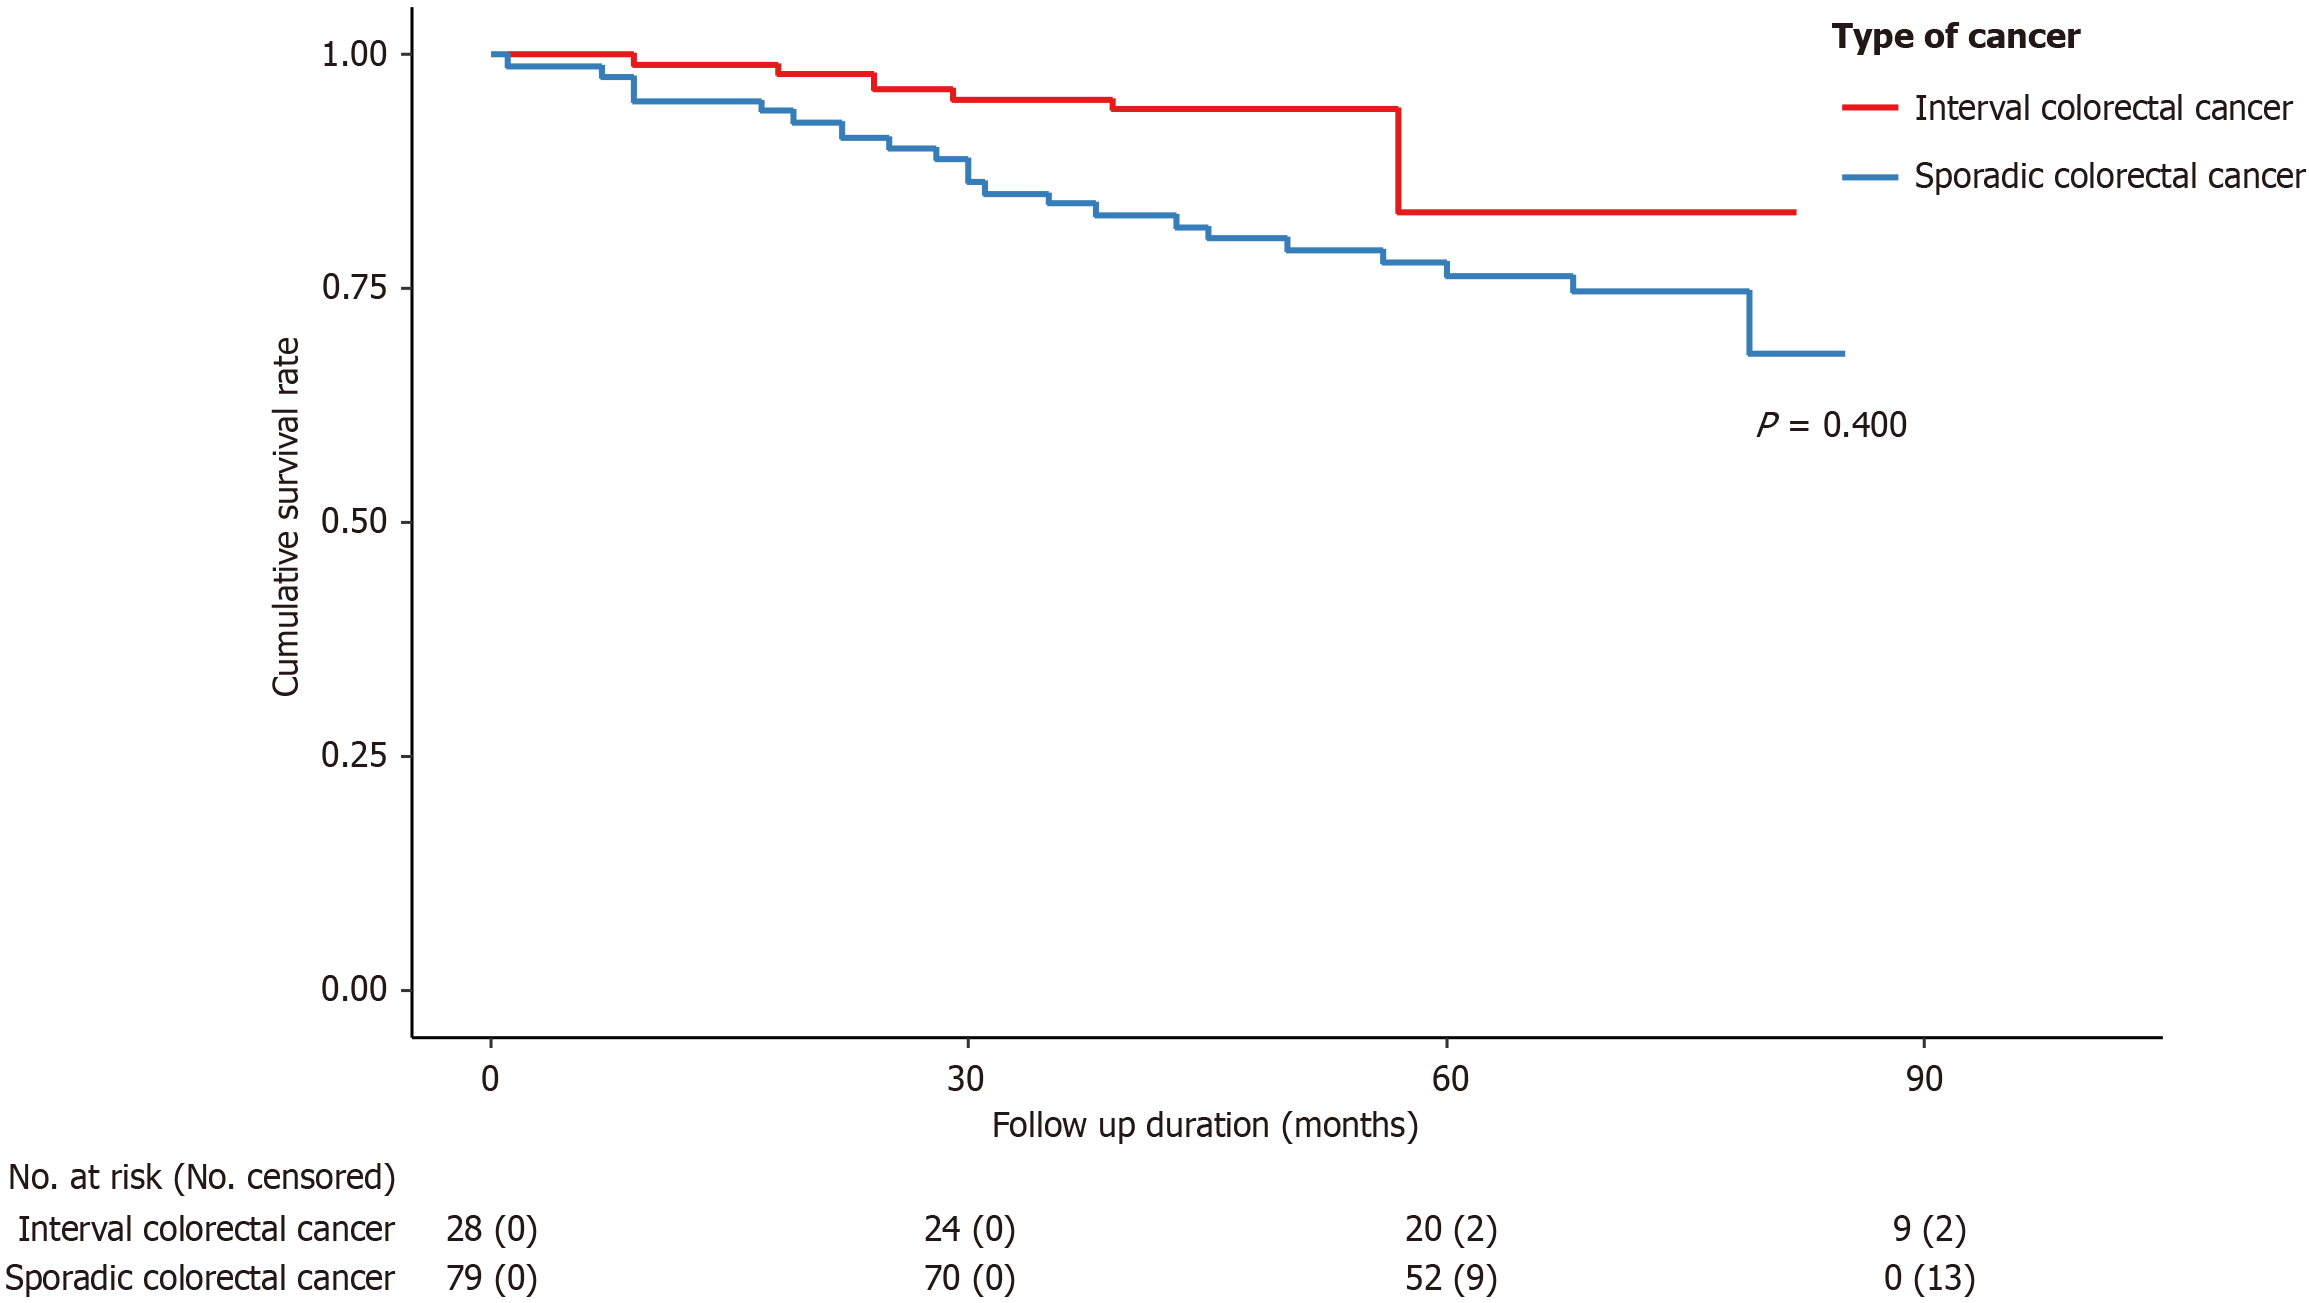
Figure 2
Cumulative survival rates in patients with interval colorectal cancer and sporadic colorectal cancer.
- Citation: Song JH, Shin JE, Kim DS, Lee YJ, Yang HC, Kim KO, Kim JH, Kang GH, Shim SR, Huh KC. Clinicopathologic and biomolecular features of interval colorectal cancers in Korean patients: A KASID multicenter prospective study. World J Gastroenterol 2027; 33(2): 127120
- URL: https://www.wjgnet.com/1007-9327/full/v33/i2/127120.htm
- DOI: https://dx.doi.org/10.3748/wjg.127120