
















Copyright: ©Author(s) 2027.
World J Gastroenterol. Jan 14, 2027; 33(2): 125781
Published online Jan 14, 2027. doi: 10.3748/wjg.125781
Published online Jan 14, 2027. doi: 10.3748/wjg.125781
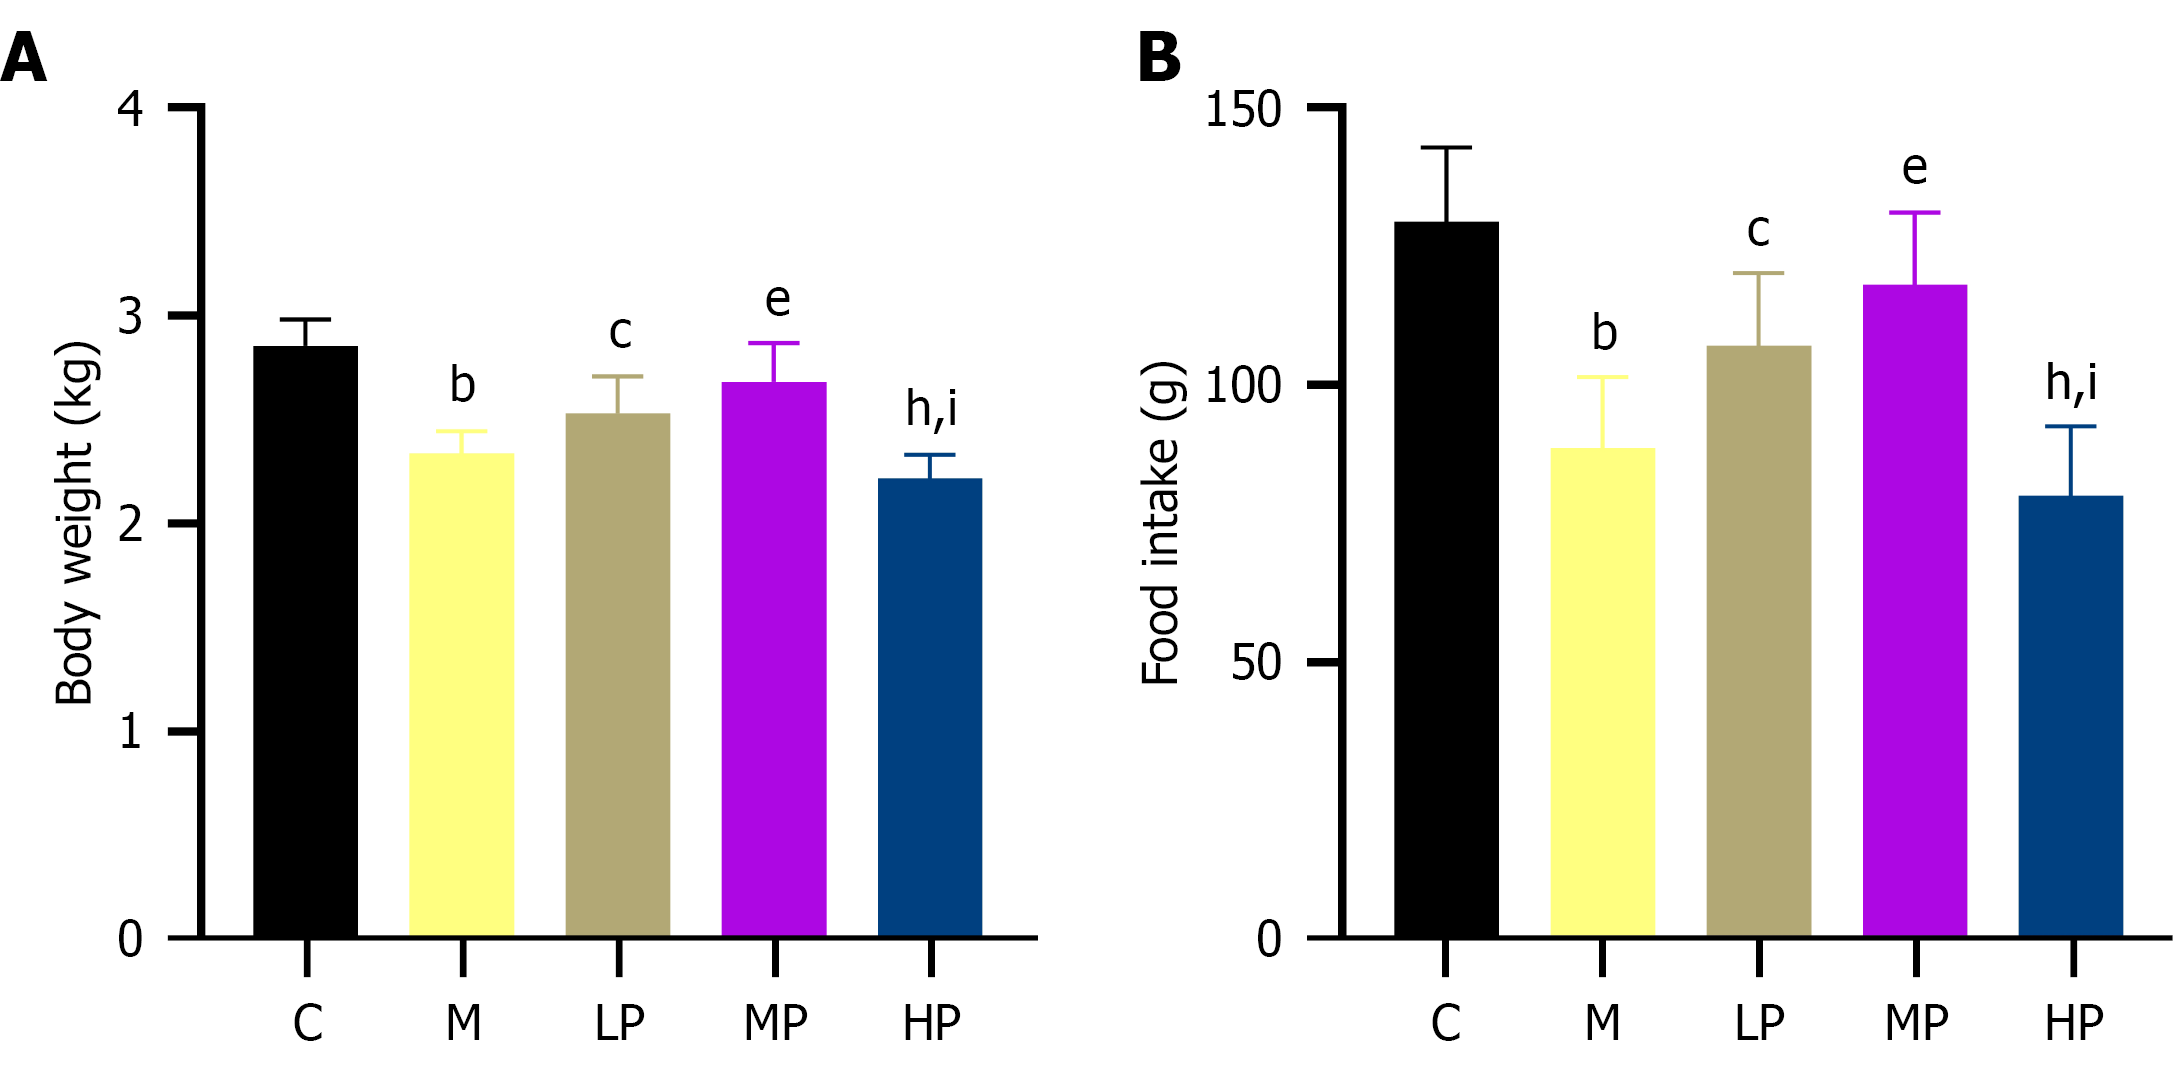
Figure 1 Effect of massage on body weight and food intake in rabbits with functional dyspepsia (n = 10).
Data are expressed as mean ± SD. bP < 0.001 vs the control group; cP < 0.05 vs the model group; eP < 0.001 vs the model group; hP < 0.001 vs the light-pressure group; iP < 0.001 vs the medium-pressure group. A: Body weight; B: Food intake. C: The control group; M: The model group; LP: The light-pressure group; MP: The medium-pressure group; HP: The heavy-pressure group.
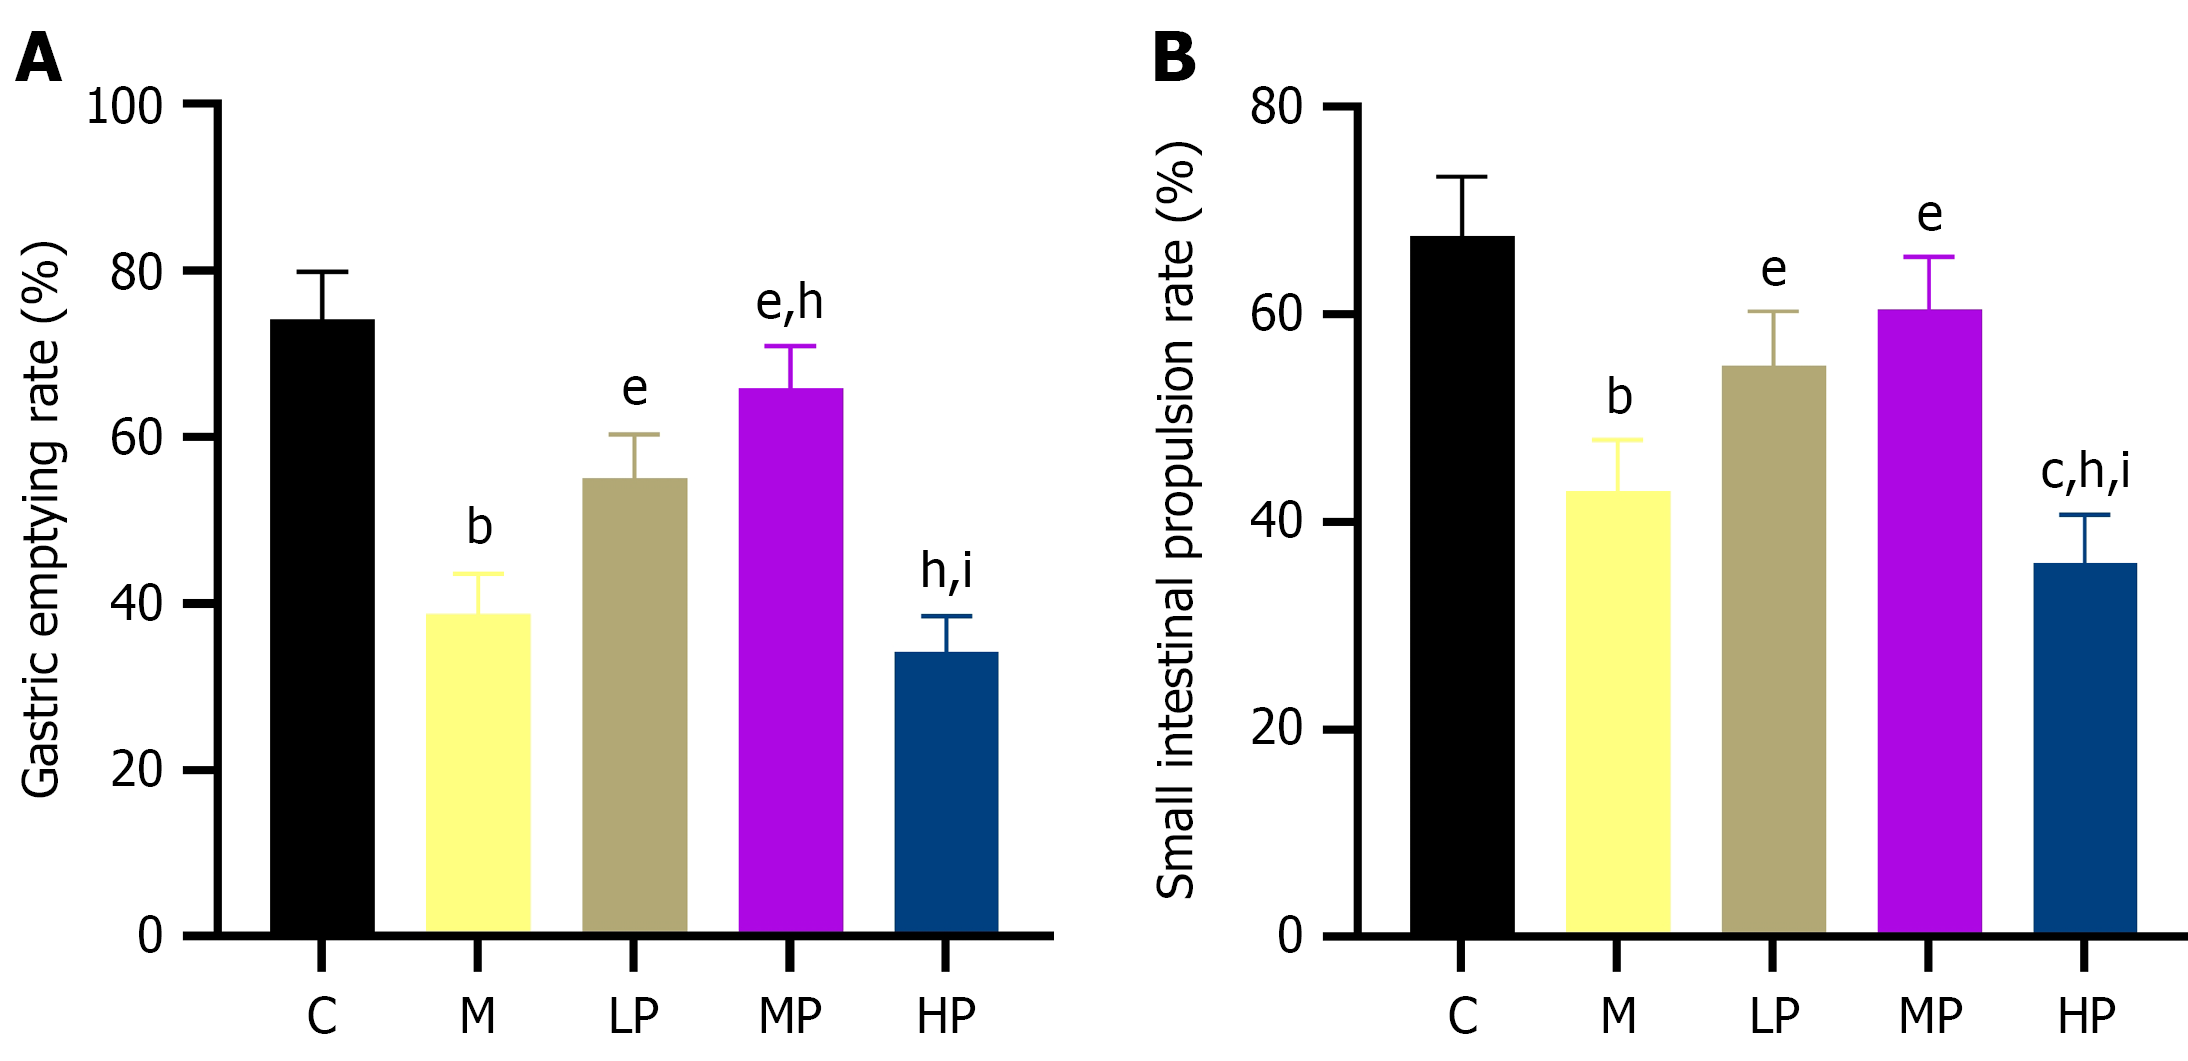
Figure 2 Effect of massage on gastric emptying and small intestinal propulsion in rabbits with functional dyspepsia (n = 10).
bP < 0.001 vs the control group; cP < 0.05 vs the model group; eP < 0.001 vs the model group; hP < 0.001 vs the light-pressure group; iP < 0.001 vs the medium-pressure group. A: Gastric emptying rate; B: Small intestinal propulsion rate. C: The control group; M: The model group; LP: The light-pressure group; MP: The medium-pressure group; HP: The heavy-pressure group.
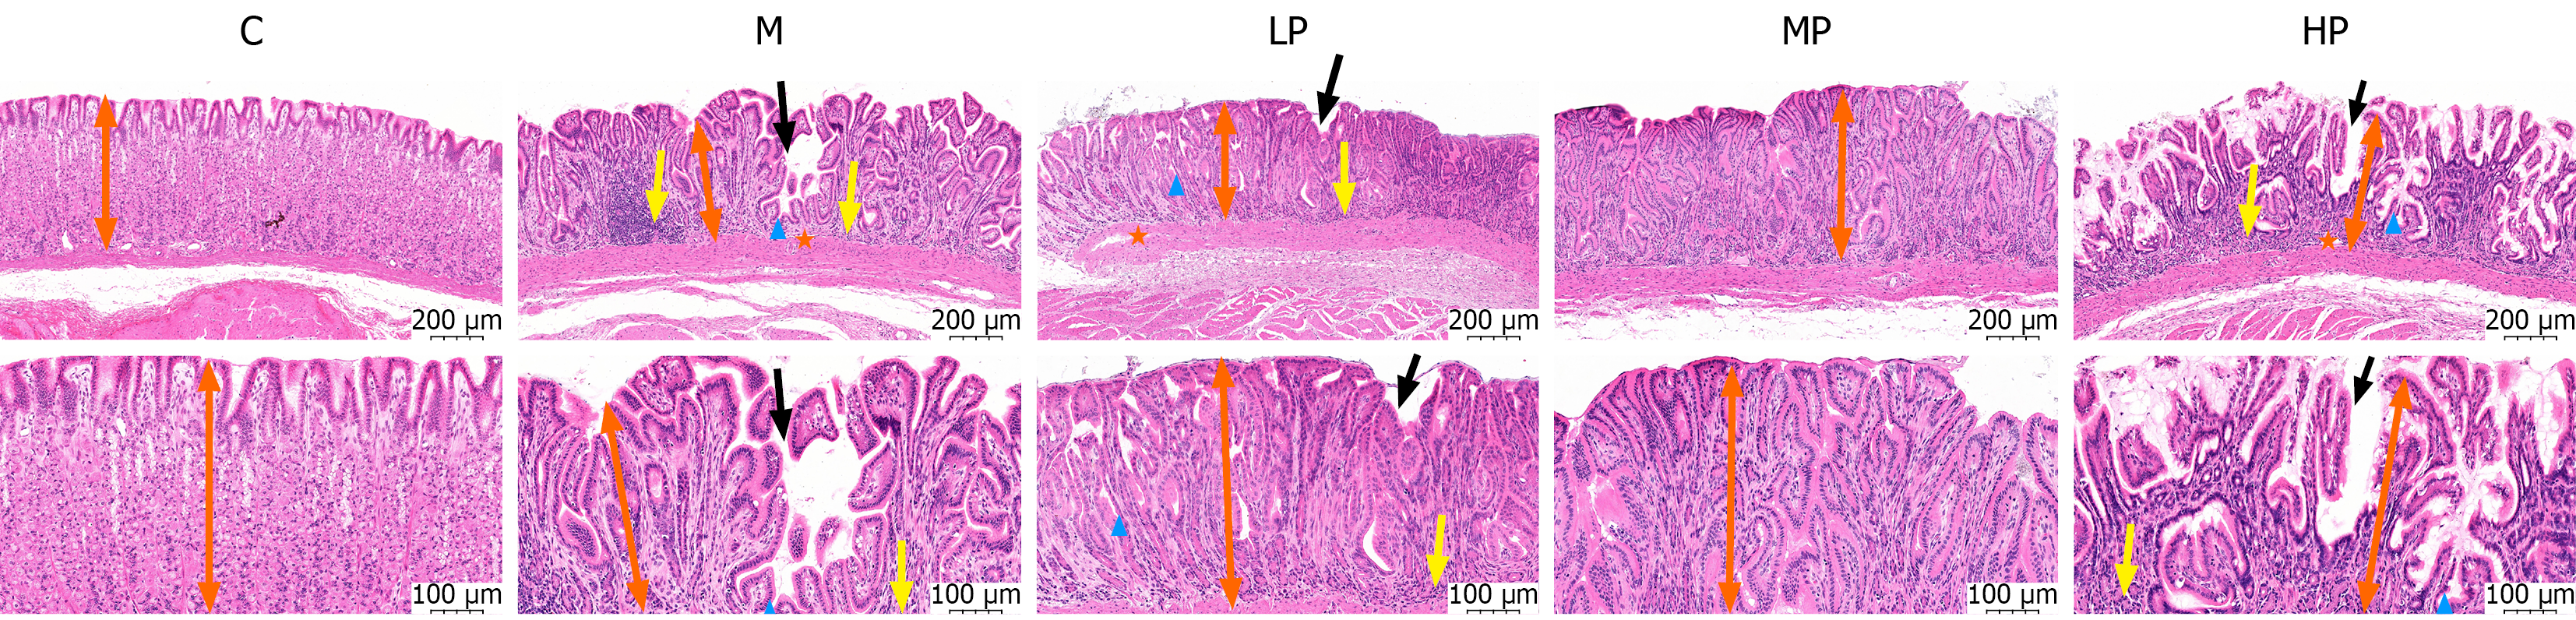
Figure 3 Effect of massage on gastric antral histopathology in rabbits with functional dyspepsia (hematoxylin and eosin staining, n = 6).
Representative photomicrographs are shown at original magnifications of × 200 (upper row; scale bar, 200 μm) and × 400 (lower row; scale bar, 100 μm). Black arrows indicate surface epithelial exfoliation or discontinuity; yellow arrows indicate inflammatory infiltration in the lamina propria; orange asterisks indicate interstitial edema; blue arrowheads indicate distorted gastric pits. Orange double-headed arrows indicate gastric antral mucosal thickness. C: The control group; M: The model group; LP: The light-pressure group; MP: The medium-pressure group; HP: The heavy-pressure group.
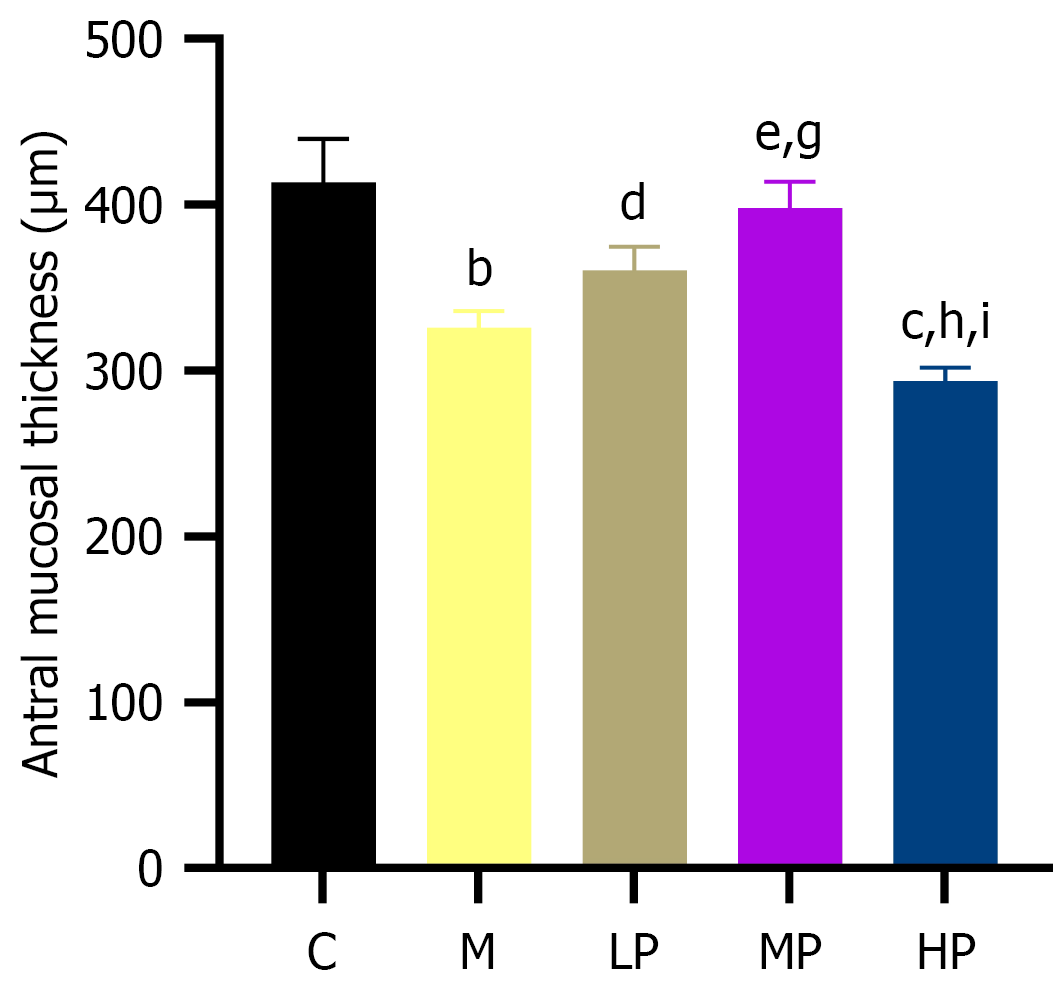
Figure 4 Effect of massage on antral mucosal thickness in rabbits with functional dyspepsia (n = 6).
bP < 0.001 vs the control group; cP < 0.05 vs the model group; dP < 0.01 vs the model group; eP < 0.001 vs the model group; gP < 0.01 vs the light-pressure group; hP < 0.001 vs the light-pressure group; iP < 0.001 vs the medium-pressure group. C: The control group; M: The model group; LP: The light-pressure group; MP: The medium-pressure group; HP: The heavy-pressure group.
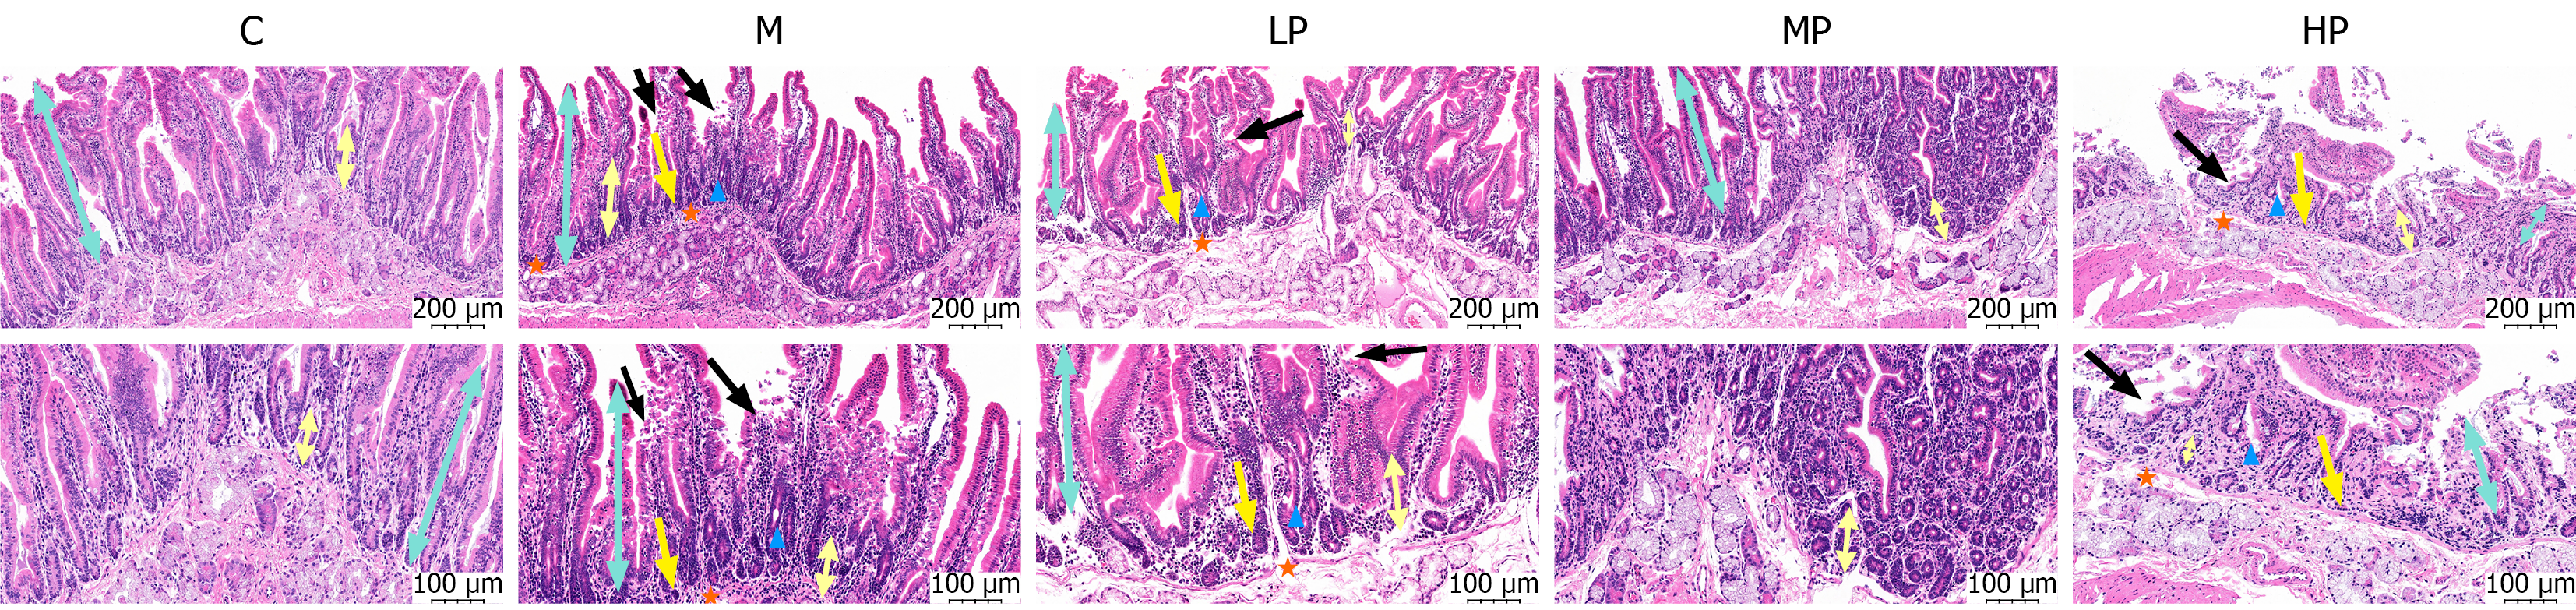
Figure 5 Effect of massage on duodenal histopathology in rabbits with functional dyspepsia (hematoxylin and eosin staining, n = 6).
Representative photomicrographs are shown at original magnifications of × 200 (upper row; scale bar, 200 μm) and × 400 (lower row; scale bar, 100 μm). Black arrows indicate epithelial shedding or discontinuity; yellow arrows indicate inflammatory cell infiltration in the lamina propria; orange asterisks indicate submucosal edema; blue arrowheads indicate crypt disruption. Cornflower-blue double-headed arrows indicate villus height, and chocolate-yellow solid double-headed arrows indicate crypt depth. C: The control group; M: The model group; LP: The light-pressure group; MP: The medium-pressure group; HP: The heavy-pressure group.
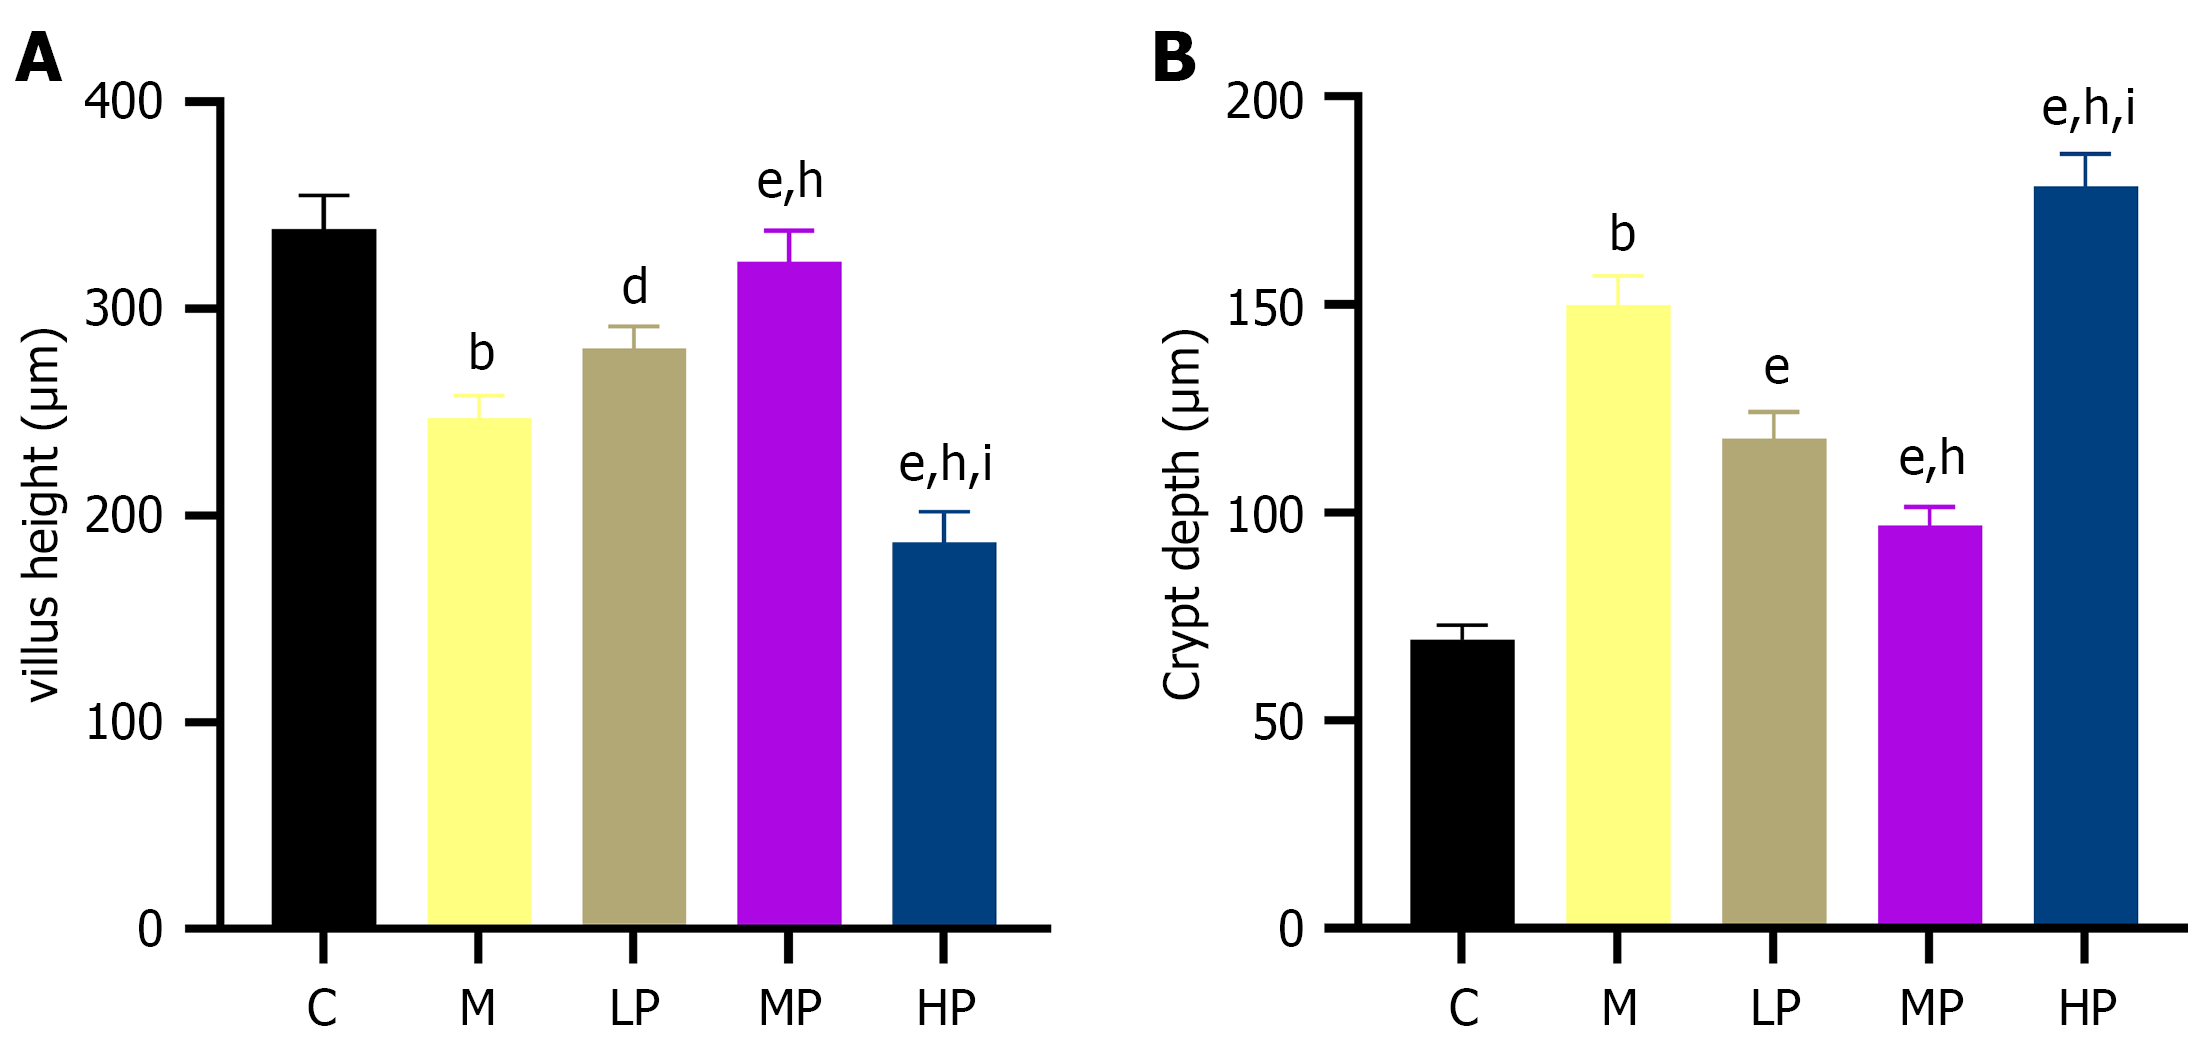
Figure 6 Effect of massage on villus height and crypt depth in rabbits with functional dyspepsia (n = 6).
bP < 0.001 vs the control group; dP < 0.01 vs the model group; eP < 0.001 vs the model group; hP < 0.001 vs the light-pressure group; iP < 0.001 vs the medium-pressure group. A: Villus height; B: Crypt depth. C: The control group; M: The model group; LP: The light-pressure group; MP: The medium-pressure group; HP: The heavy-pressure group.
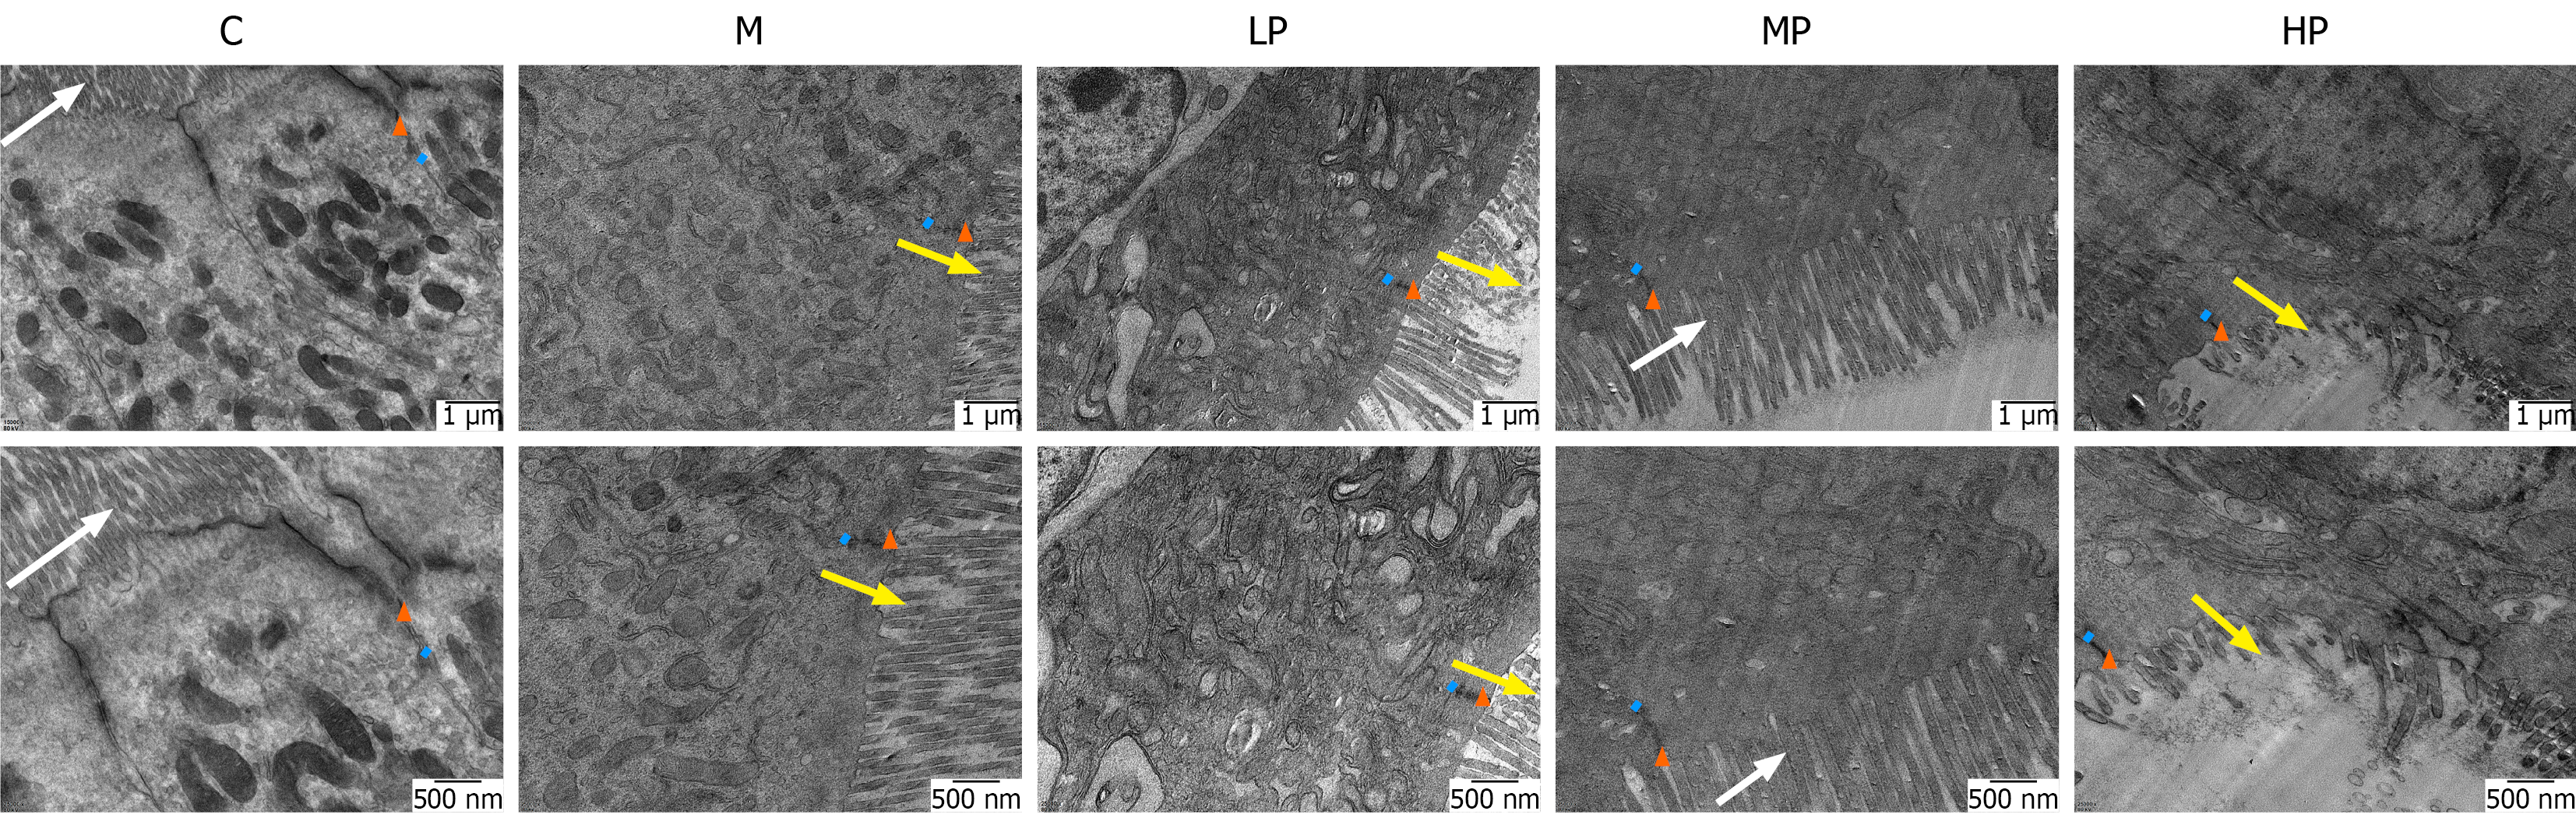
Figure 7 Effect of massage on duodenal epithelial ultrastructure in rabbits with functional dyspepsia (n = 3).
Representative transmission electron microscope images are shown at original magnifications of × 15000 (upper row; scale bar, 1 μm) and × 25000 (lower row; scale bar, 500 nm). White arrows indicate intact, densely arranged microvilli; yellow arrows indicate detached, disorganized, or sparse damaged microvilli; orange triangles indicate tight junctions. Light-blue short lines indicate the intercellular space width. C: The control group; M: The model group; LP: The light-pressure group; MP: The medium-pressure group; HP: The heavy-pressure group.
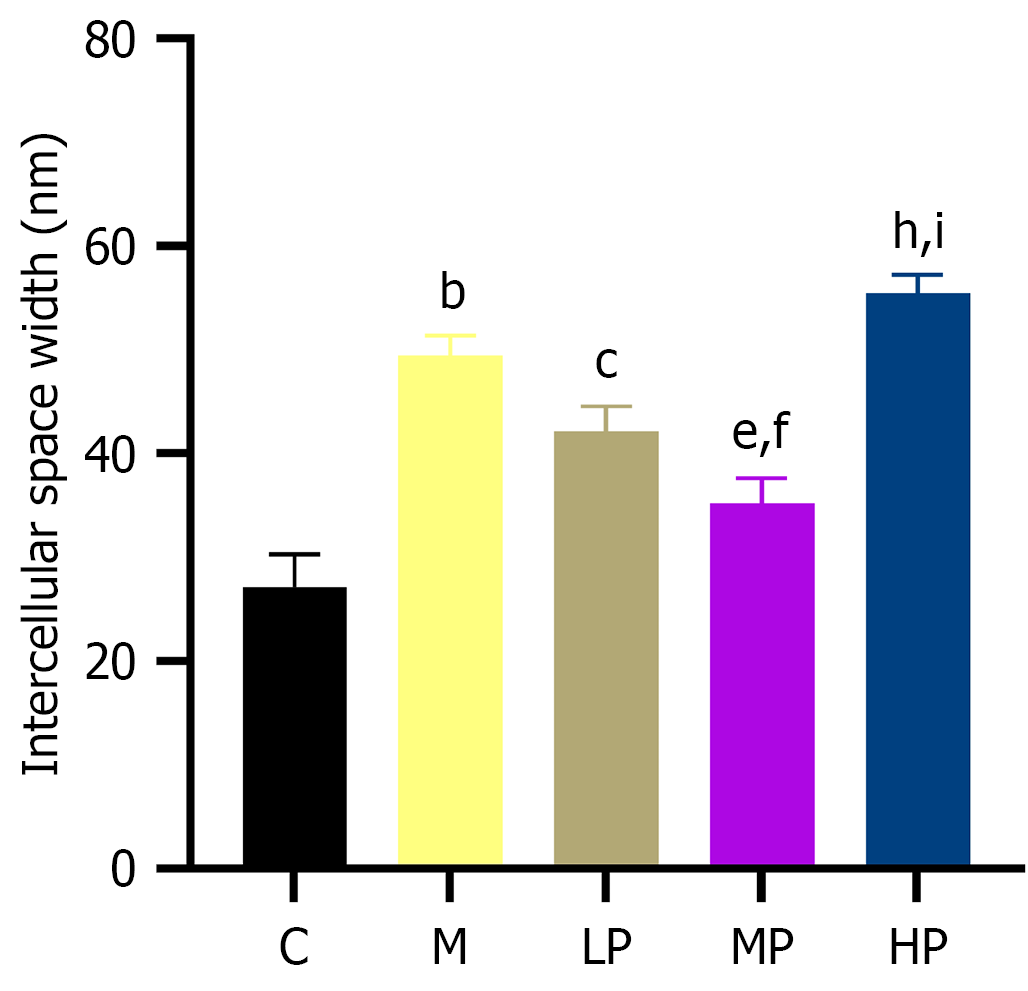
Figure 8 Effect of massage on intercellular space width in rabbits with functional dyspepsia (n = 3).
bP < 0.001 vs the control group; cP < 0.05 vs the model group; eP < 0.001 vs the model group; fP < 0.05, vs the light-pressure group; hP < 0.001 vs the light-pressure group; iP < 0.001 vs the medium-pressure group. C: The control group; M: The model group; LP: The light-pressure group; MP: The medium-pressure group; HP: The heavy-pressure group.
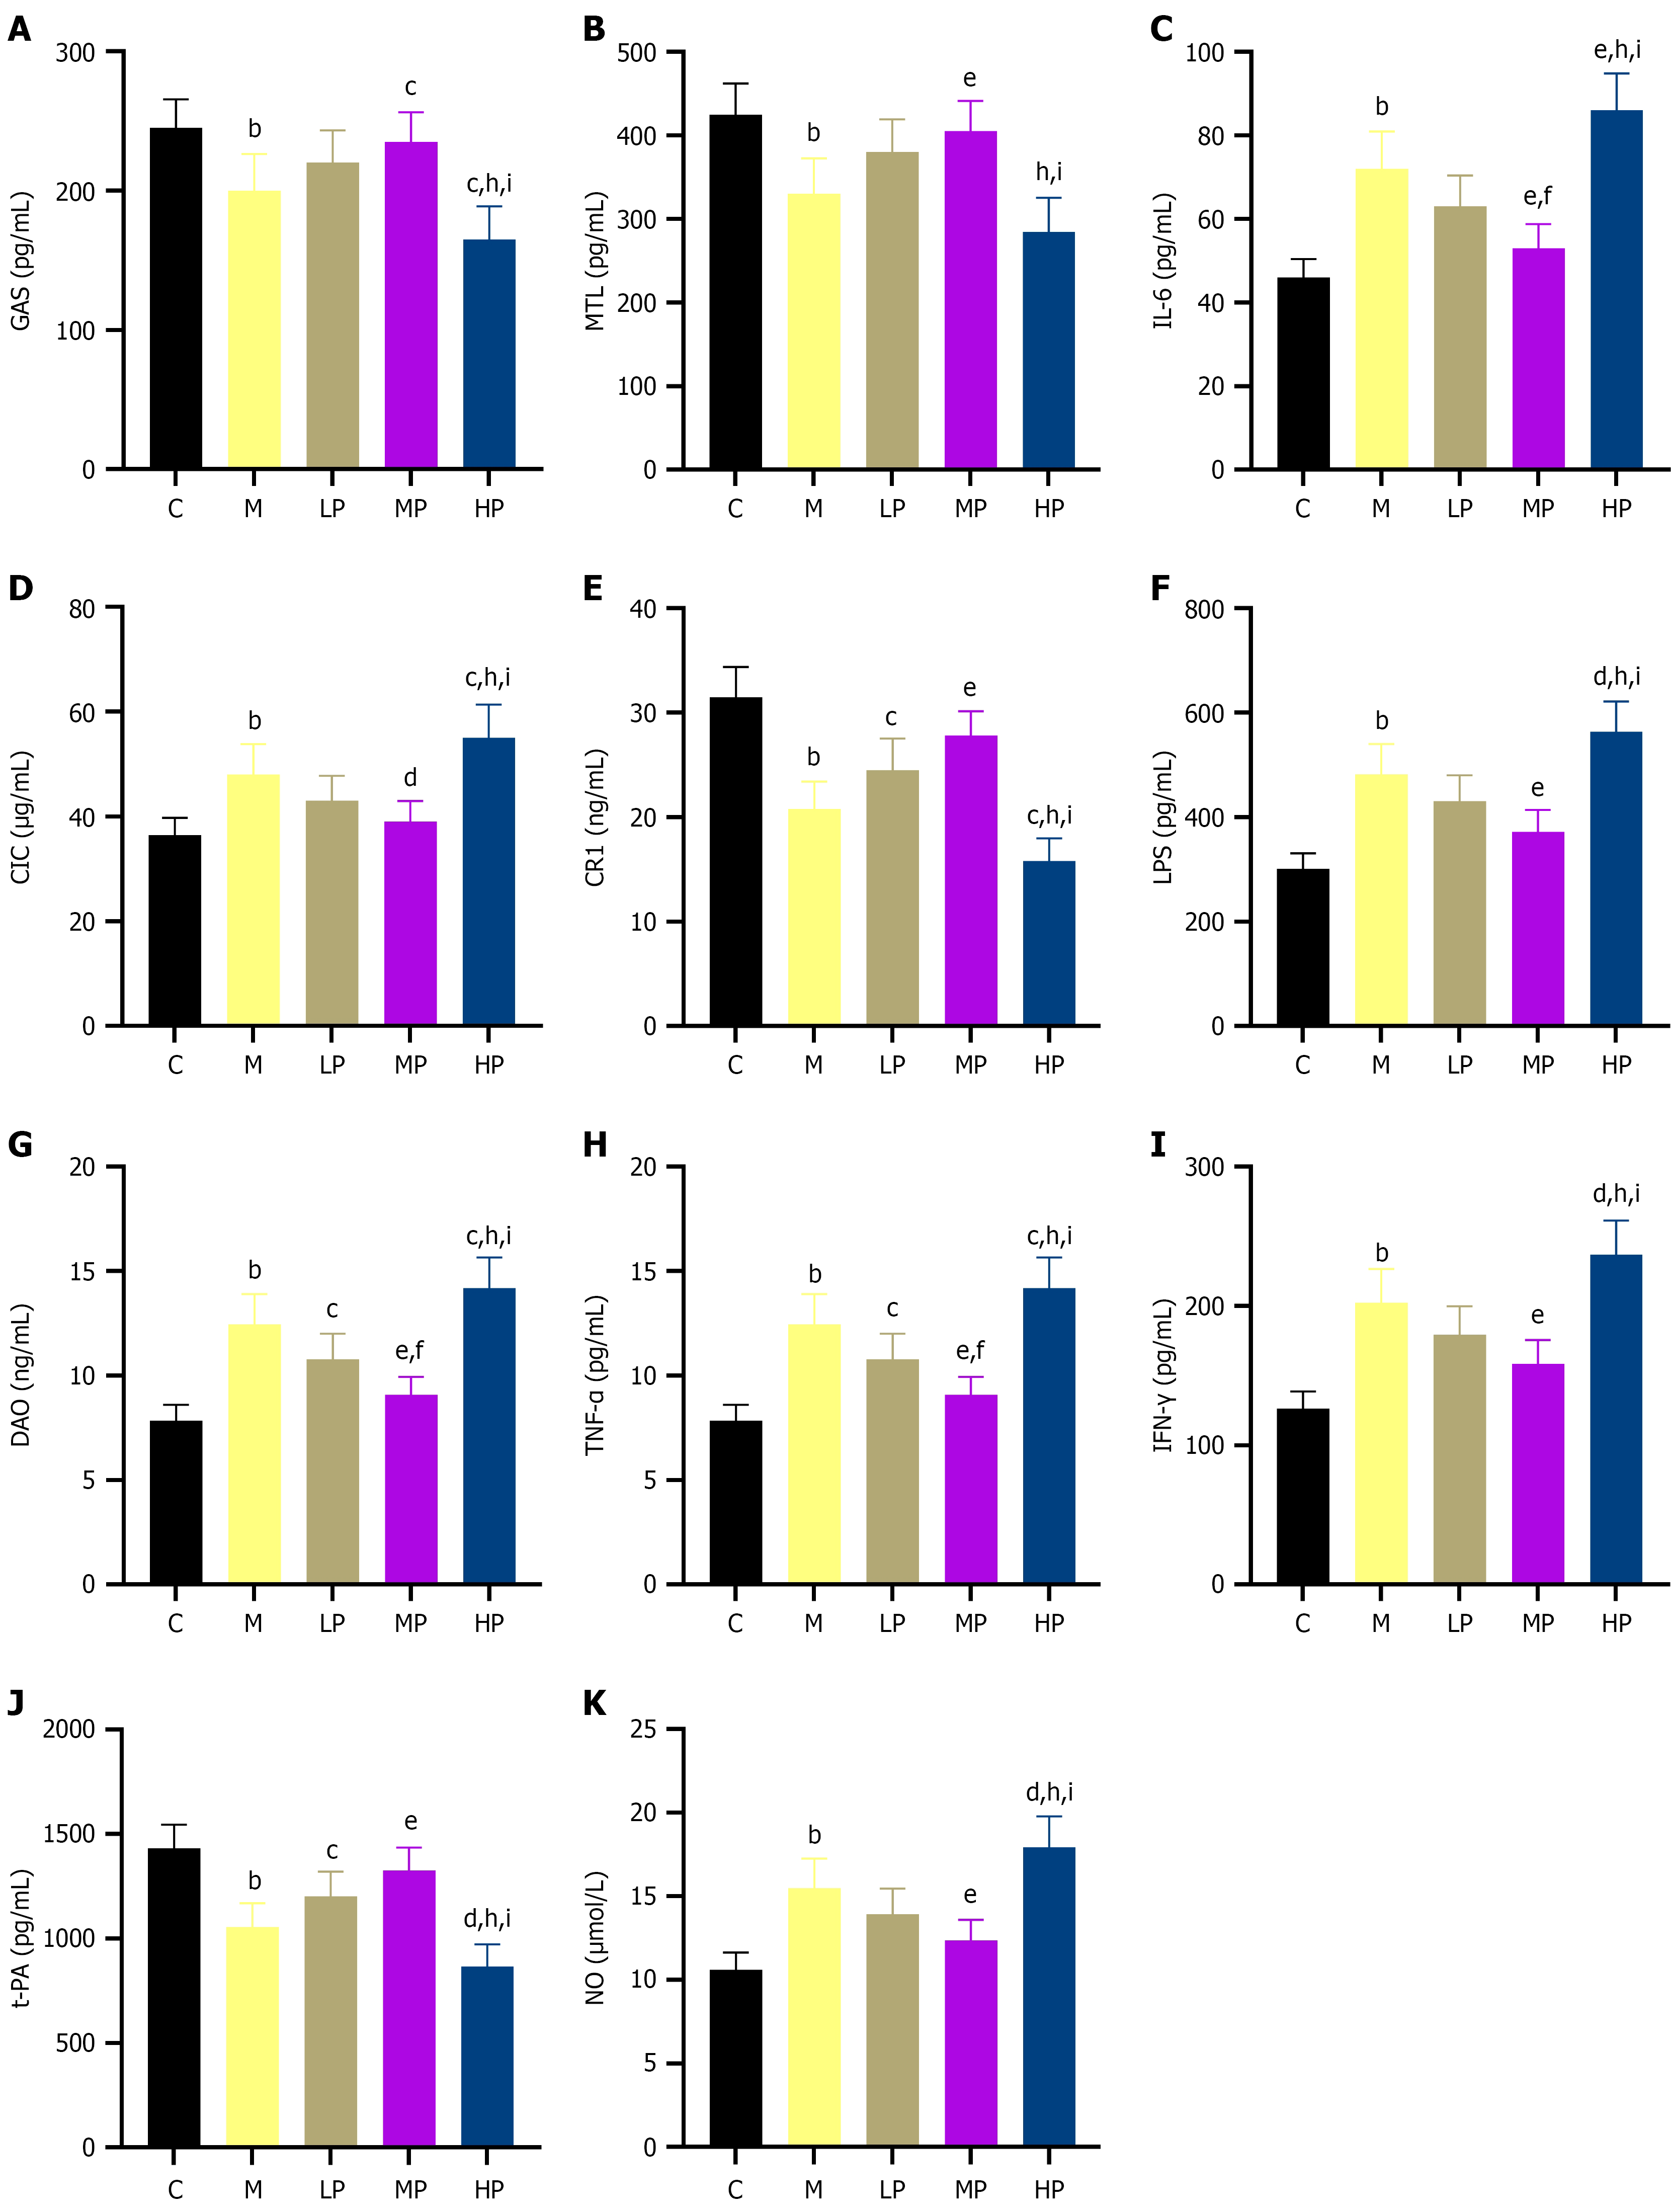
Figure 9 Effect of massage on serum gastrointestinal hormones, inflammatory cytokines, intestinal barrier injury markers, and immune markers in rabbits with functional dyspepsia (n = 10).
bP < 0.001 vs the control group; cP < 0.05 vs the model group; dP < 0.01 vs the model group; eP < 0.001 vs the model group; fP < 0.05, vs the light-pressure group; hP < 0.001 vs the light-pressure group; iP < 0.001 vs the medium-pressure group. A: Gastrin; B: Motilin; C: Interleukin-6; D: Circulating immune complex; E: Complement receptor 1; F: Lipopolysaccharide; G: Diamine oxidase; H: Tumor necrosis factor-alpha; I: Interferon-gamma; J: Tissue plasminogen activator; K: Nitric oxide. GAS: Gastrin; MTL: Motilin; IL-6: Interleukin-6; CIC: Circulating immune complex; CR1: Complement receptor 1; LPS: Lipopolysaccharide; DAO: Diamine oxidase; TNF-α: Tumor necrosis factor-alpha; IFN-γ: Interferon-gamma; T-PA: Tissue plasminogen activator; NO: Nitric oxide; C: The control group; M: The model group; LP: The light-pressure group; MP: The medium-pressure group; HP: The heavy-pressure group.
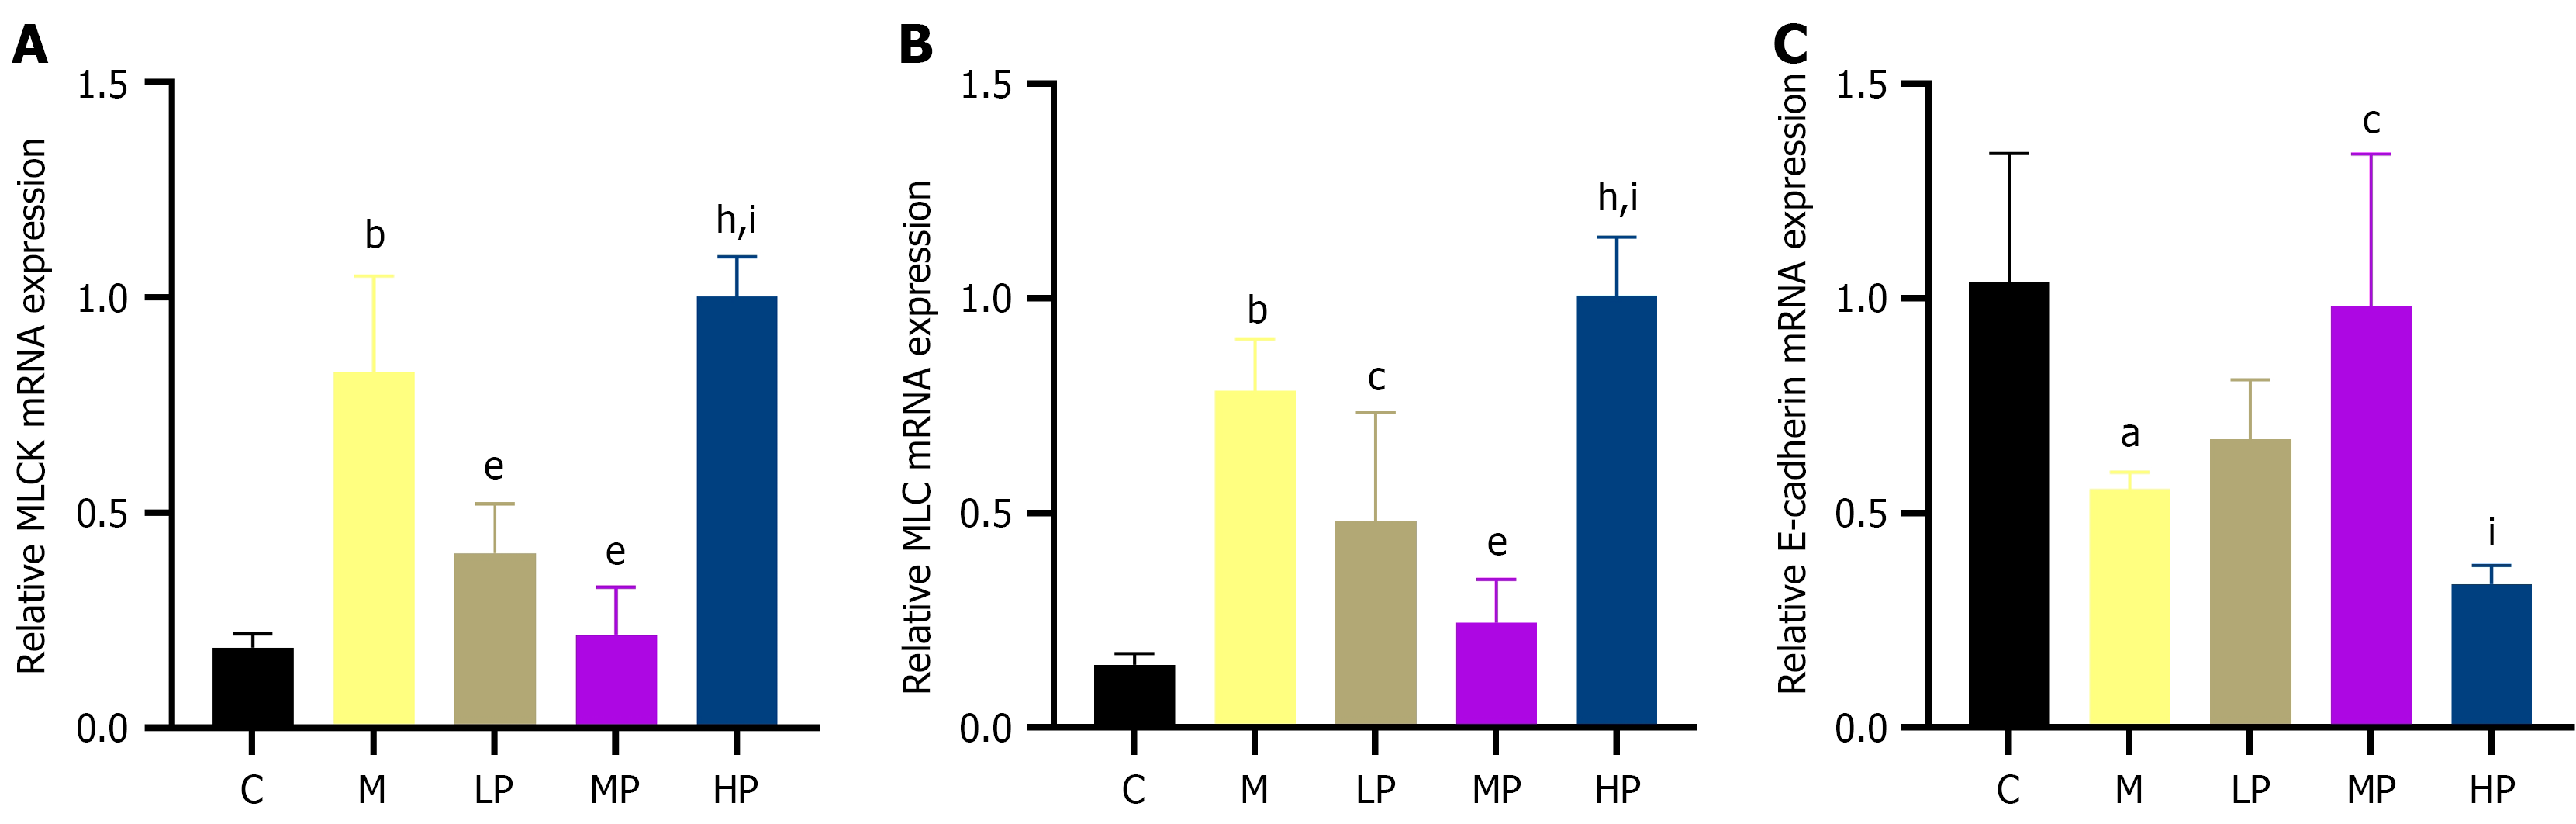
Figure 10 Effect of massage on duodenal myosin light chain kinase, myosin light chain, and E-cadherin mRNA expression in rabbits with functional dyspepsia (n = 6).
aP < 0.01 vs the control group; bP < 0.001 vs the control group; cP < 0.05 vs the model group; eP < 0.001 vs the model group; hP < 0.001 vs the light-pressure group; iP < 0.001 vs the medium-pressure group. Quantitative real-time polymerase chain reaction was used to determine mRNA expression levels in duodenal tissue. A: Myosin light chain kinase; B: Myosin light chain; C: E-cadherin. C: The control group; M: The model group; LP: The light-pressure group; MP: The medium-pressure group; HP: The heavy-pressure group.
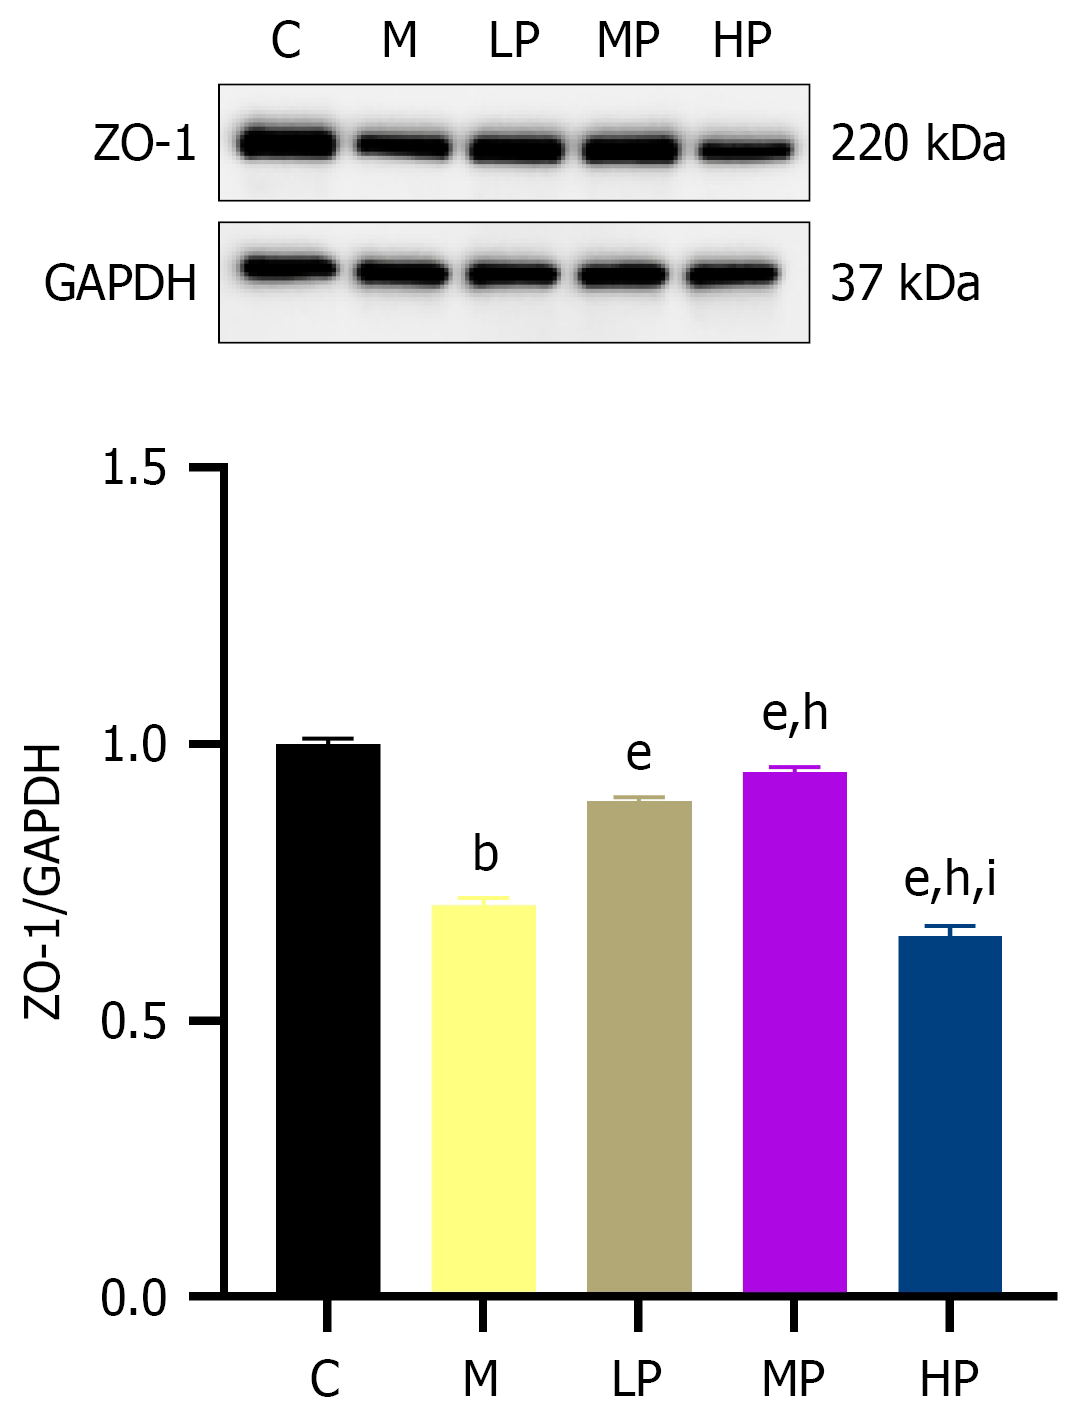
Figure 11 Effect of massage on duodenal ZO-1 protein expression in rabbits with functional dyspepsia (n = 6).
bP < 0.001 vs the control group; eP < 0.001 vs the model group; hP < 0.001 vs the light-pressure group; iP < 0.001 vs the medium-pressure group. GAPHD: Glyceraldehyde-3-phosphate dehydrogenase; C: The control group; M: The model group; LP: The light-pressure group; MP: The medium-pressure group; HP: The heavy-pressure group.
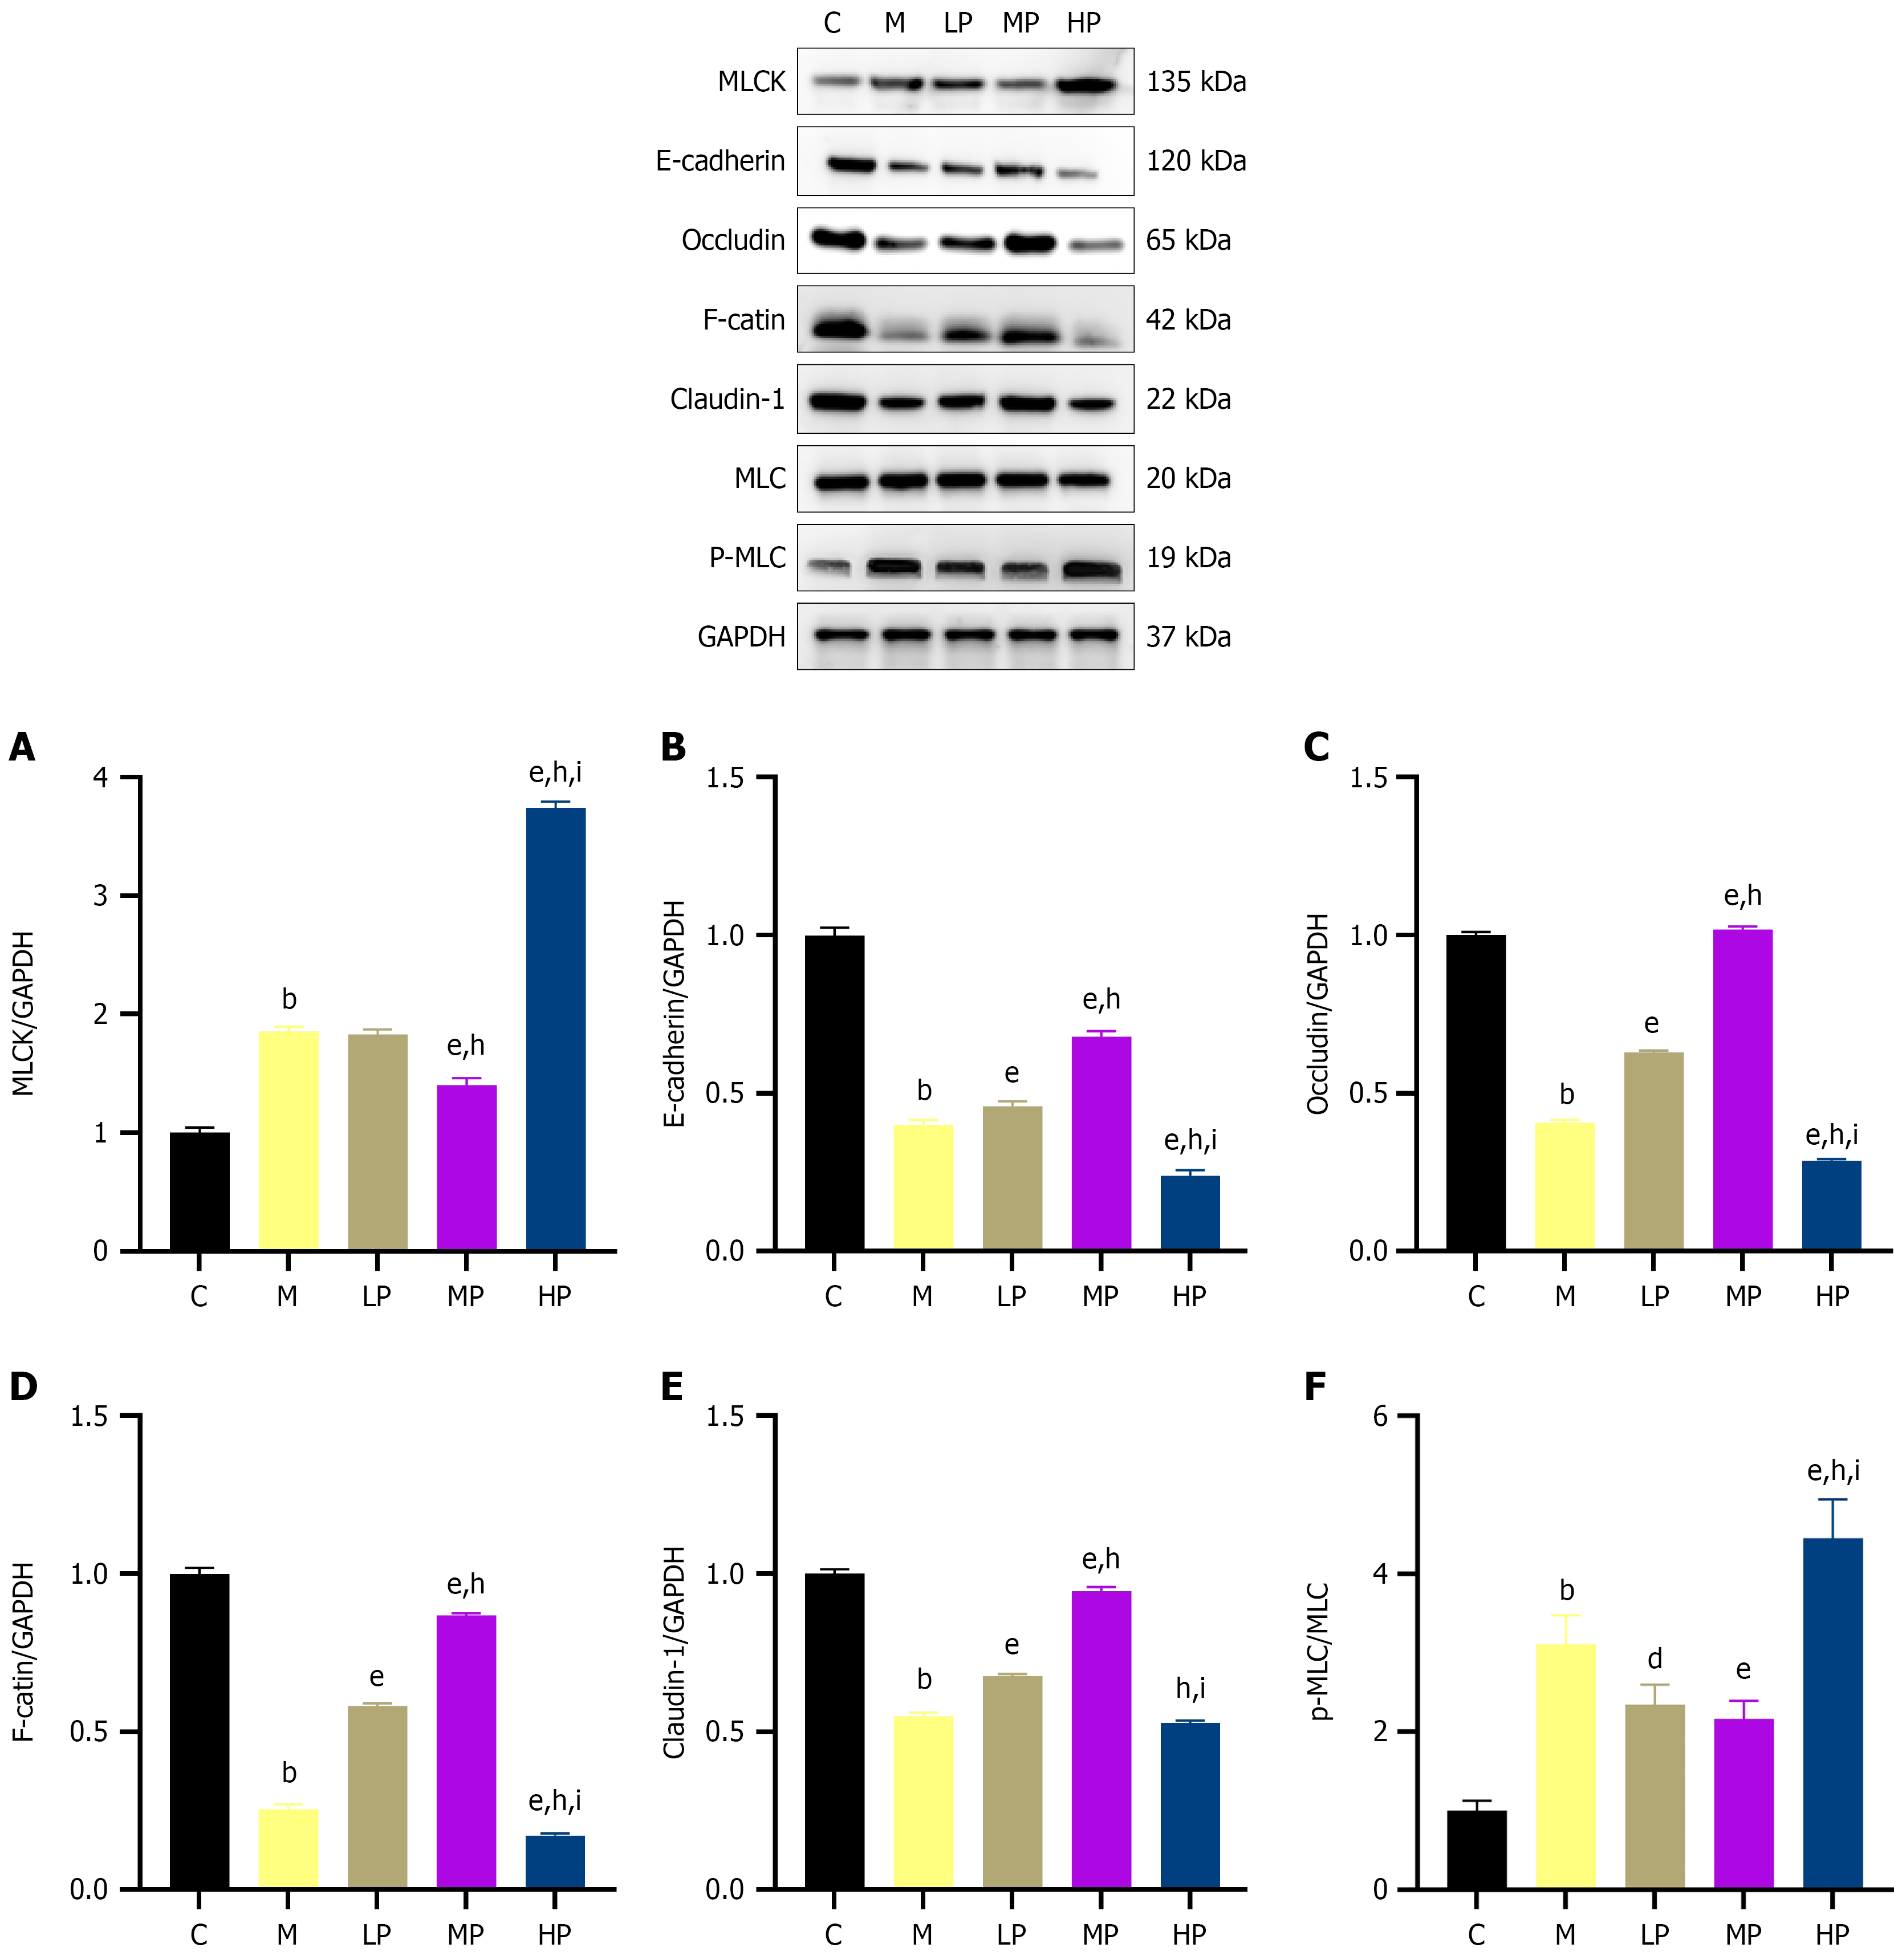
Figure 12 Effect of massage on the myosin light chain kinase/phosphorylated myosin light chain/E-cadherin signaling axis and epithelial barrier-related protein expression in duodenal tissue of rabbits with functional dyspepsia (n = 6).
bP < 0.001 vs the control group; dP < 0.01 vs the model group; eP < 0.001 vs the model group; hP < 0.001 vs the light-pressure group; iP < 0.001 vs the medium-pressure group. A-F: Representative western blot bands show protein expression of myosin light chain kinase, E-cadherin, Occludin, F-actin, Claudin-1, myosin light chain, phosphorylated myosin light chain, and glyceraldehyde-3-phosphate dehydrogenase in duodenal tissue. MLC: Myosin light chain; p-MLC: Phosphorylated myosin light chain; MLCK: Myosin light chain kinase; GAPDH: Glyceraldehyde-3-phosphate dehydrogenase; C: The control group; M: The model group; LP: The light-pressure group; MP: The medium-pressure group; HP: The heavy-pressure group.
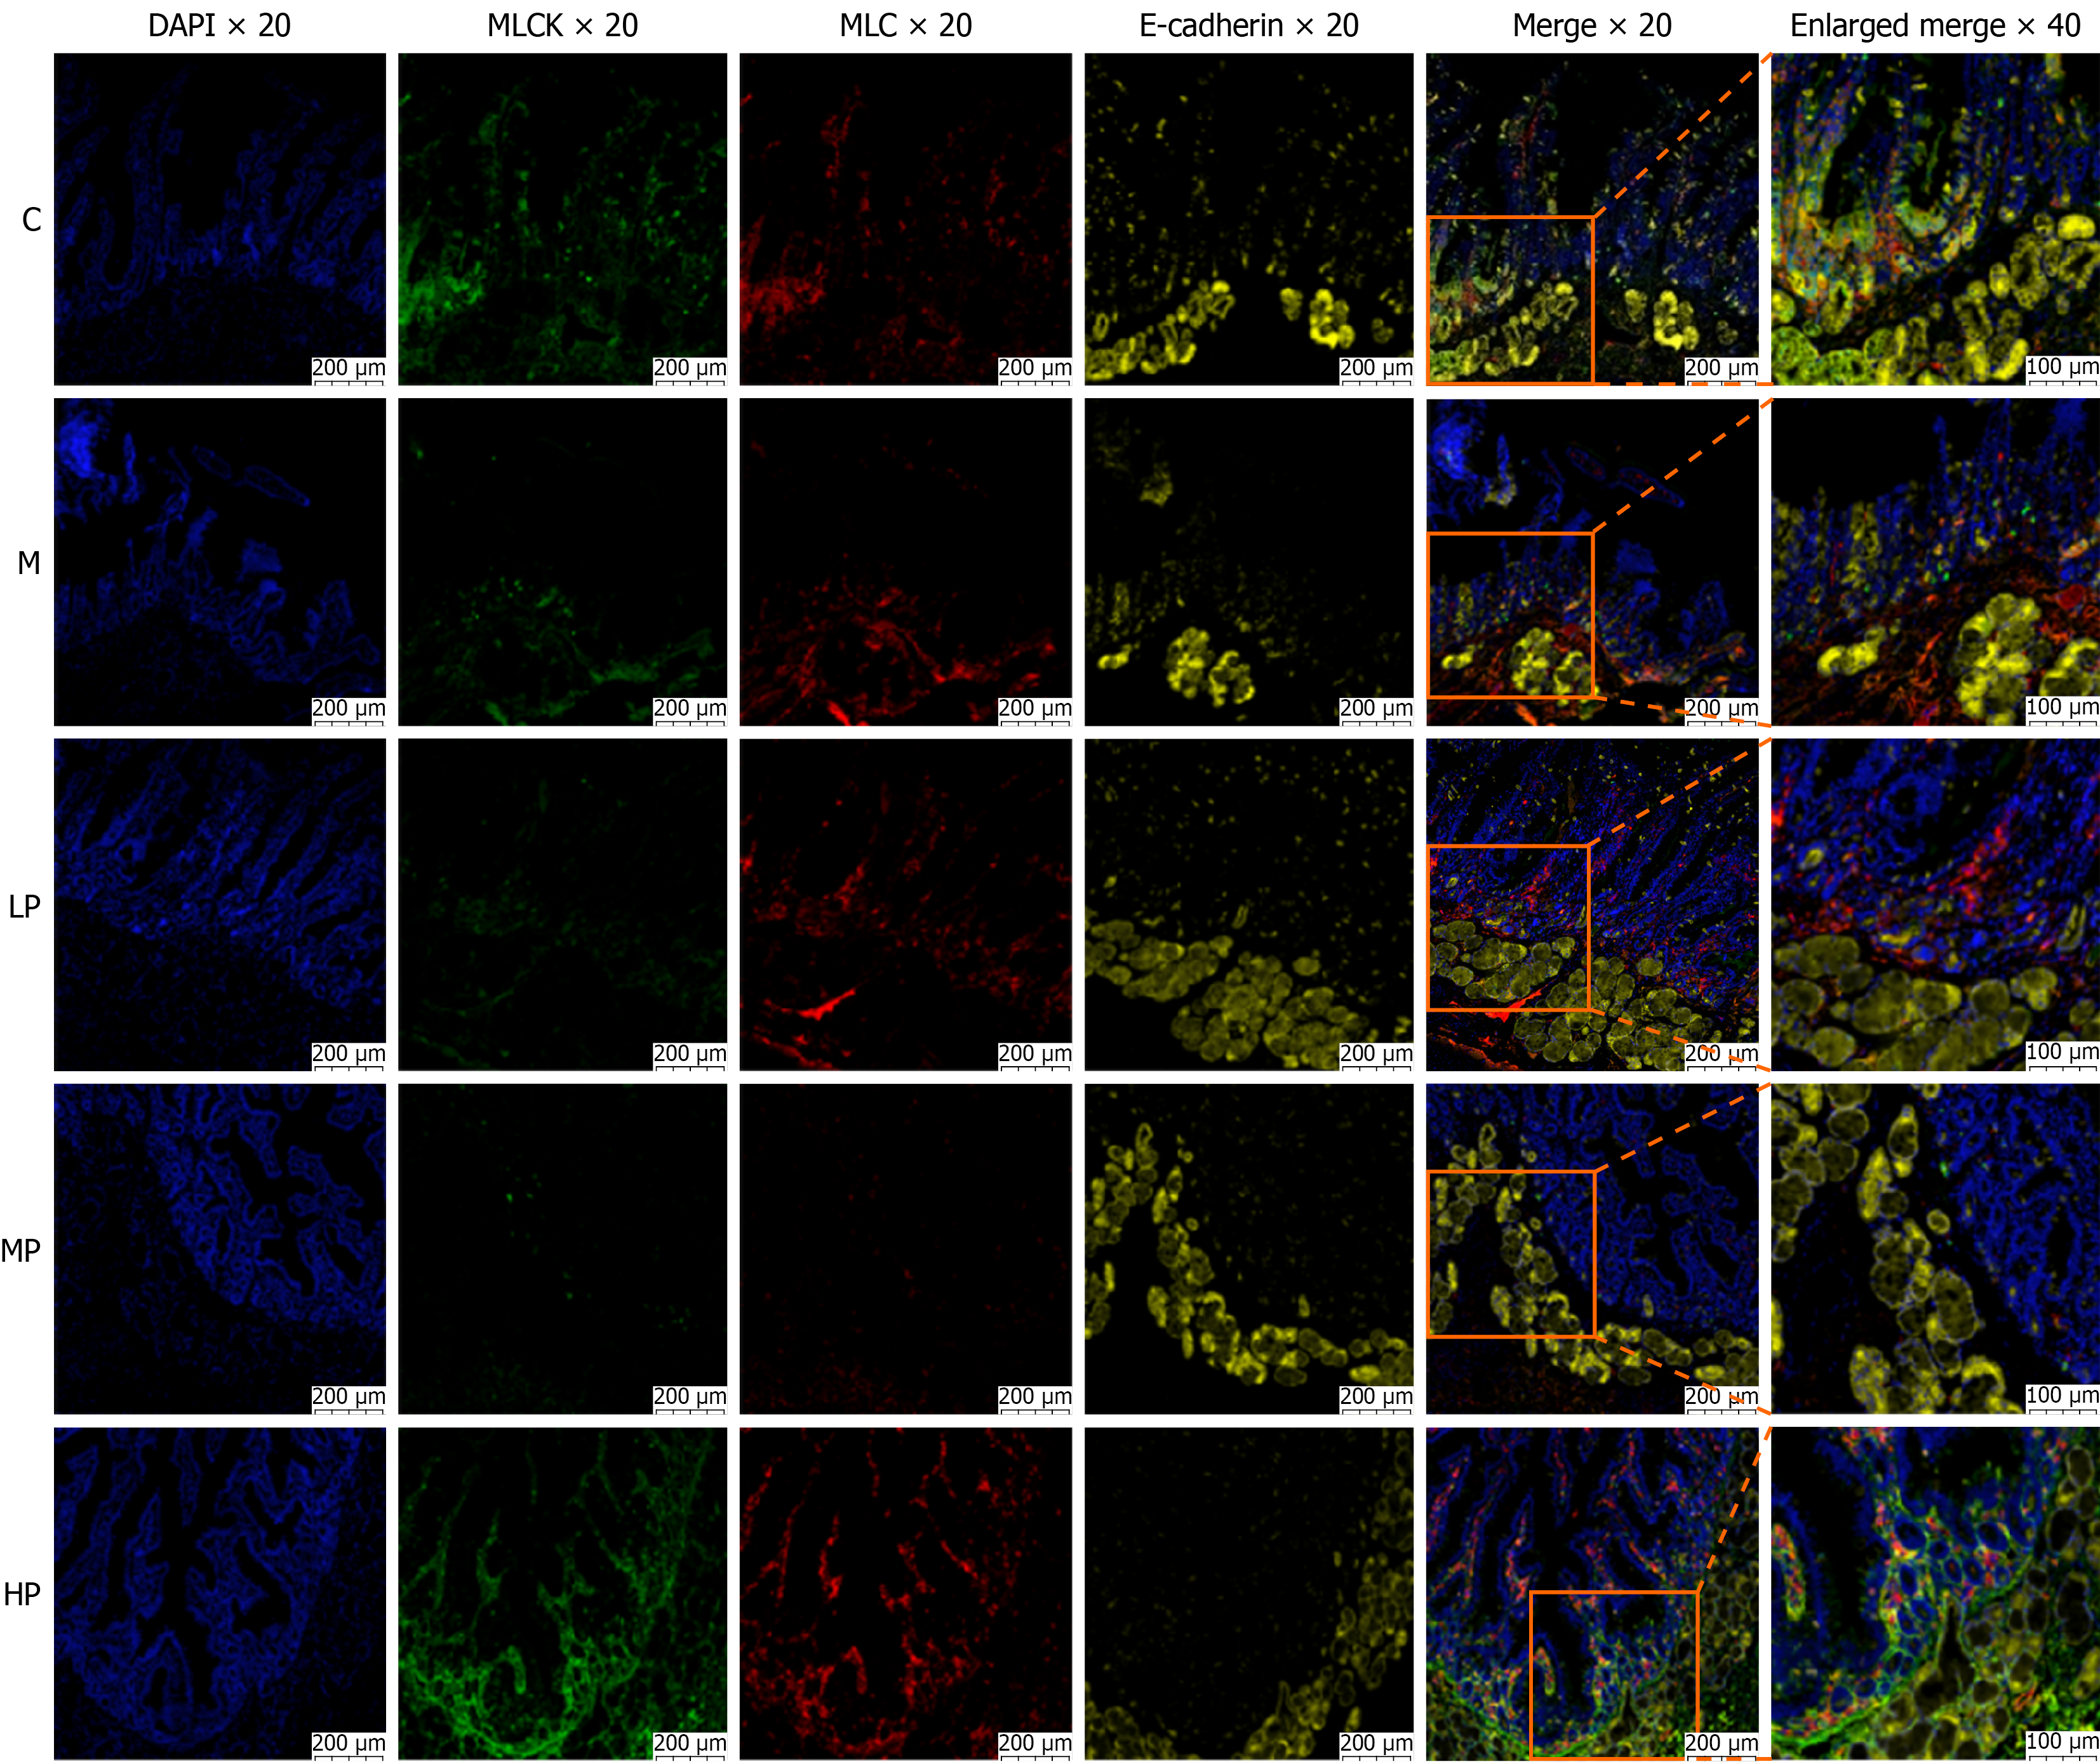
Figure 13 Effect of massage on the expression and spatial distribution of myosin light chain kinase, myosin light chain, and E-cadherin in duodenal tissue of rabbits with functional dyspepsia (immunofluorescence, × 20/× 40).
Representative immunofluorescence images show 4’,6-diamidino-2-phenylindole-stained nuclei (blue), myosin light chain kinase (green), myosin light chain (red), E-cadherin (yellow), and merged signals. The first five panels in each group show 4’,6-diamidino-2-phenylindole, myosin light chain kinase, myosin light chain, E-cadherin, and merged images, respectively. The sixth panel shows an enlarged view of the boxed region in the merged image. Scale bars: 200 μm at × 20 magnification and 100 μm at × 40 magnification (n = 6). DAPI: 4’,6-diamidino-2-phenylindole; MLCK: Myosin light chain kinase; MLC: Myosin light chain; C: The control group; M: The model group; LP: The light-pressure group; MP: The medium-pressure group; HP: The heavy-pressure group.
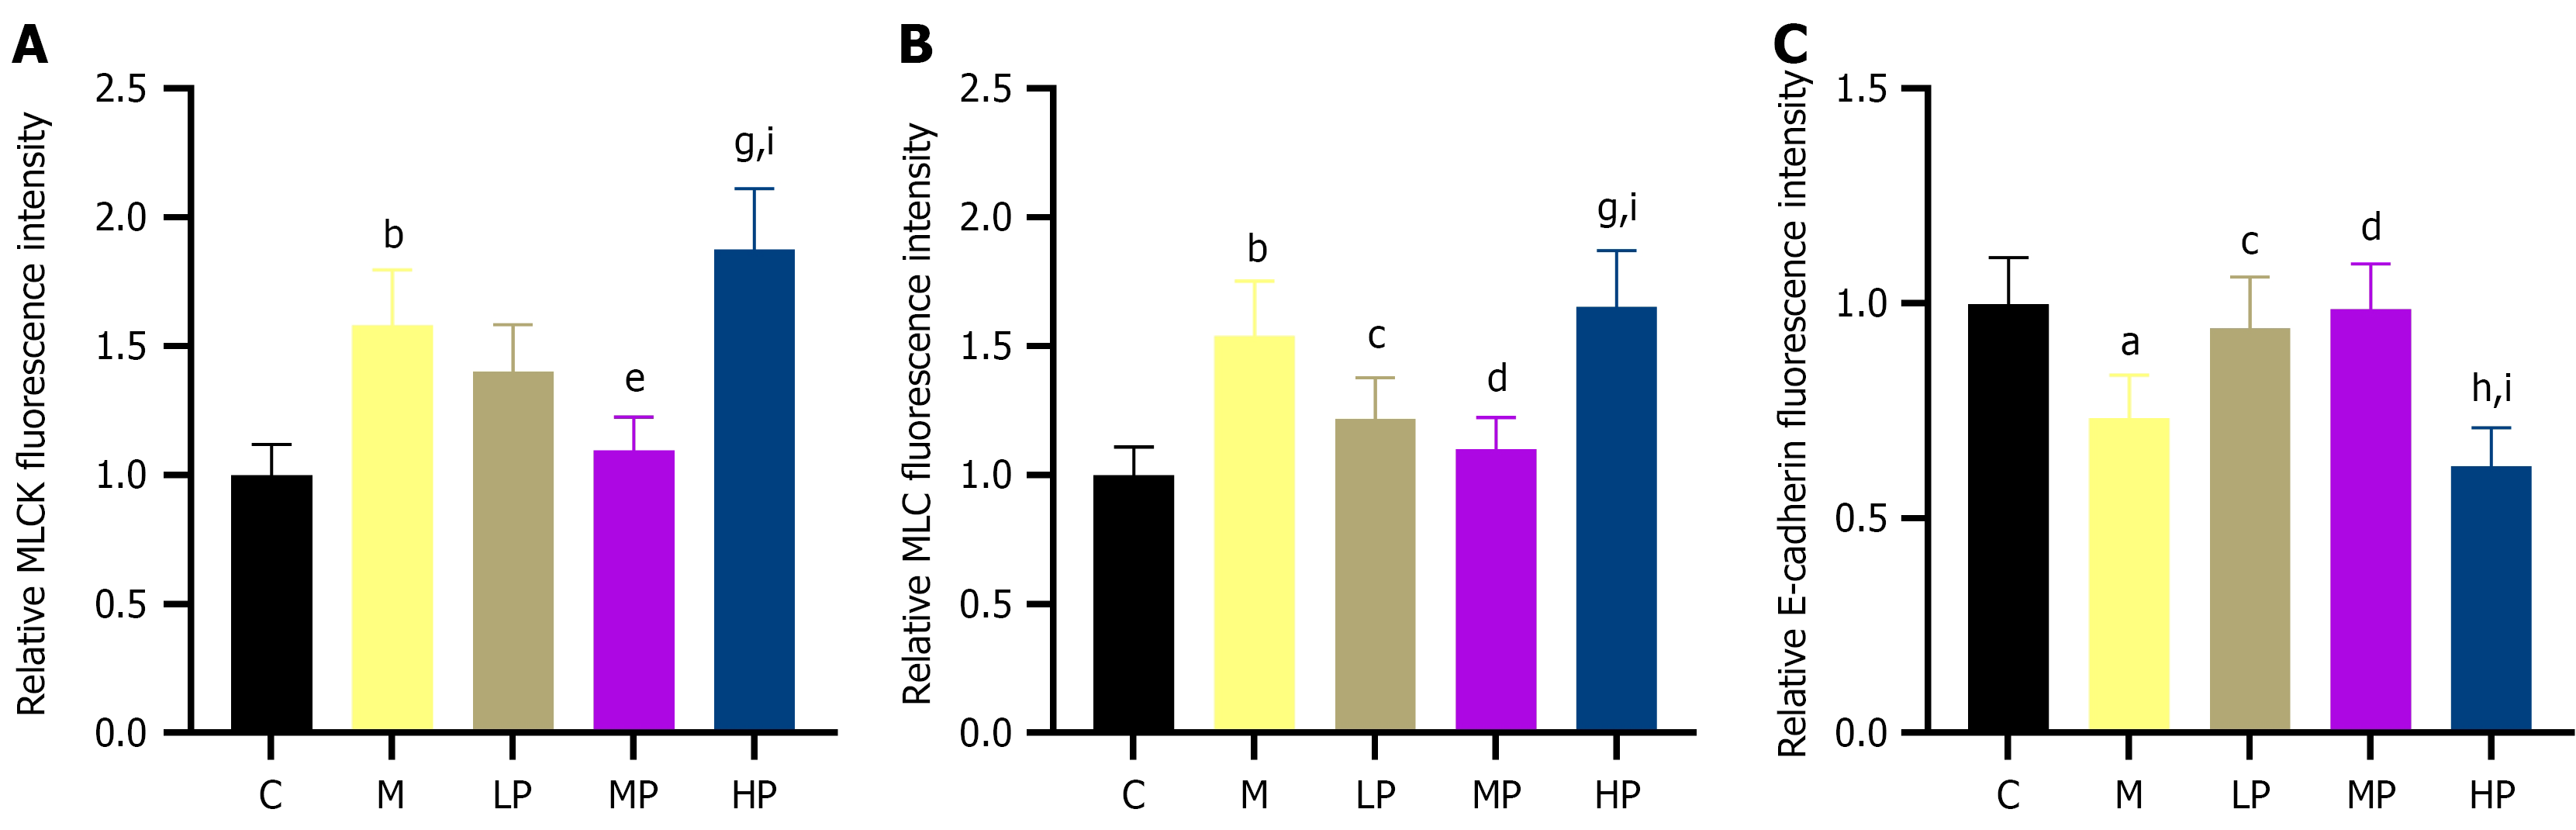
Figure 14 Effect of massage on the relative fluorescence intensities in duodenal tissue of rabbits with functional dyspepsia (n = 6).
aP < 0.01 vs the control group; bP < 0.001 vs the control group; cP < 0.05 vs the model group; dP < 0.01 vs the model group; eP < 0.001 vs the model group; gP < 0.01 vs the light-pressure group; hP < 0.001 vs the light-pressure group; iP < 0.001 vs the medium-pressure group. A: Myosin light chain kinase; B: Myosin light chain; C: E-cadherin. MLCK: Myosin light chain kinase; MLC: Myosin light chain; C: The control group; M: The model group; LP: The light-pressure group; MP: The medium-pressure group; HP: The heavy-pressure group.
- Citation: Zhang YC, Yang WX, Hou JL, Wang ZX, Huang ZK, Li HL, Kek MZ, Lin DR, Wu RH, Wang JH. Robot-assisted massage is associated with improved duodenal barrier-related outcomes in a rabbit model of functional dyspepsia. World J Gastroenterol 2027; 33(2): 125781
- URL: https://www.wjgnet.com/1007-9327/full/v33/i2/125781.htm
- DOI: https://dx.doi.org/10.3748/wjg.125781