
















Copyright: ©Author(s) 2027.
World J Gastroenterol. Jan 14, 2027; 33(2): 124393
Published online Jan 14, 2027. doi: 10.3748/wjg.124393
Published online Jan 14, 2027. doi: 10.3748/wjg.124393
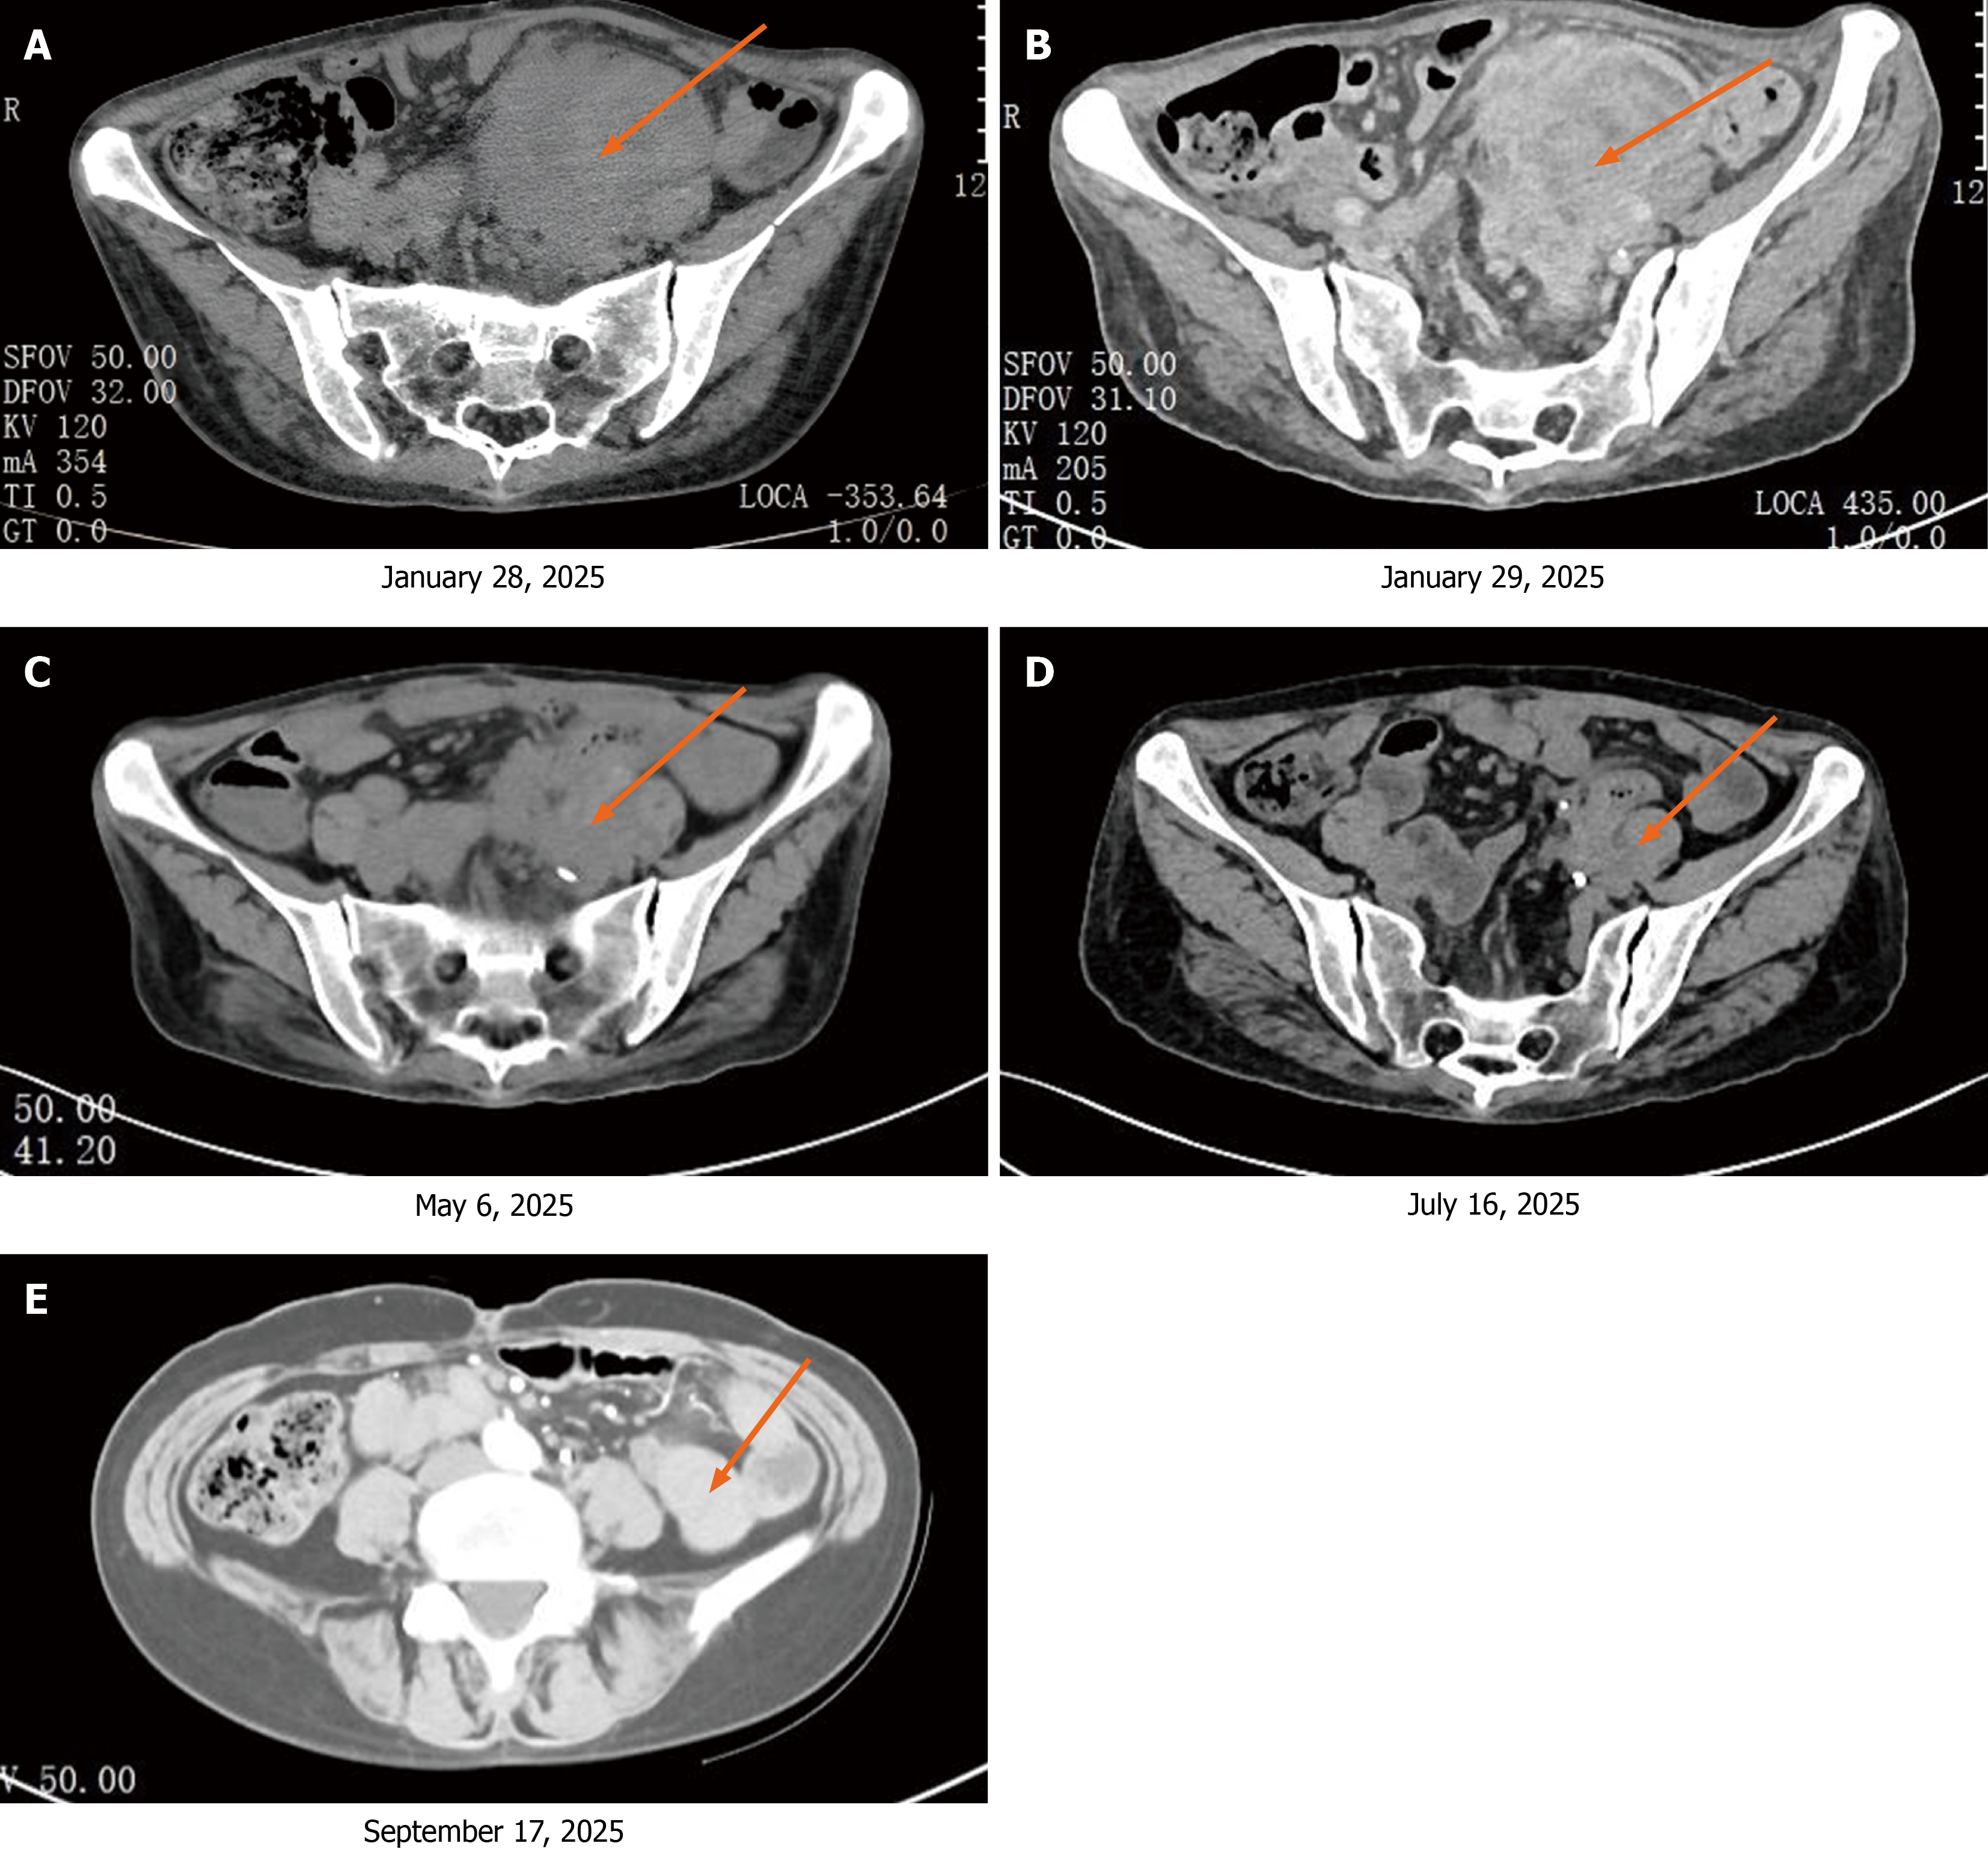
Figure 1 Computed tomography revealing cancer of the descending colon and sigmoid colon at different times.
A: Whole abdominal plain computed tomography (CT) following admission (January 28, 2025); B: Enhanced abdominal CT following admission (January 29, 2025); C: Enhanced abdominal CT one month after treatment with the combination of tislelizumab and bevacizumab (May 6, 2025); D: Enhanced abdominal CT three months after targeted immunotherapy (July 16, 2025); E: Enhanced abdominal CT five months after targeted immunotherapy (September 17, 2025).
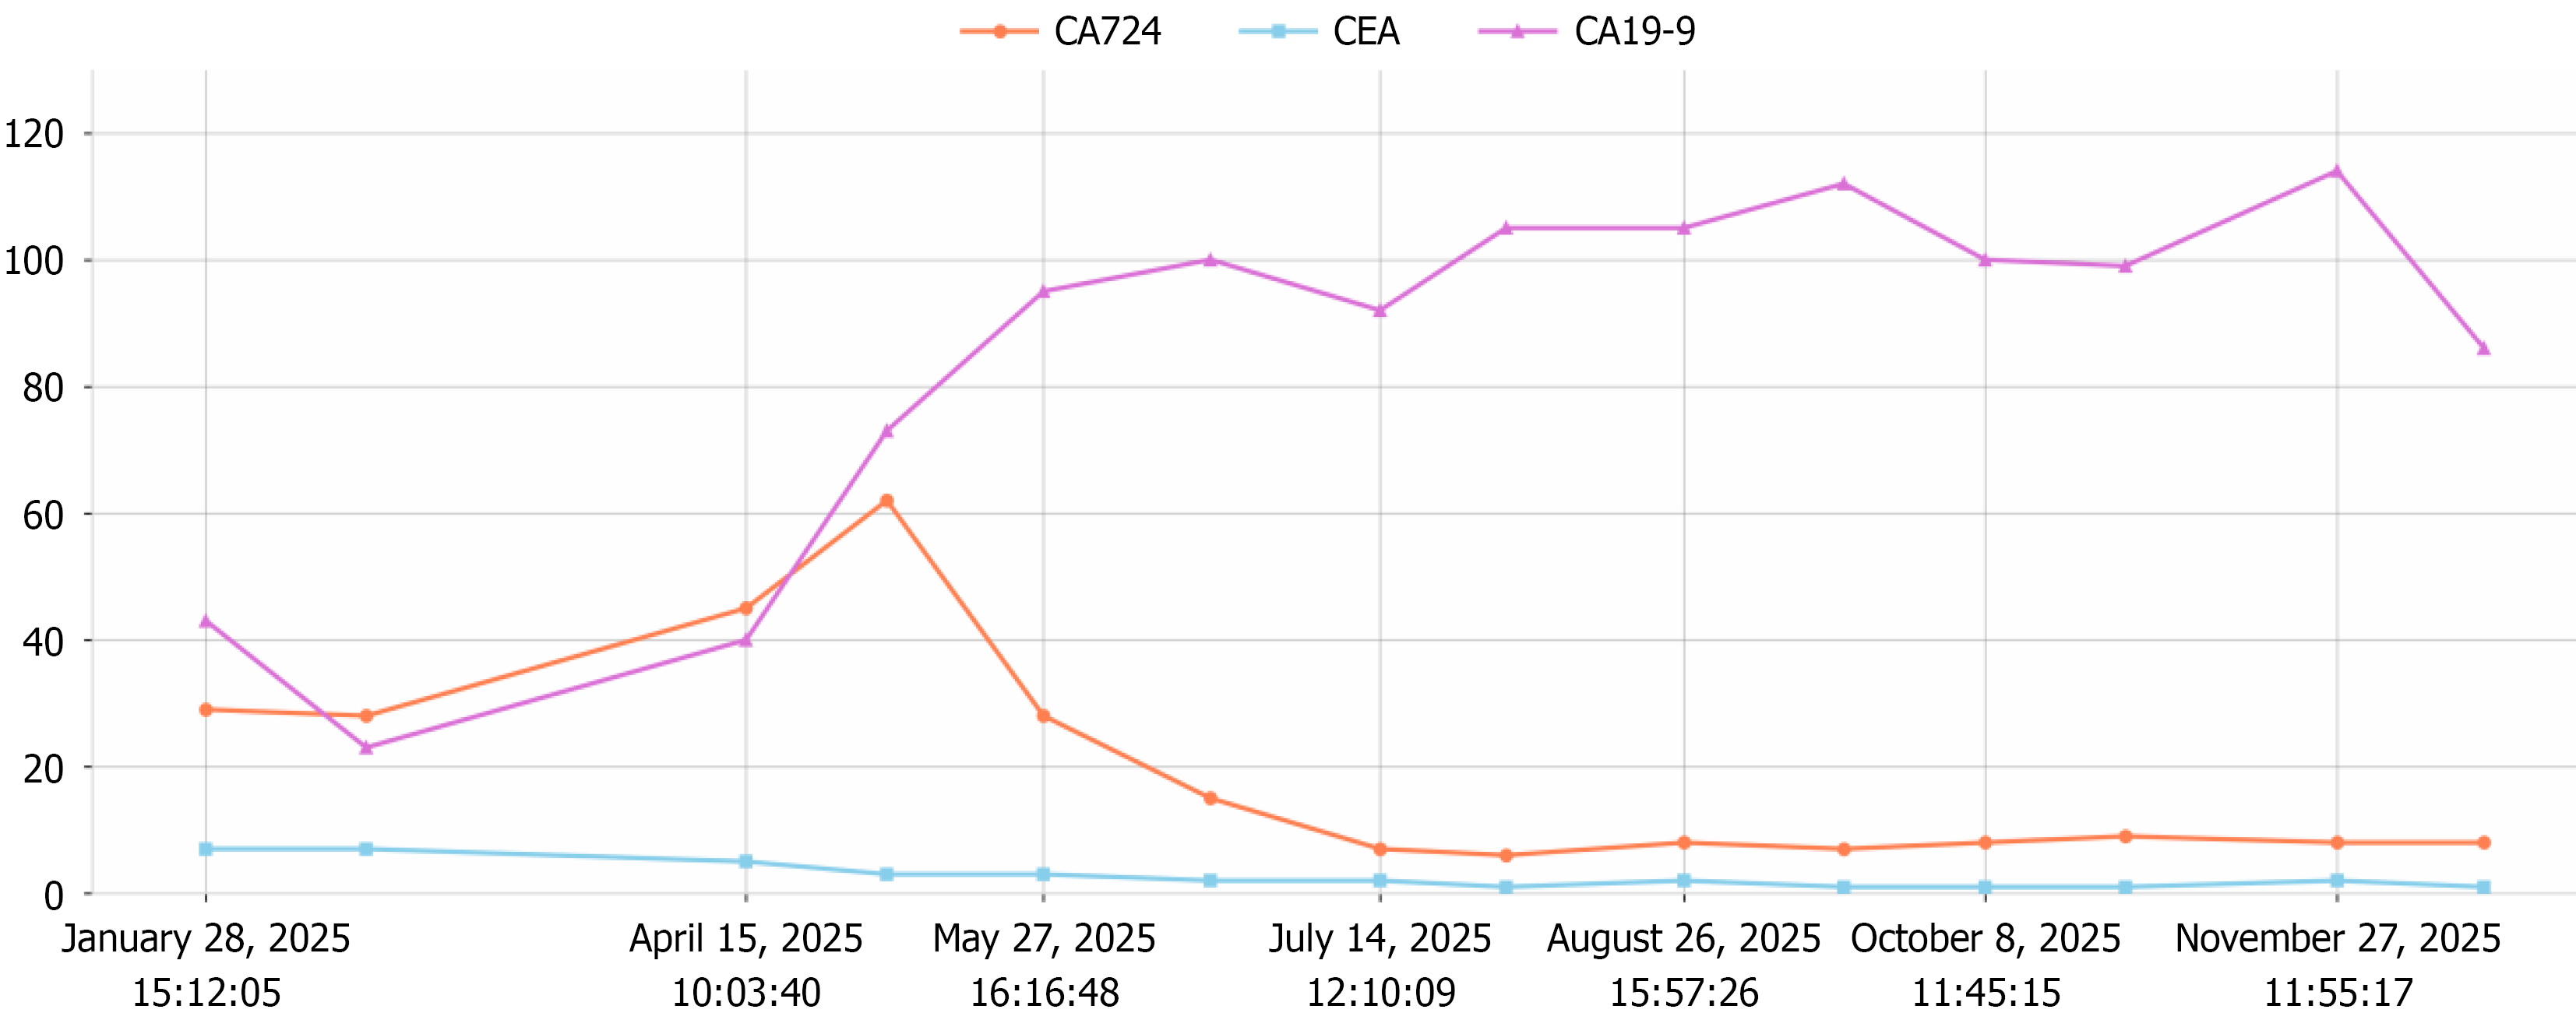
Figure 2 Changes in the levels of carbohydrate antigen 724, carcinoembryonic antigen, and carbohydrate antigen 199 during gastrointestinal and pancreatic tumor screening from January to November.
CA: Carbohydrate antigen; CEA: Carcinoembryonic antigen.
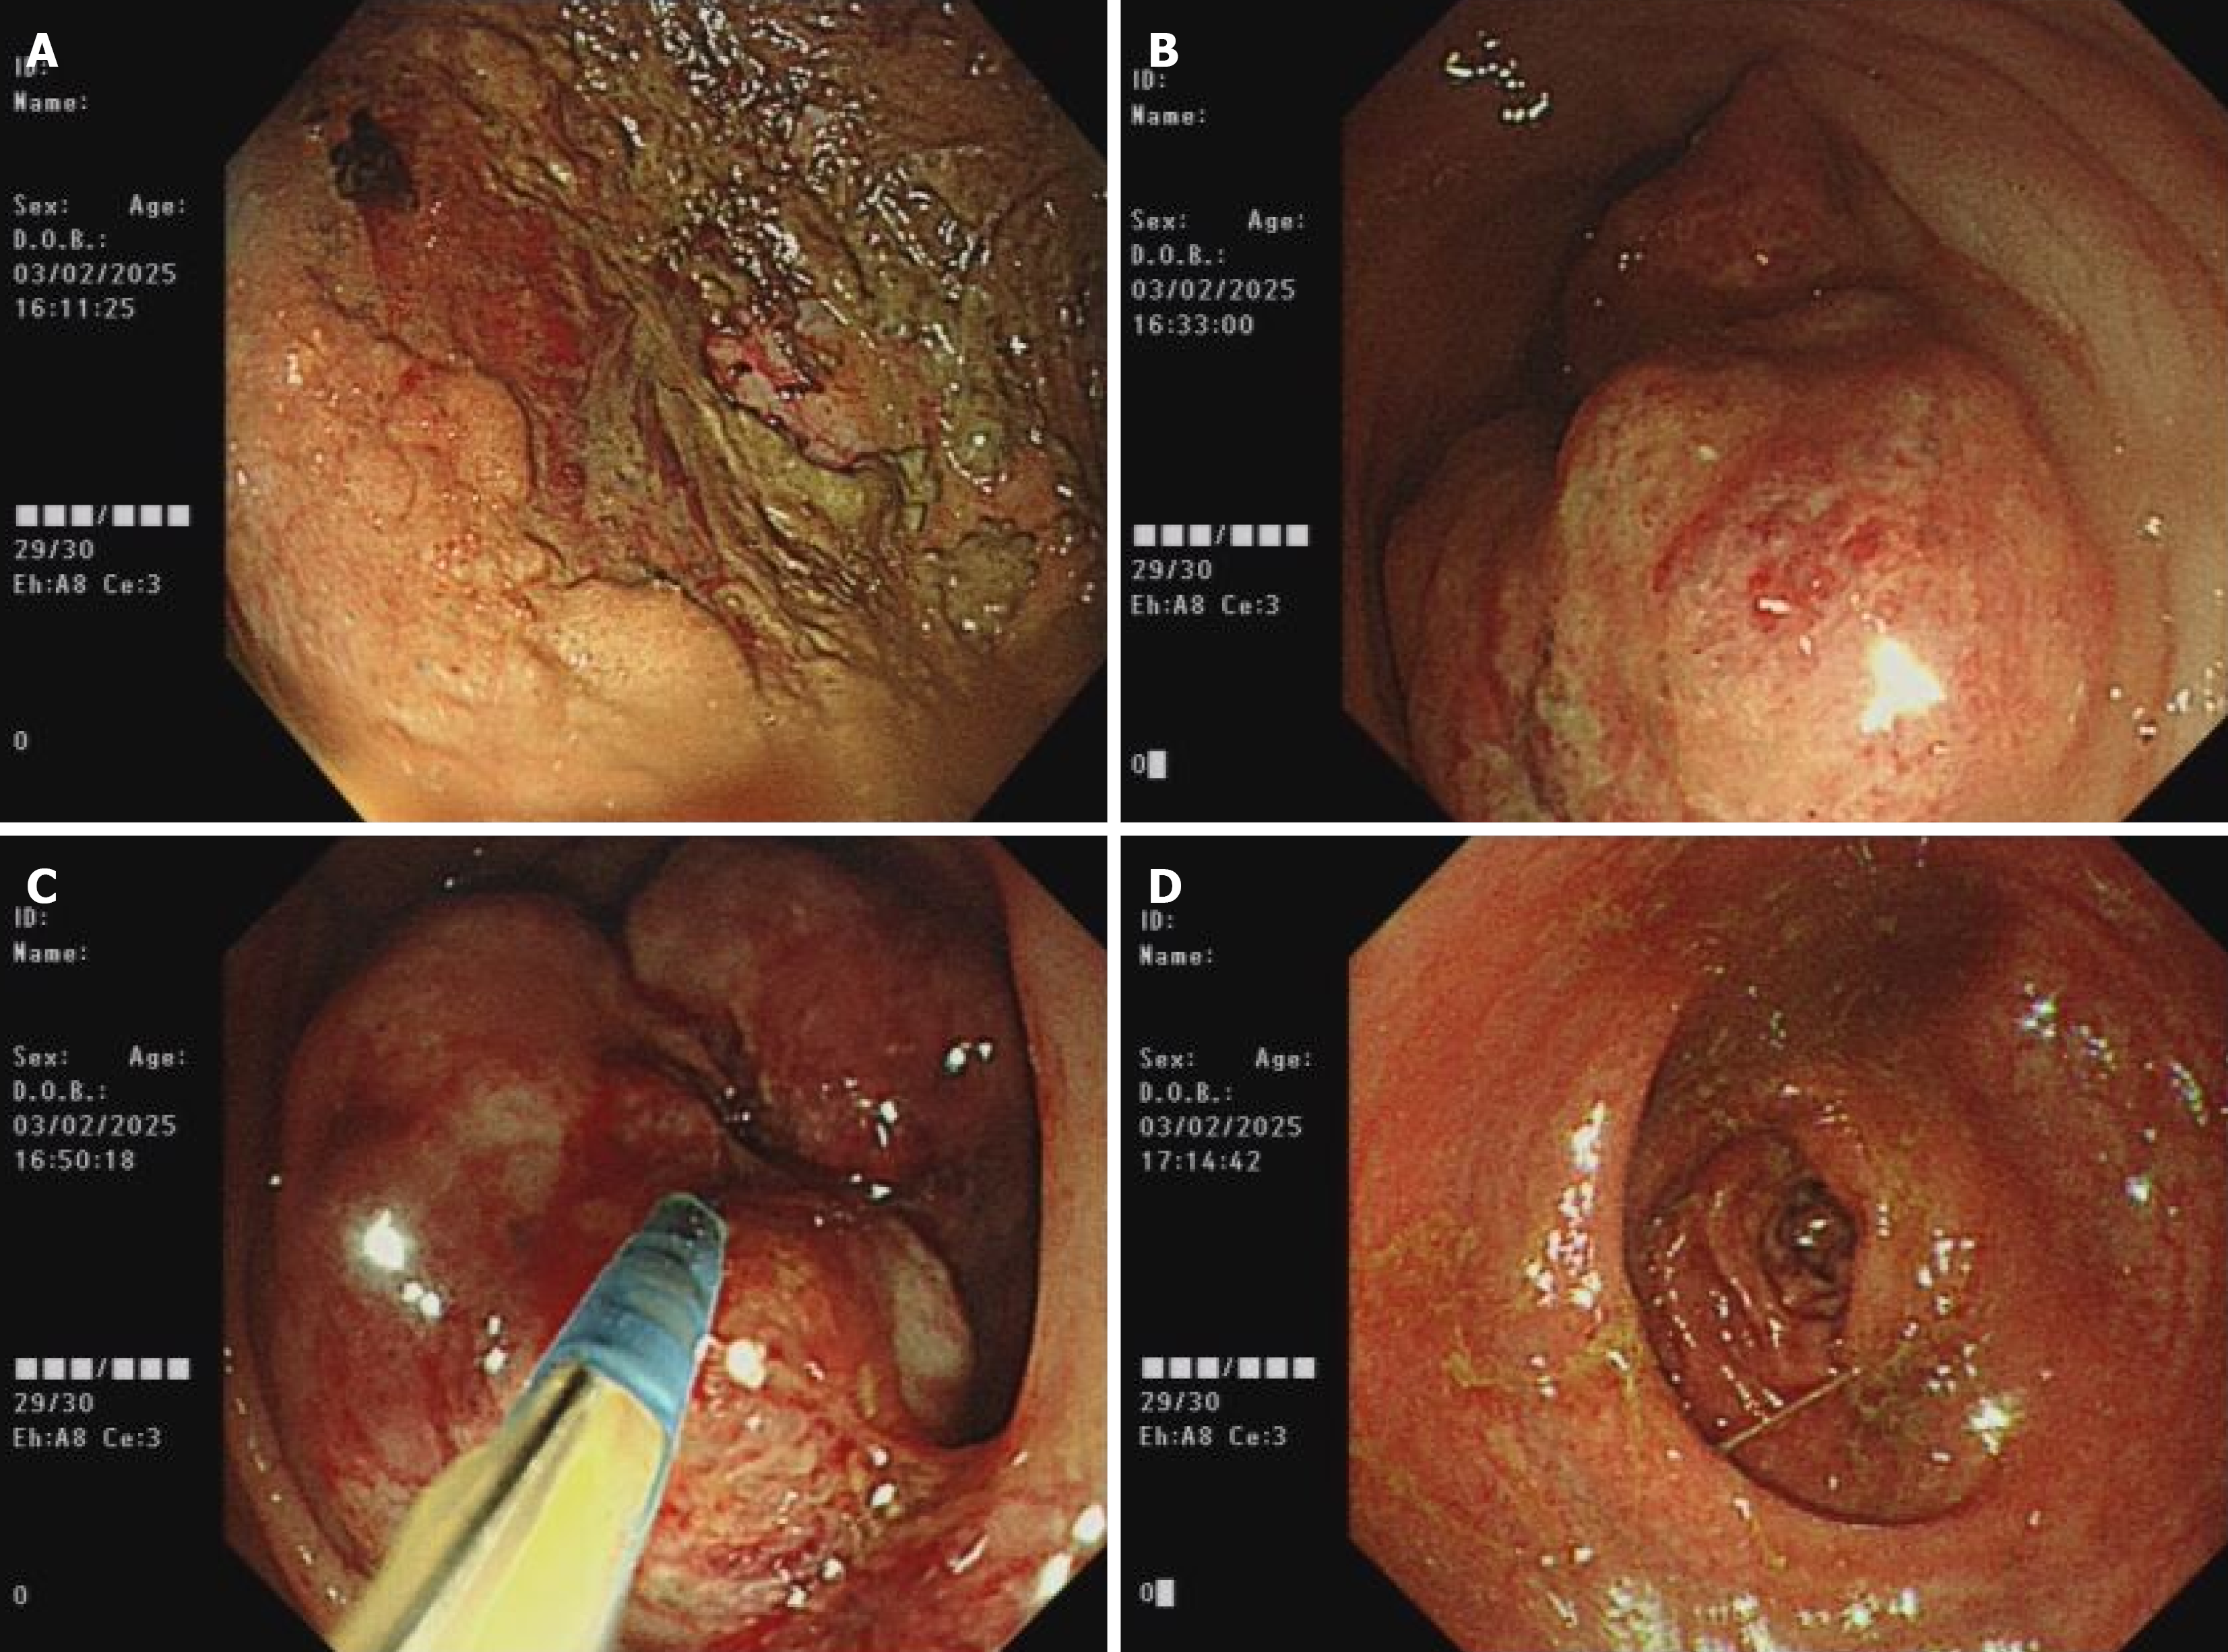
Figure 3 Colonoscopy on February 3, 2025.
A and B: Sigmoid mucosal swelling with ulceration and purulent exudate; C: Biopsy sampling of the abnormal mucosa; D: Associated luminal stricture.
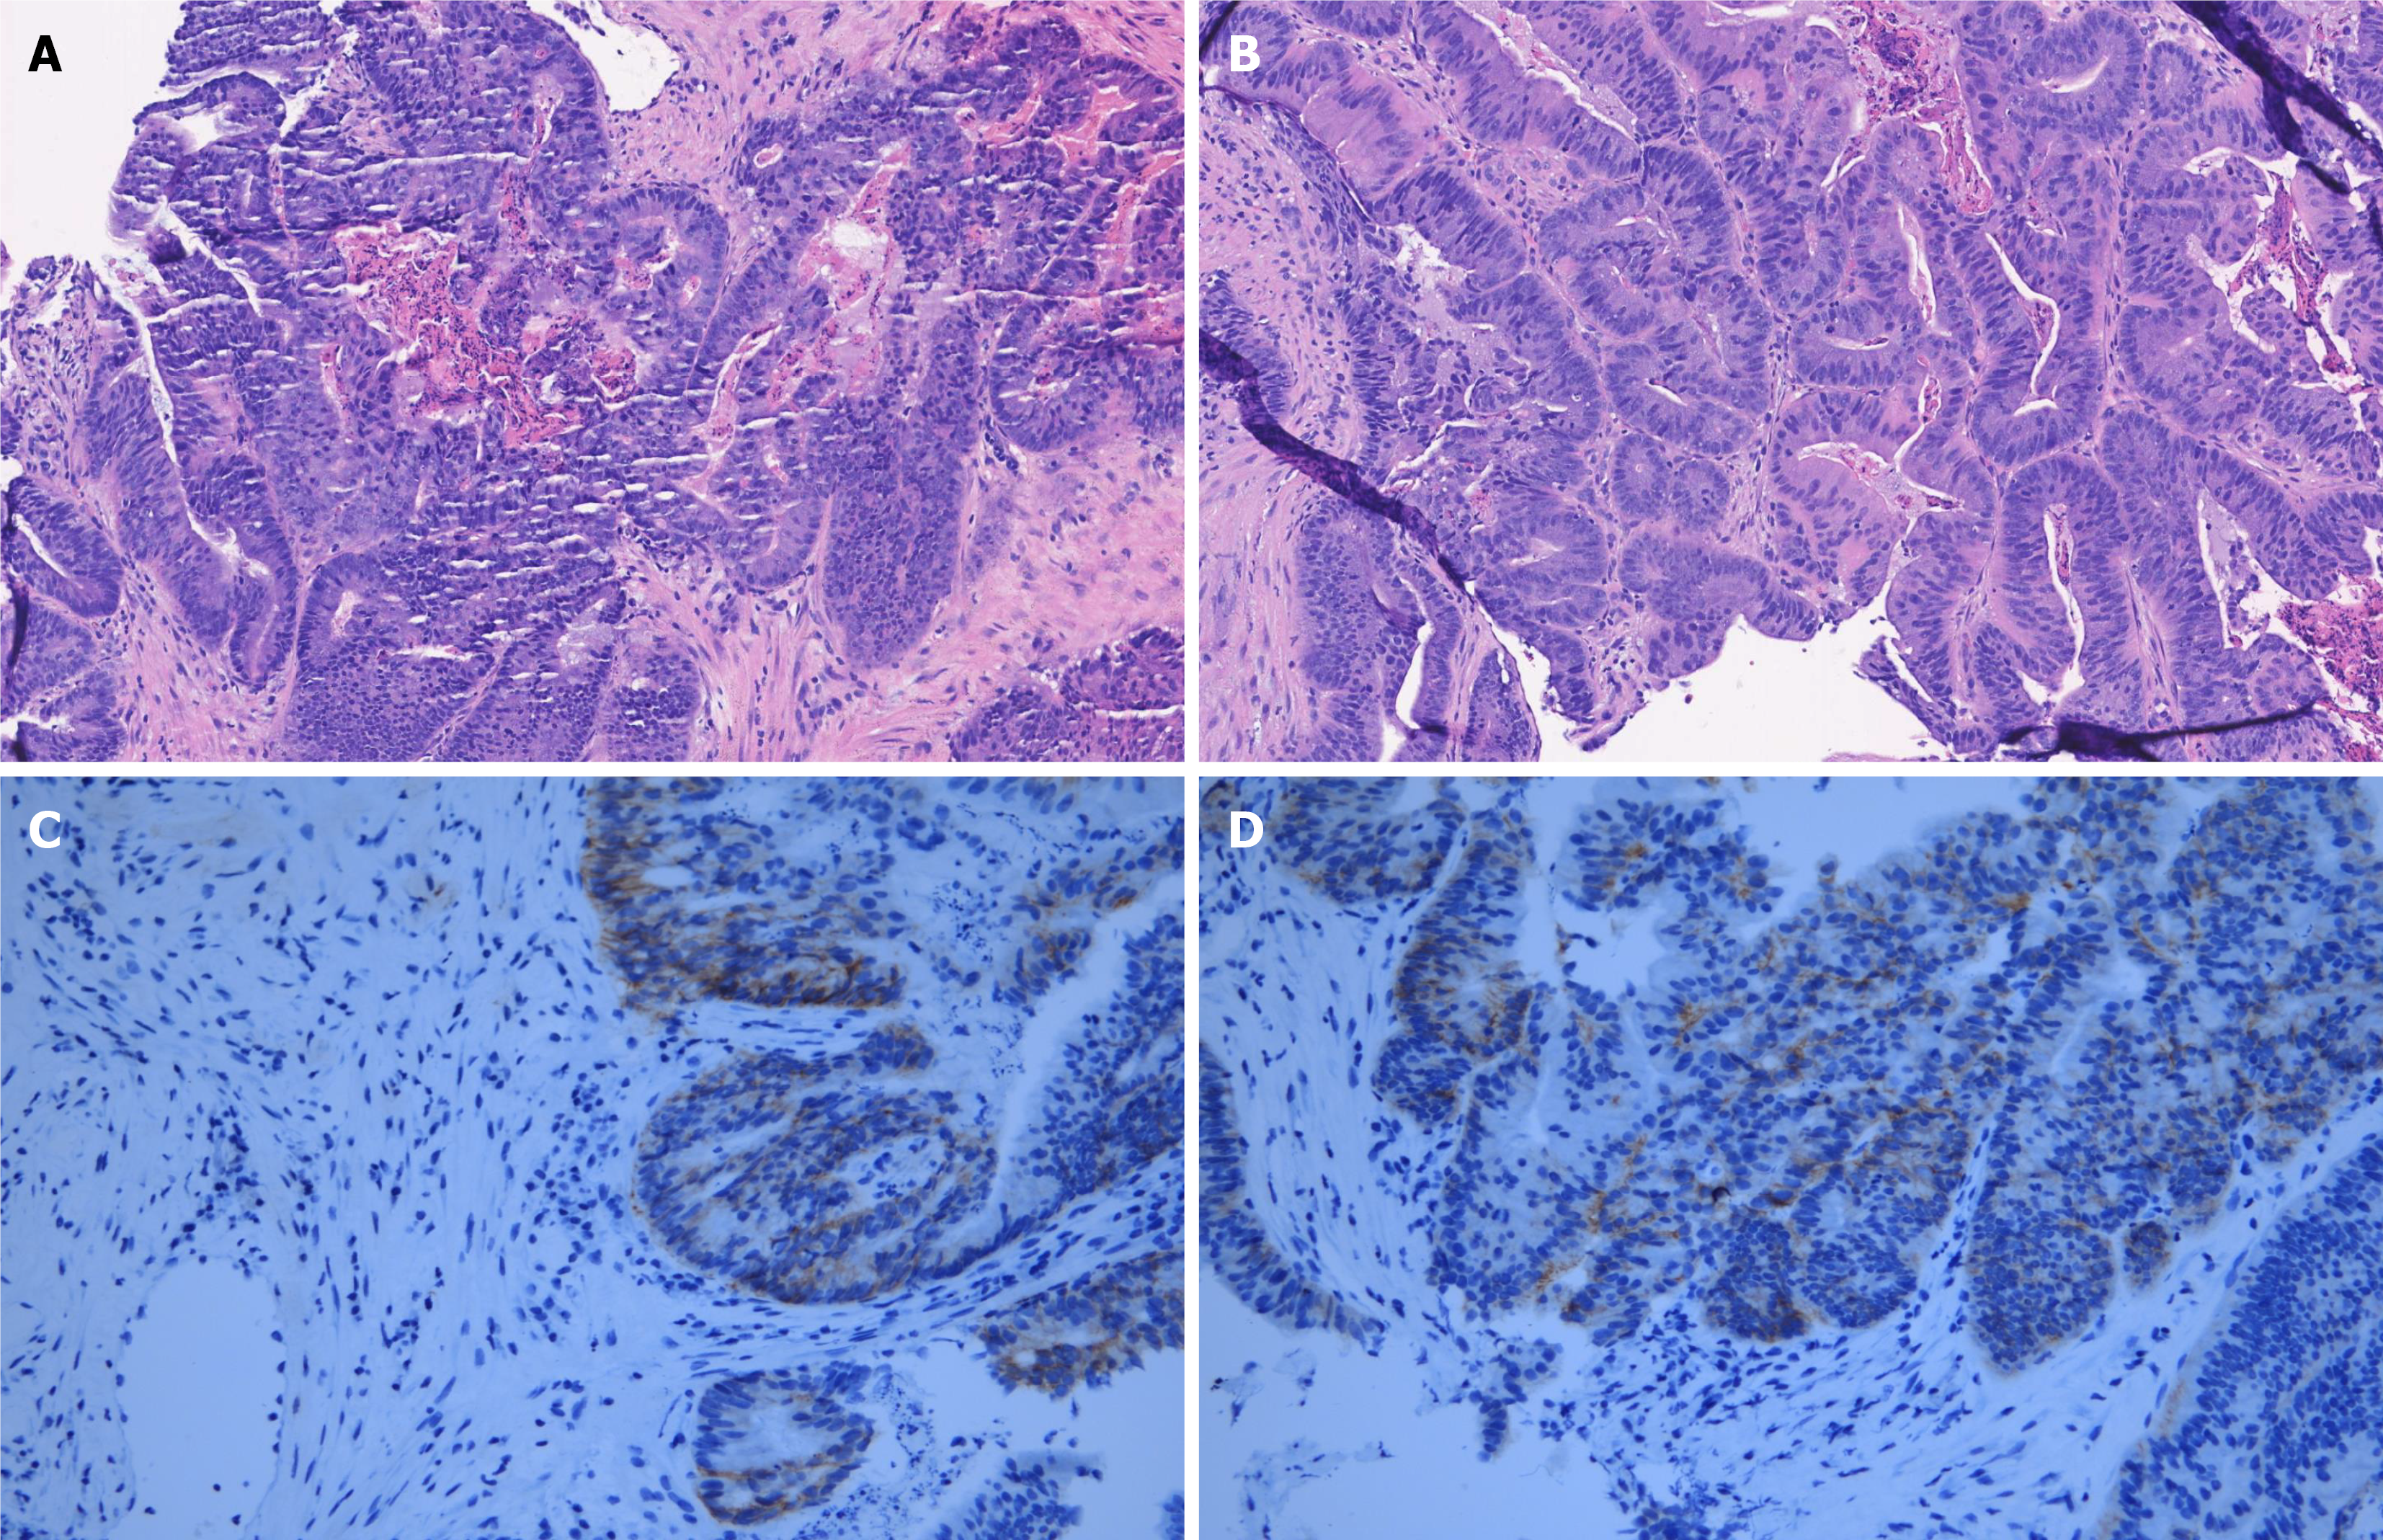
Figure 4 Histopathology of the colonoscopic biopsy specimen obtained on February 3, 2025.
A and B: Hematoxylin and eosin staining showing adenocarcinoma; C and D: Programmed death-ligand 1 immunohistochemistry (combined positive score, approximately 1). Original magnification, × 20.
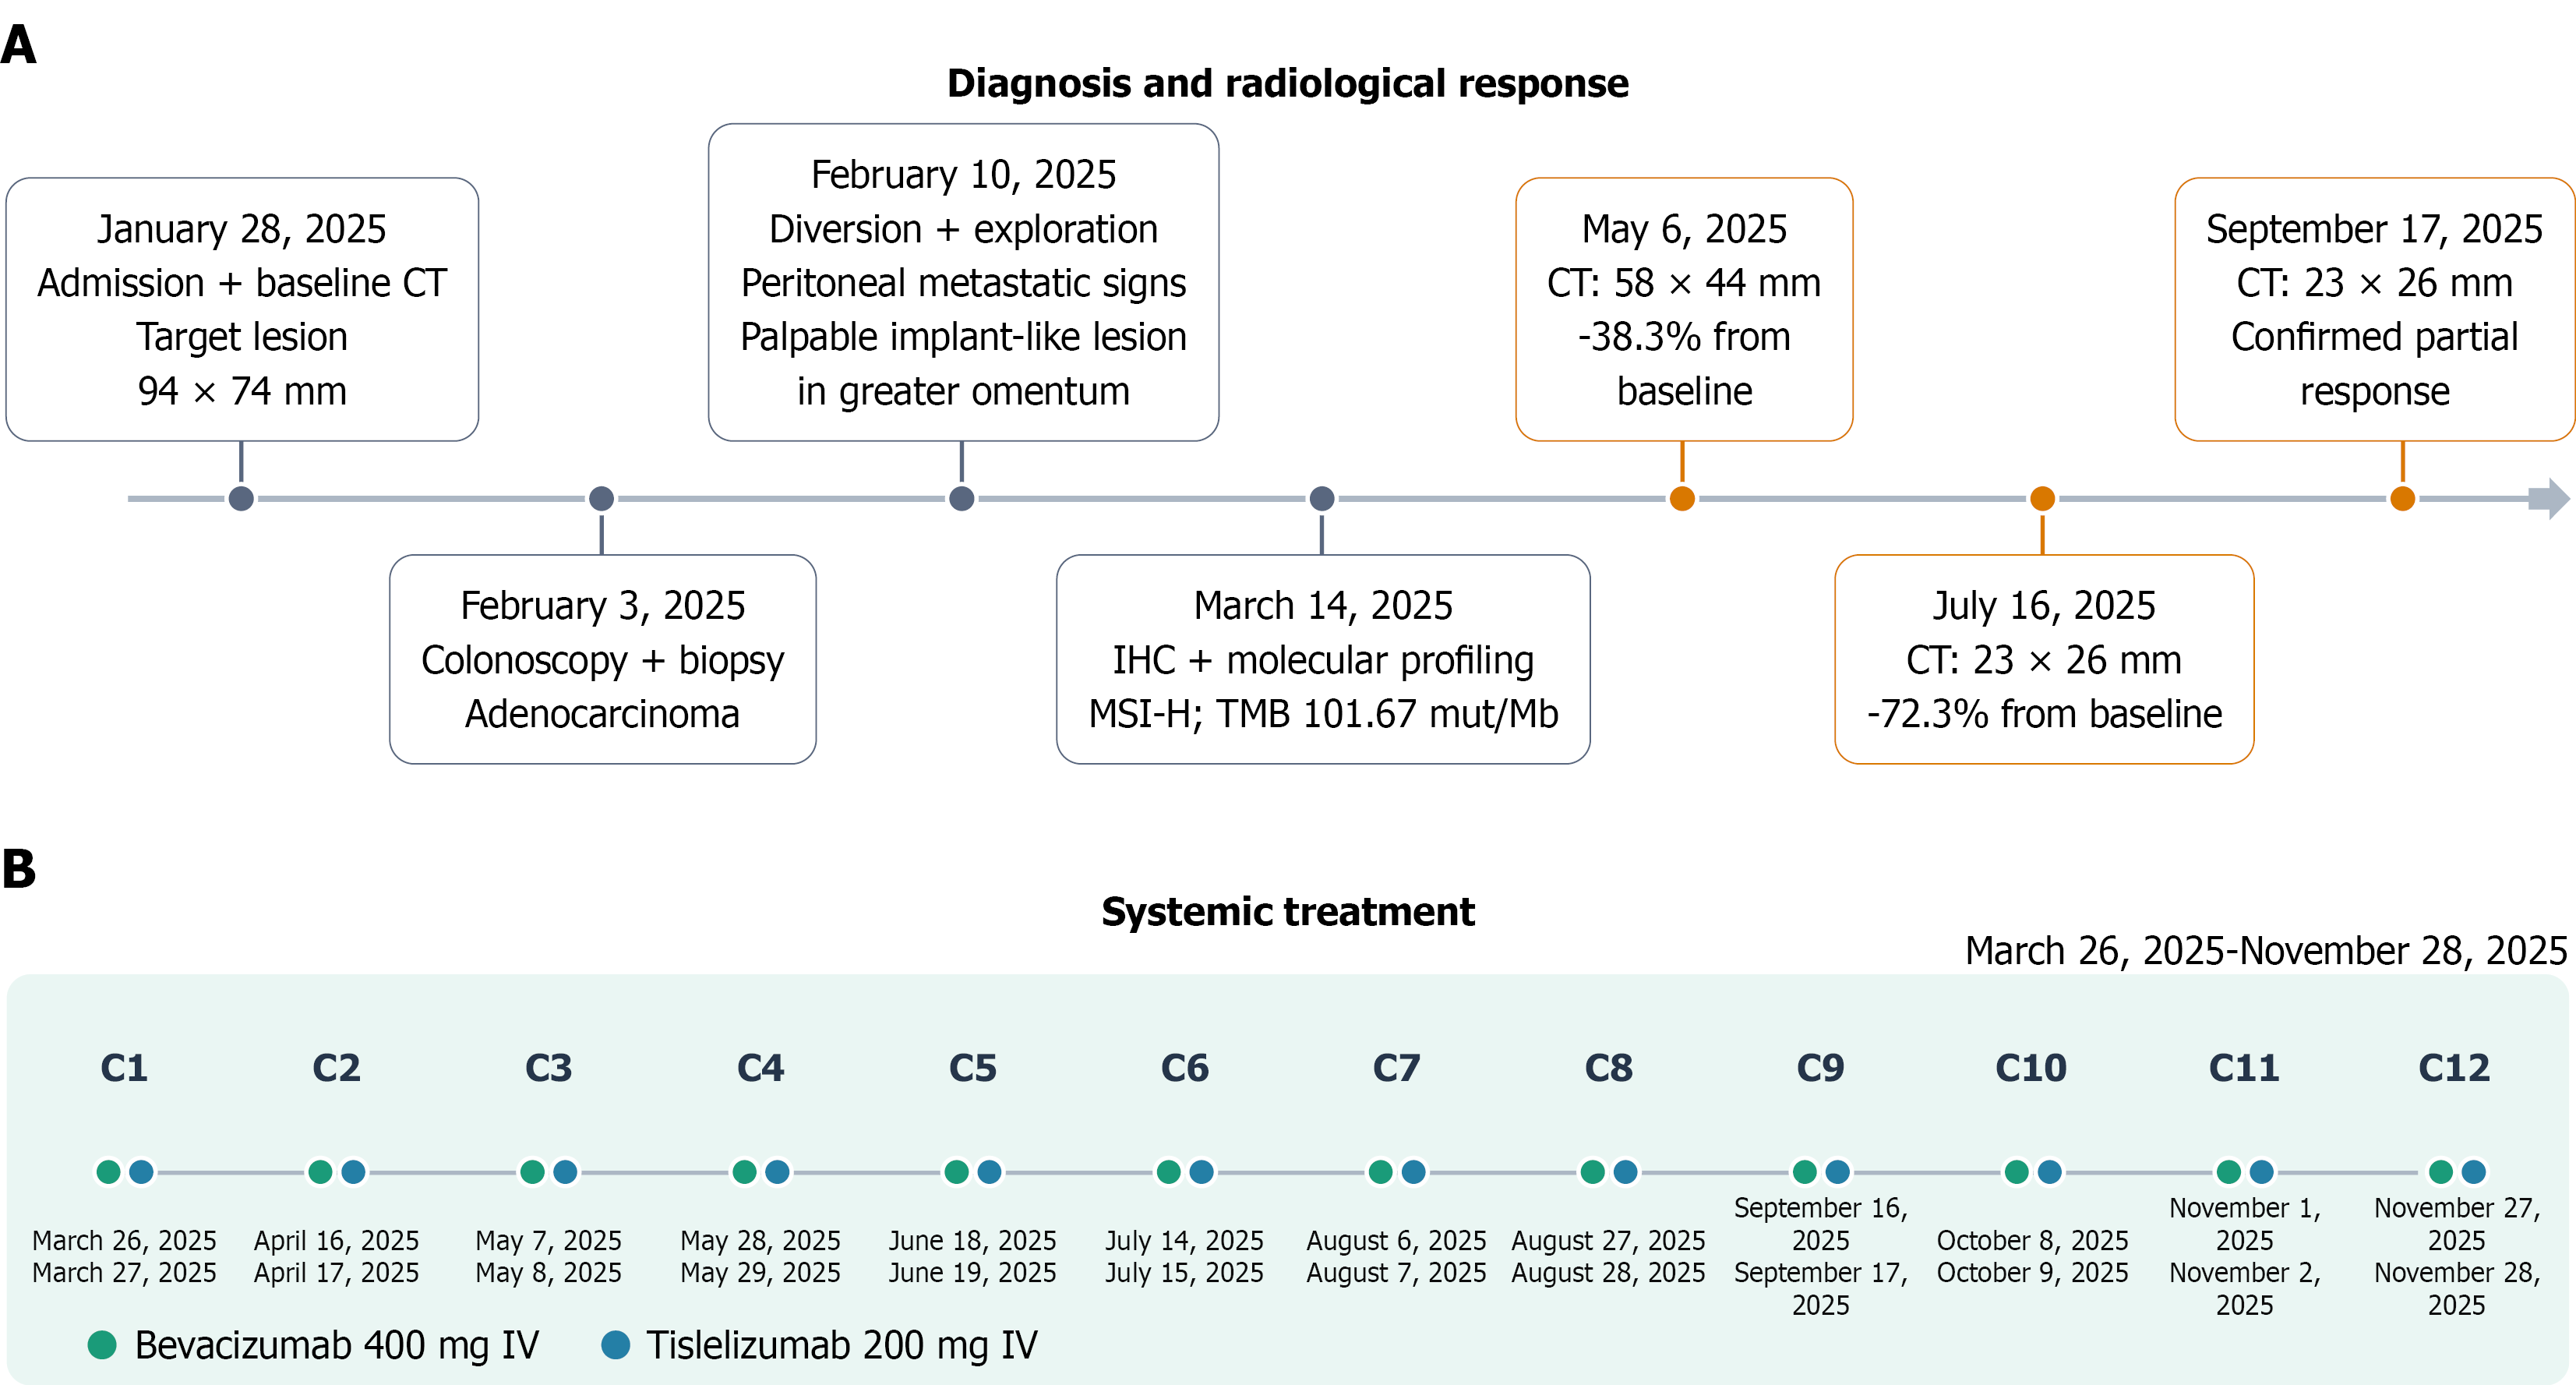
Figure 5 Timeline flowchart of patient’s diagnosis and treatment.
A: Diagnostic and radiological milestones; B: Twelve treatment cycles (from March 26 to November 28, 2025): Bevacizumab 400 mg followed 1 day later by tislelizumab 200 mg, every 3 weeks. CT: Computed tomography; MSI-H: Microsatellite instability-high; TMB: Tumor mutational burden.
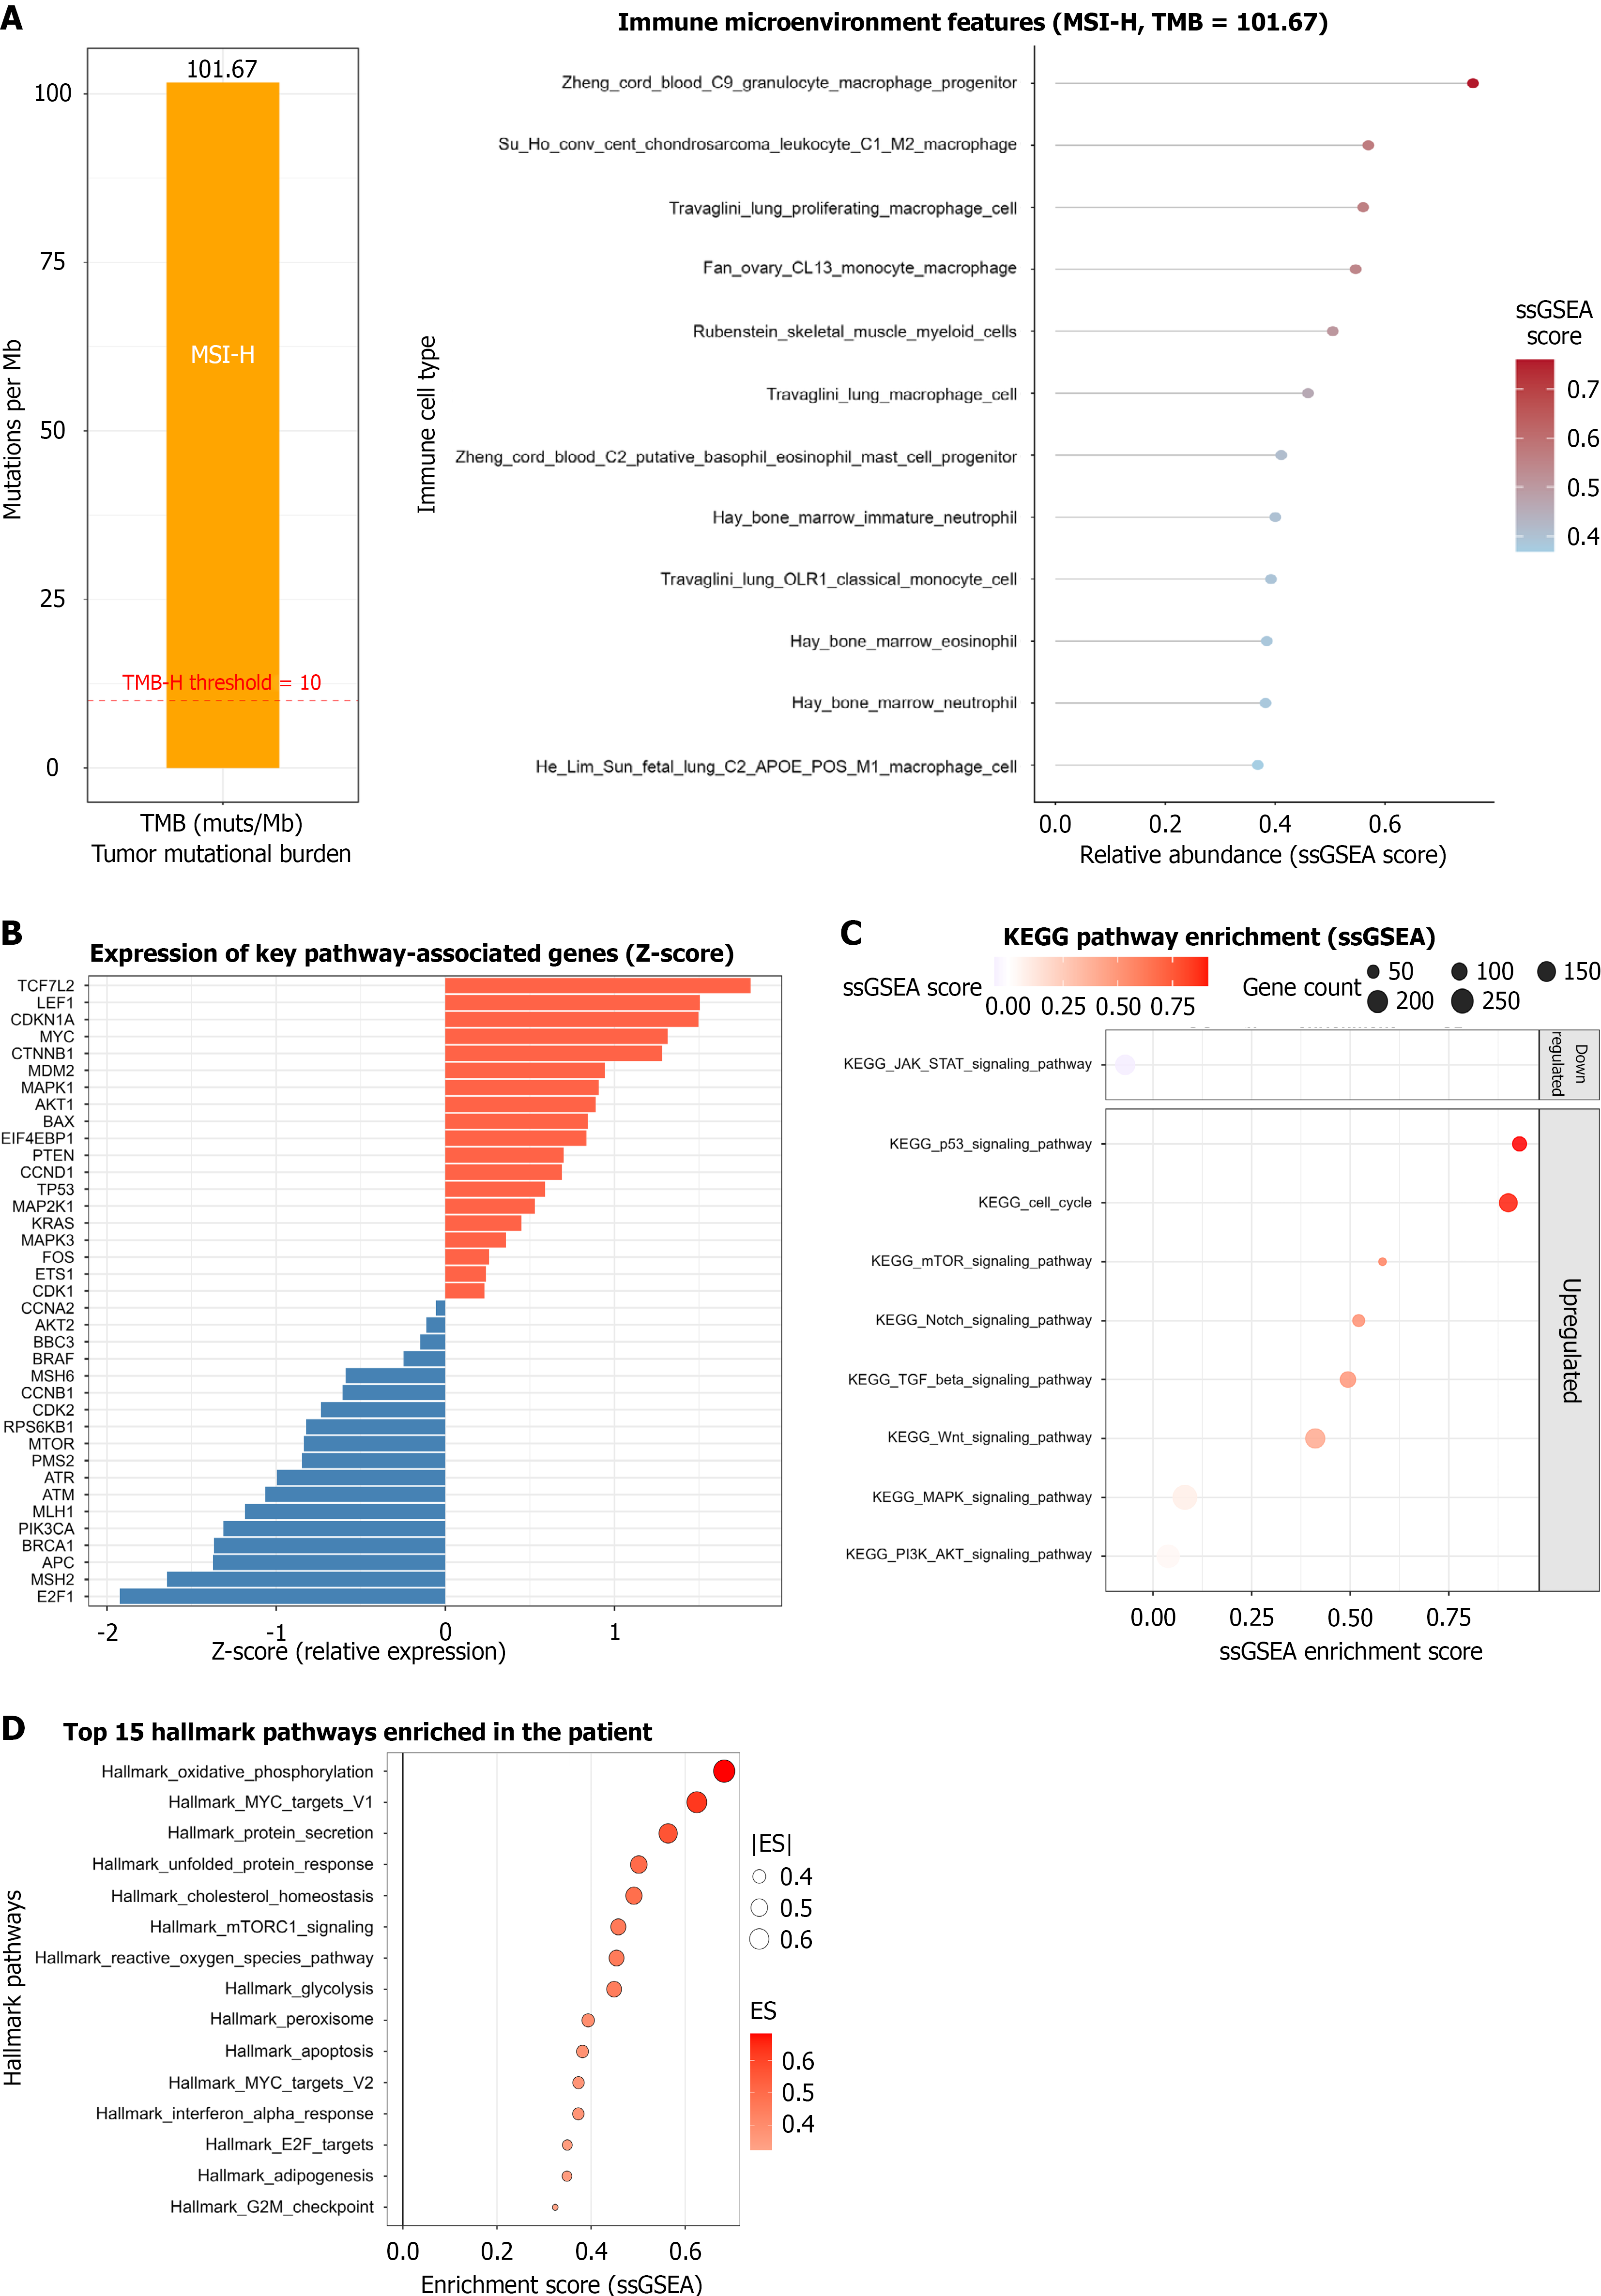
Figure 6 Summary of molecular features and pathway activities in the patient with colon cancer.
A: Tumor mutation burden, microsatellite instability status, and immune-microenvironment features; B: Relative expression (Z scores) of selected genes; C: Kyoto Encyclopedia of Genes and Genomes pathway single sample gene set enrichment analysis; D: Hallmark pathway single sample gene set enrichment analysis. ssGSEA: Single sample gene set enrichment analysis.
- Citation: Chen YF, Huang C, Chen ZJ, Wang ZH. Significant response to tislelizumab plus bevacizumab in a patient with microsatellite instability-high colon cancer: A case report and review of literature. World J Gastroenterol 2027; 33(2): 124393
- URL: https://www.wjgnet.com/1007-9327/full/v33/i2/124393.htm
- DOI: https://dx.doi.org/10.3748/wjg.124393