
















Copyright: ©Author(s) 2027.
World J Gastroenterol. Jan 14, 2027; 33(2): 123195
Published online Jan 14, 2027. doi: 10.3748/wjg.123195
Published online Jan 14, 2027. doi: 10.3748/wjg.123195
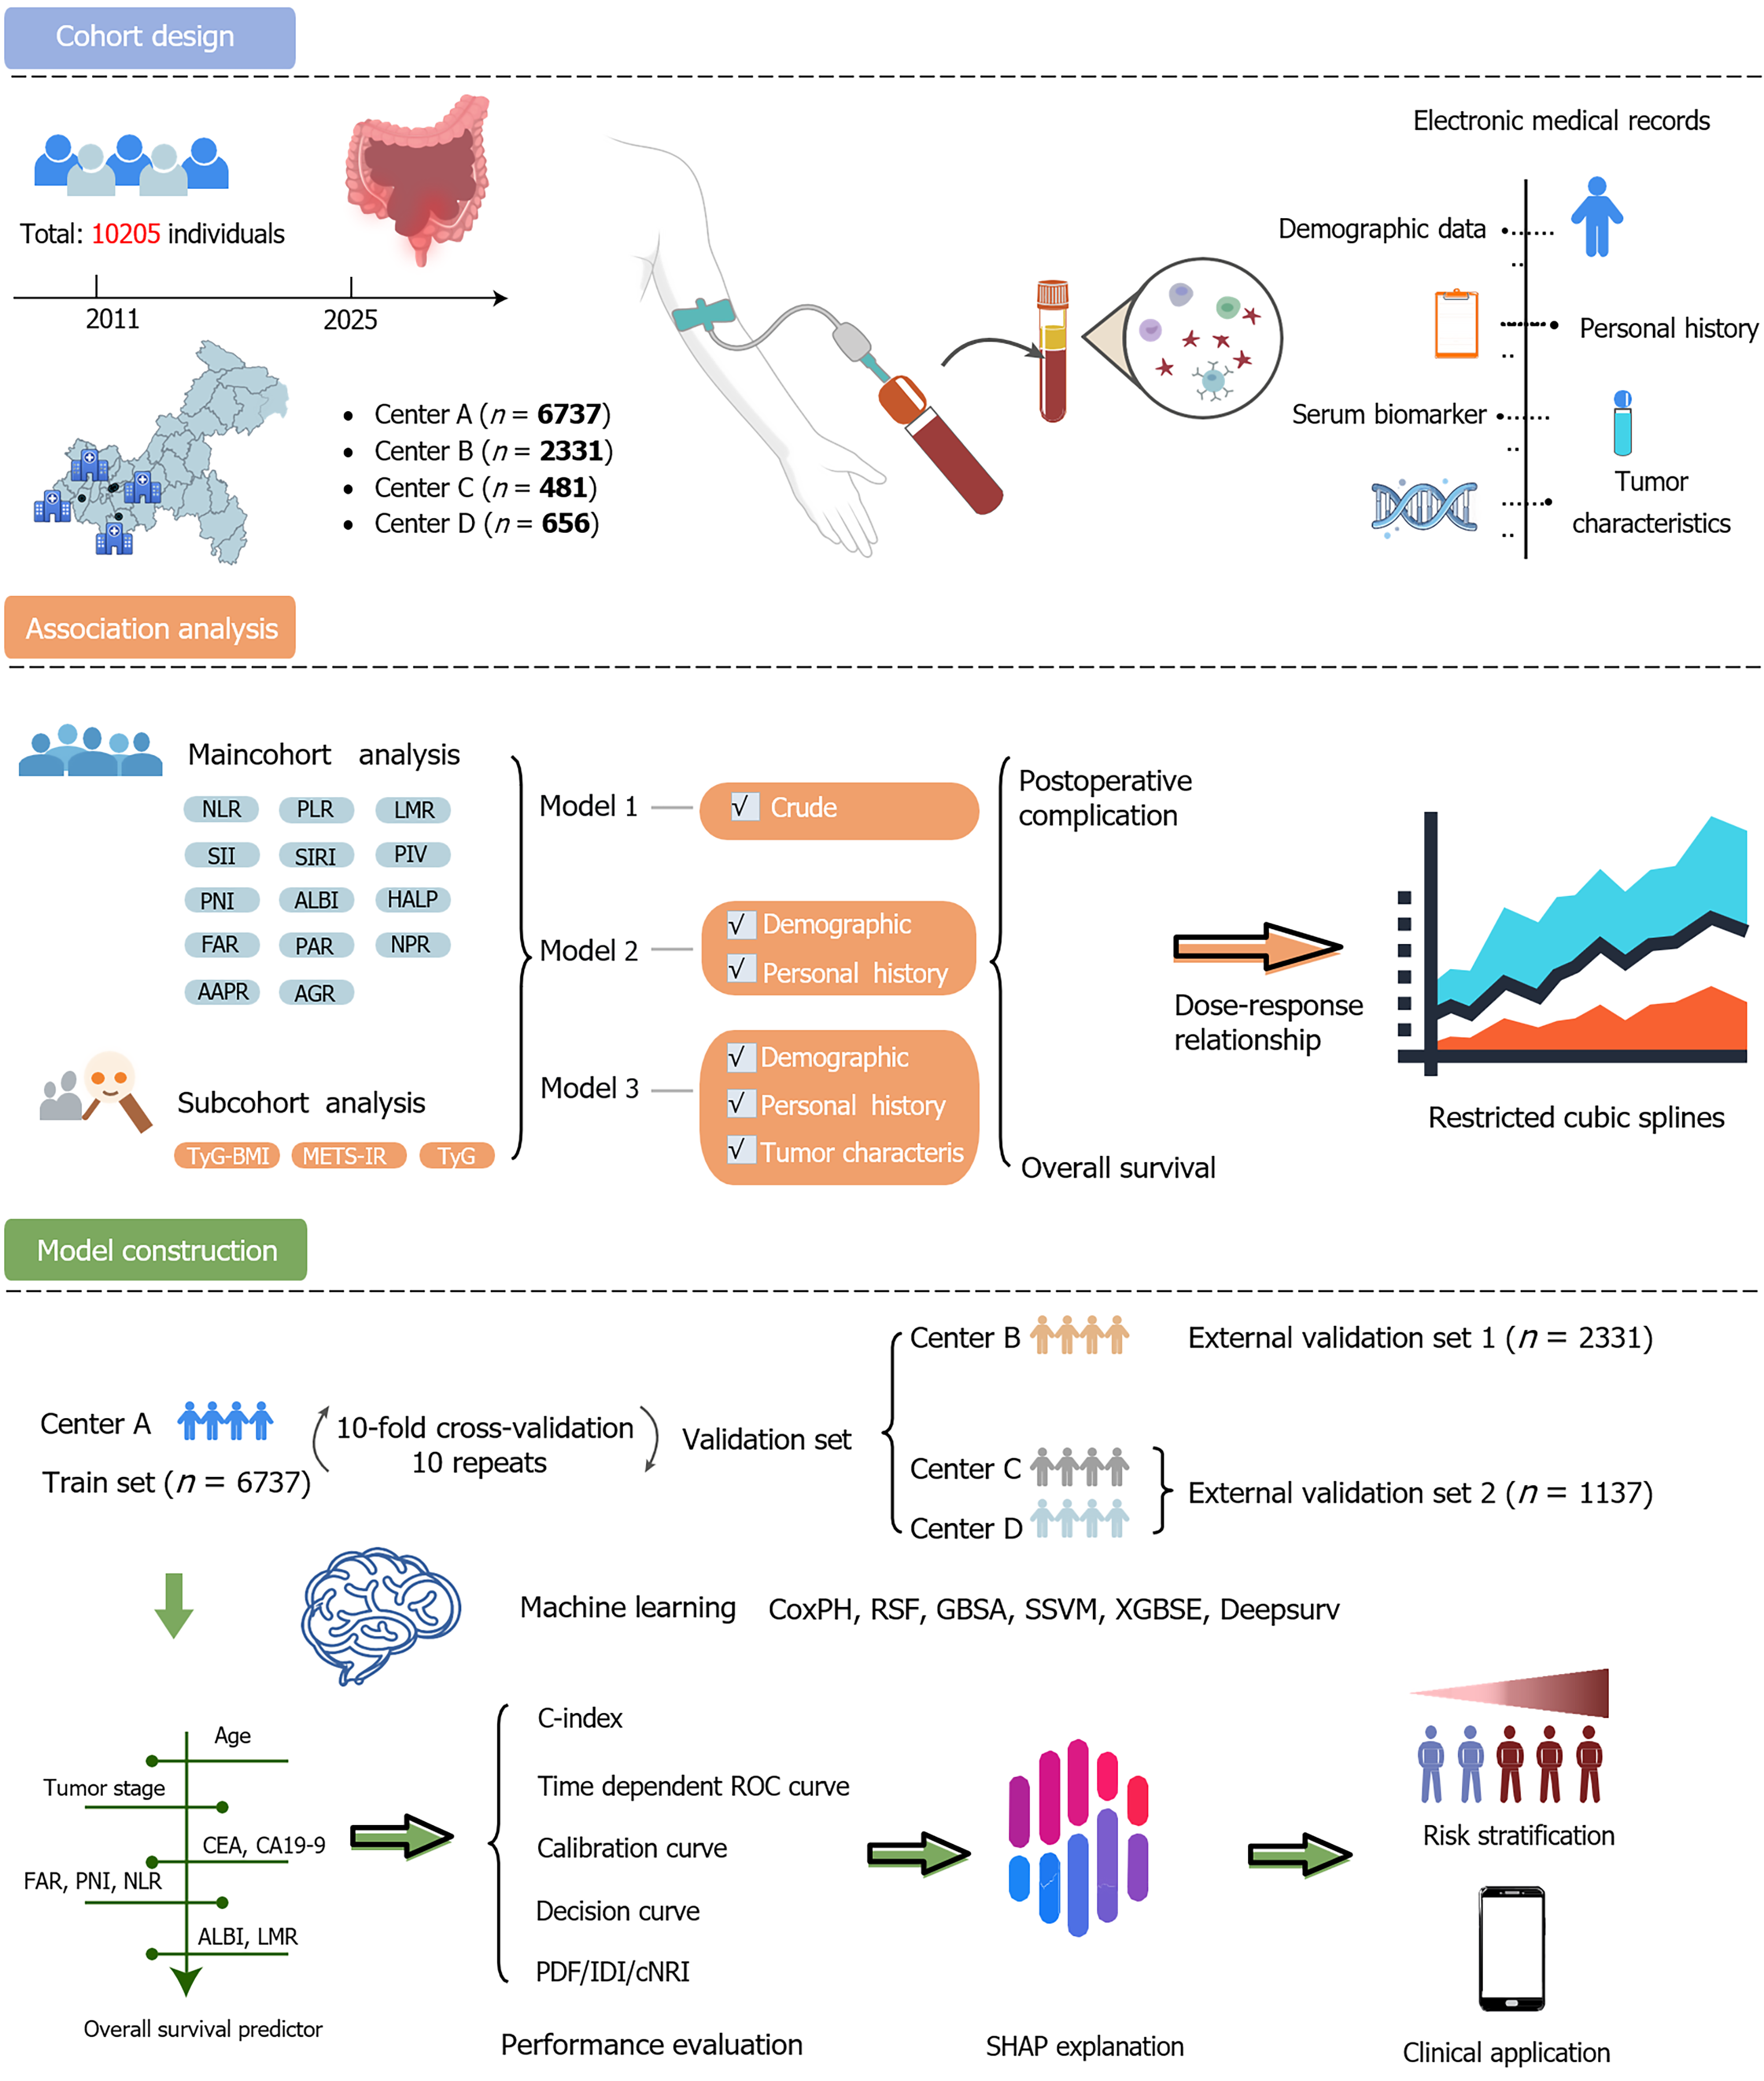
Figure 1 Graphical abstract of the study design and analytical workflow.
AAPR: Albumin-to-alkaline phosphatase ratio; AGR: Albumin-to-globulin ratio; ALBI: Albumin-bilirubin index; BMI: Body mass index; C-index: Harrell’s concordance index; CA19-9: Carbohydrate antigen 19-9; CEA: Carcinoembryonic antigen; cNRI: Continuous net reclassification improvement; CoxPH: Cox proportional hazards; FAR: Fibrinogen-to-albumin ratio; GBSA: Gradient boosting survival analysis; HALP: Hemoglobin, albumin, lymphocyte, and platelet score; IDI: Integrated discrimination improvement; LMR: Lymphocyte-to-monocyte ratio; METS-IR: Metabolic score for insulin resistance; NLR: Neutrophil-to-lymphocyte ratio; NPR: Neutrophil-to-platelet ratio; PAR: Platelet-to-albumin ratio; PDF: Probability density function; PIV: Pan-immune-inflammation value; PLR: Platelet-to-lymphocyte ratio; PNI: Prognostic nutritional index; ROC: Receiver operating characteristic; RSF: Random survival forest; SHAP: SHapley Additive exPlanations; SII: Systemic immune-inflammation index; SIRI: Systemic inflammation response index; SSVM: Survival support vector machine; TyG: Triglyceride-glucose; XGBSE: EXtreme gradient boosting for survival embeddings.
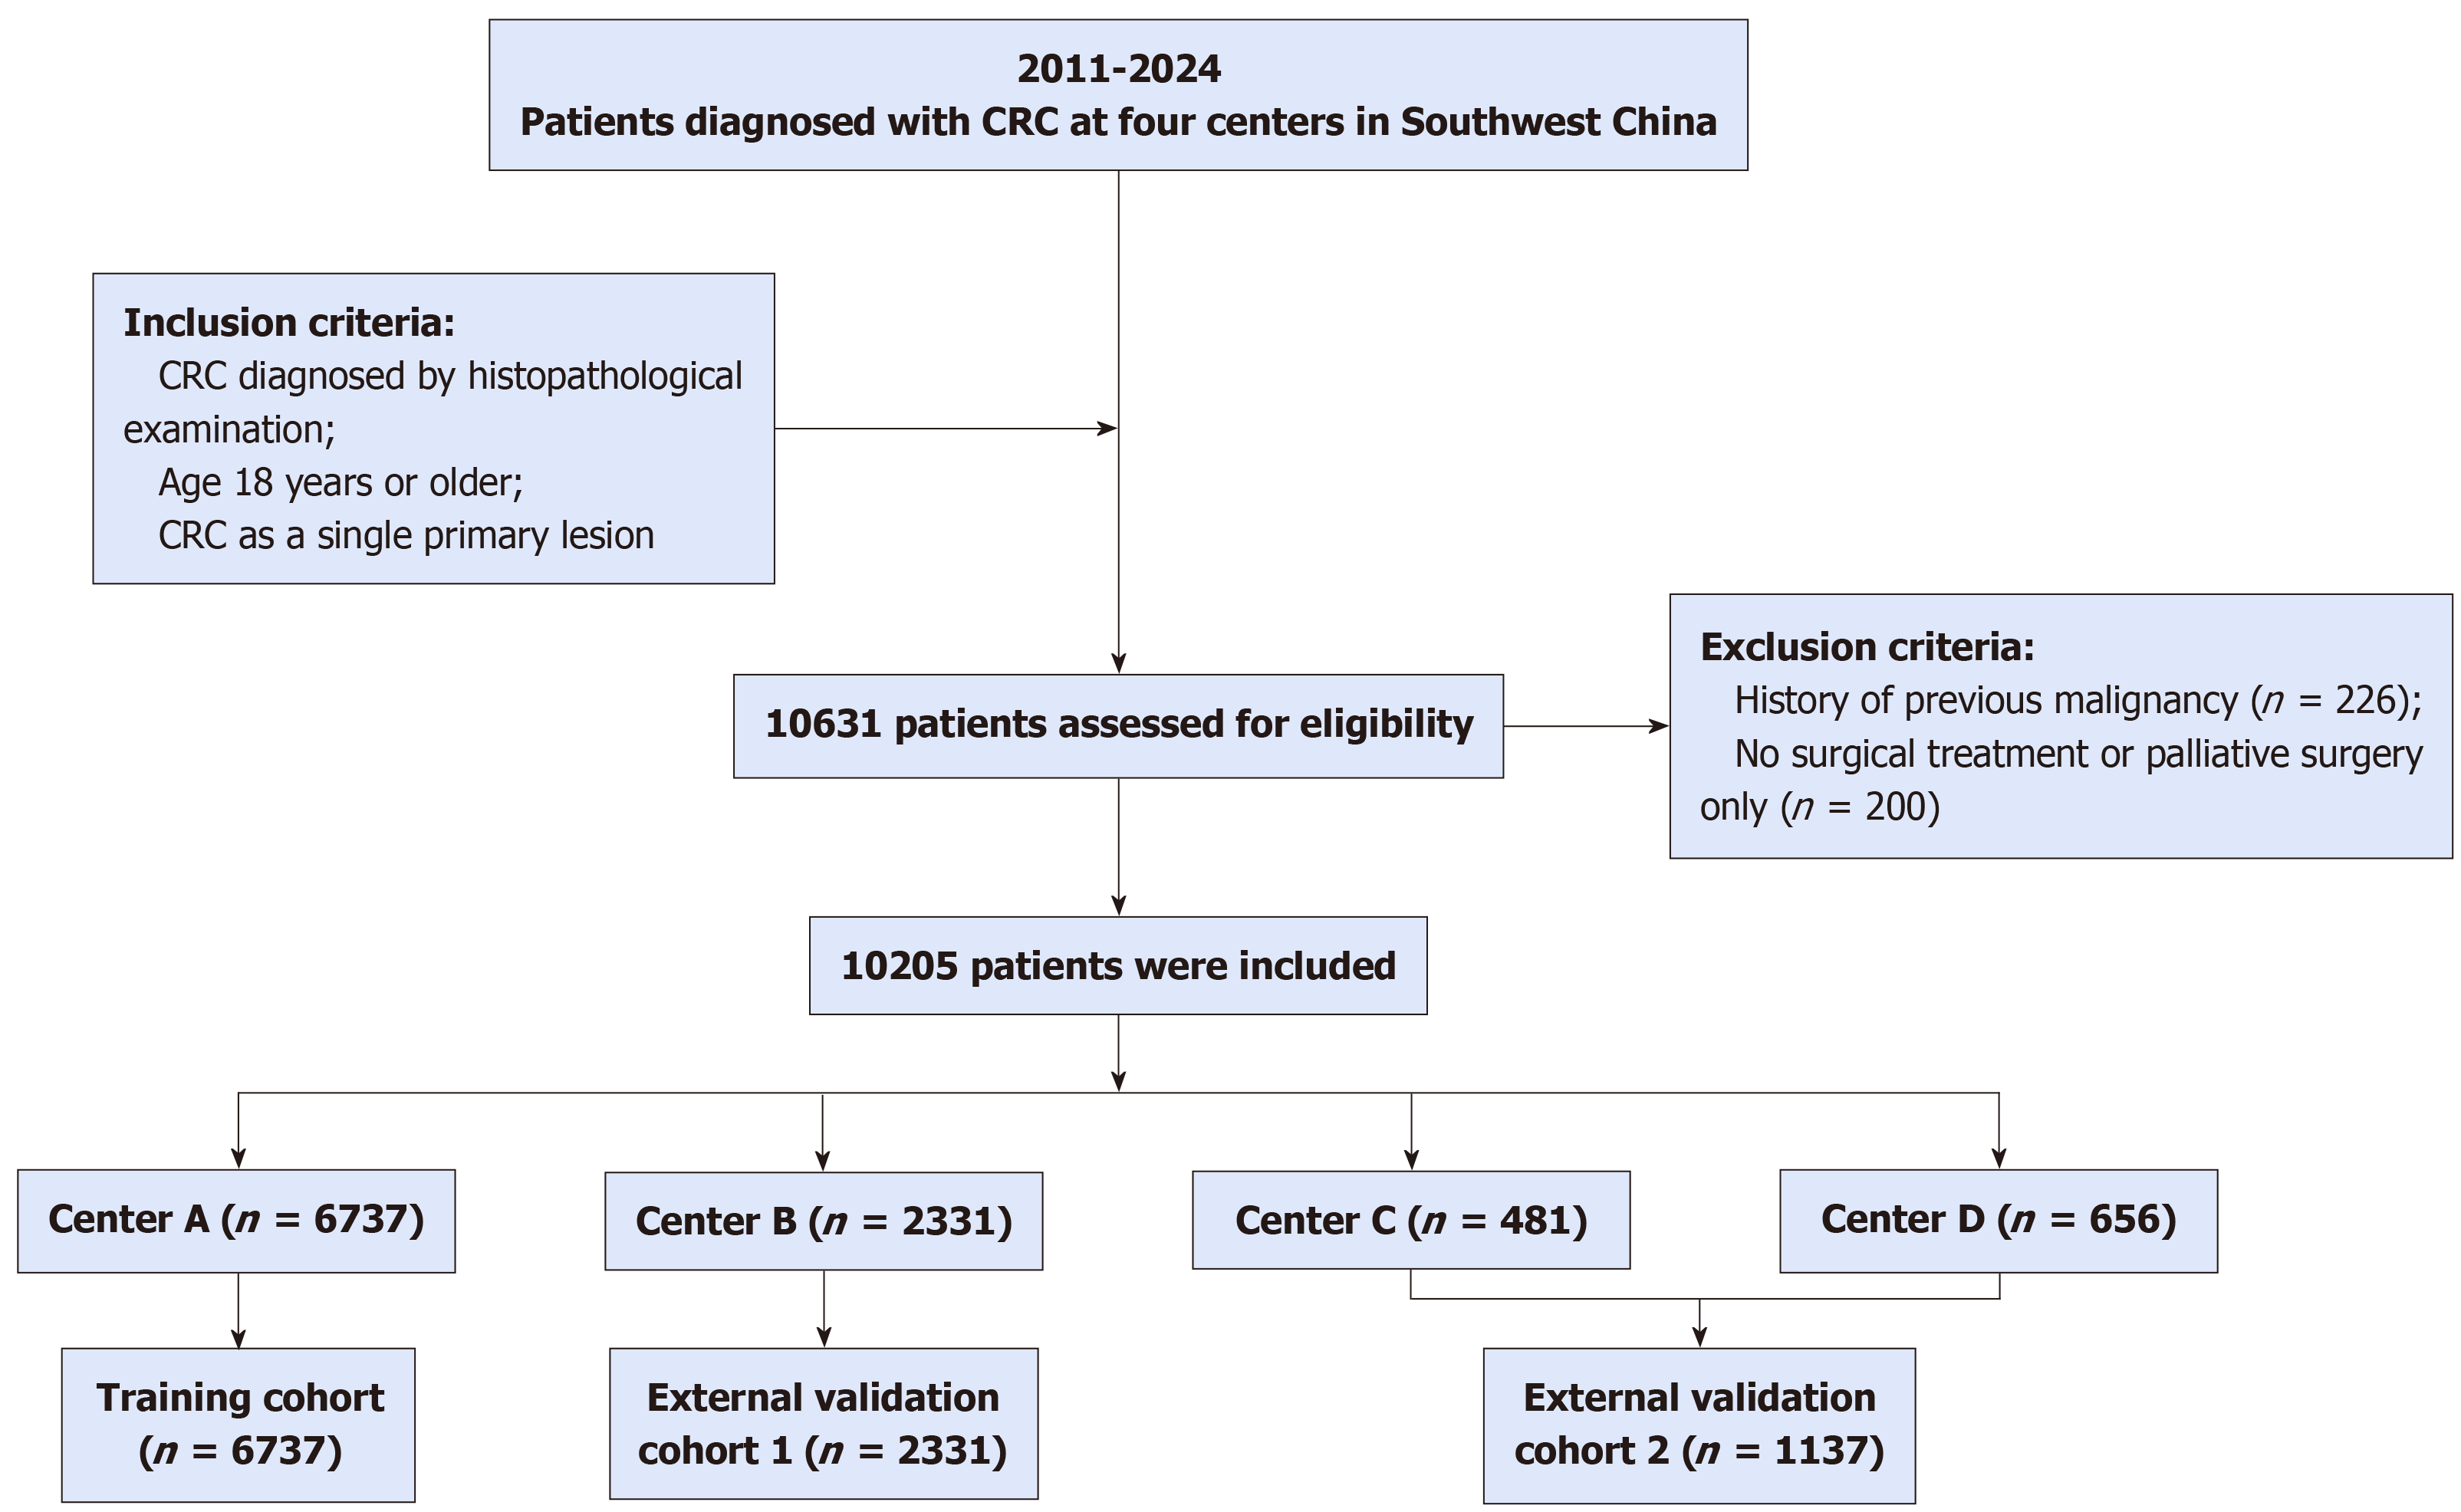
Figure 2 Flow diagram of patient inclusion and study design.
CRC: Colorectal cancer.
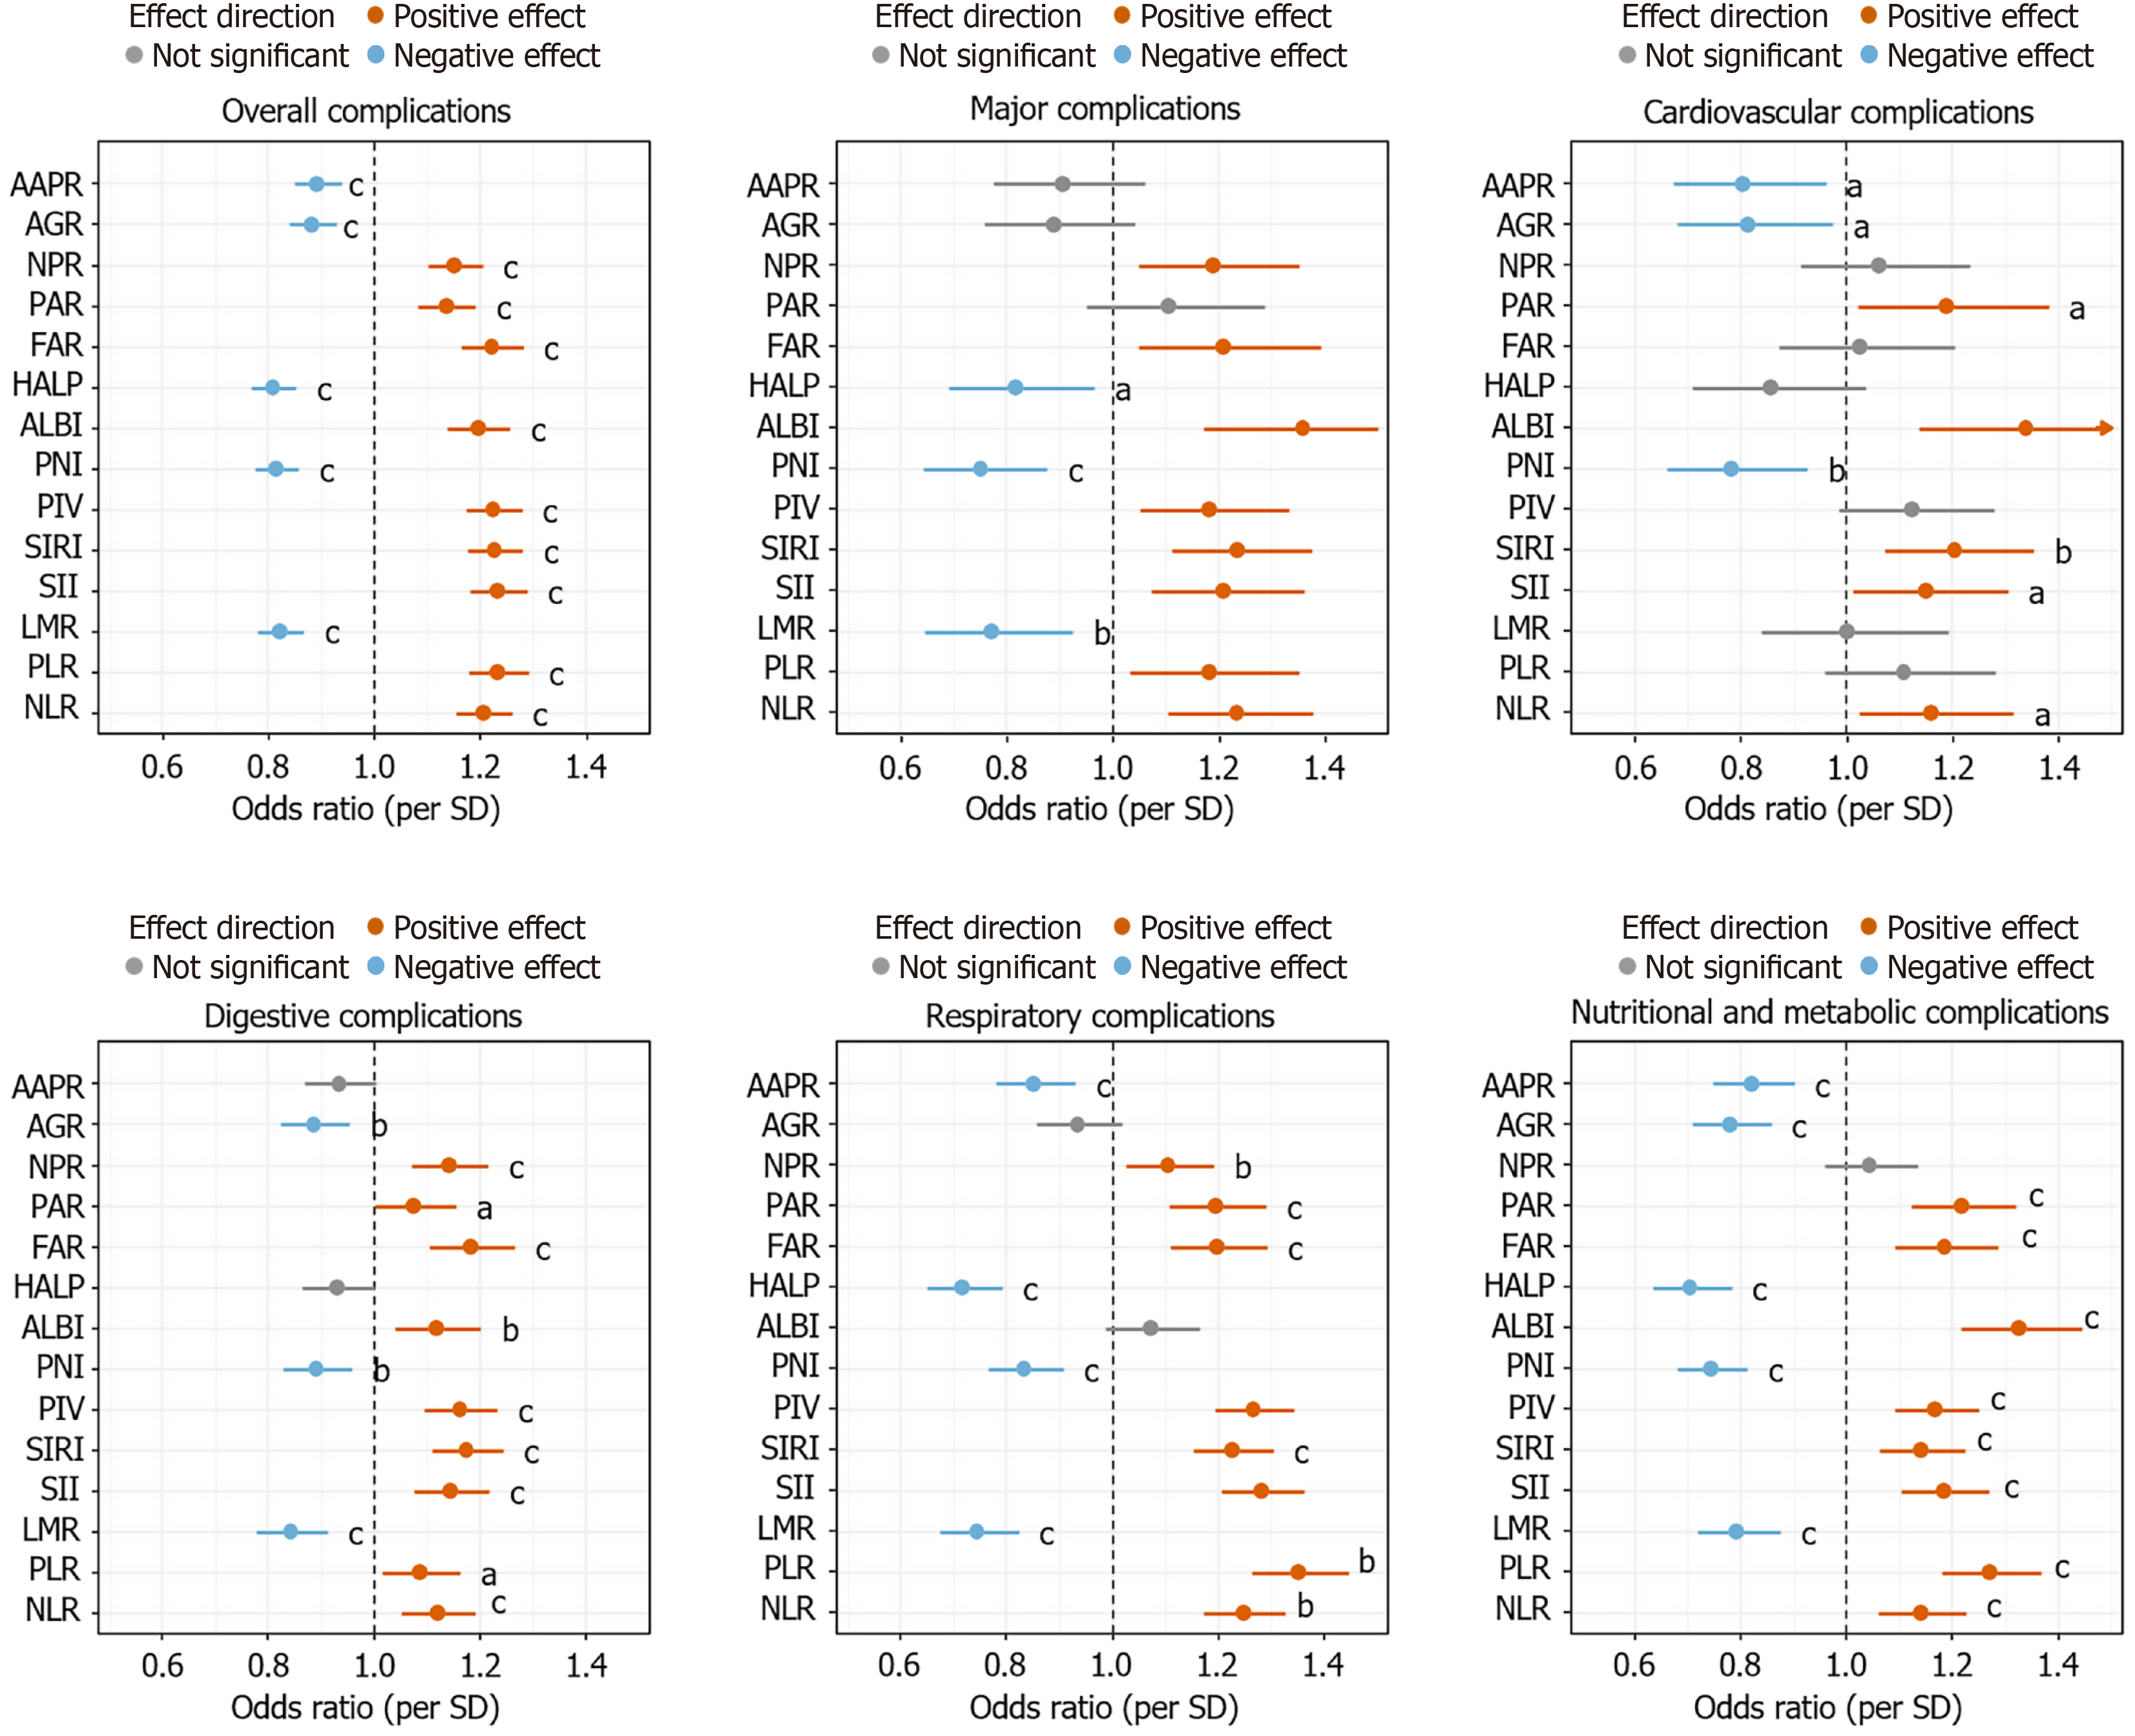
Figure 3 Associations between systemic inflammation- and nutrition-related indicators and post-operative complication.
aP < 0.05. bP < 0.01. cP < 0.001. AAPR: Albumin-to-alkaline phosphatase ratio; AGR: Albumin-to-globulin ratio; ALBI: Albumin-bilirubin index; FAR: Fibrinogen-to-albumin ratio; HALP: Hemoglobin, albumin, lymphocyte, and platelet score; LMR: Lymphocyte-to-monocyte ratio; NLR: Neutrophil-to-lymphocyte ratio; NPR: Neutrophil-to-platelet ratio; PAR: Platelet-to-albumin ratio; PIV: Pan-immune-inflammation value; PLR: Platelet-to-lymphocyte ratio; PNI: Prognostic nutritional index; SII: Systemic immune-inflammation index; SIRI: Systemic inflammation response index.
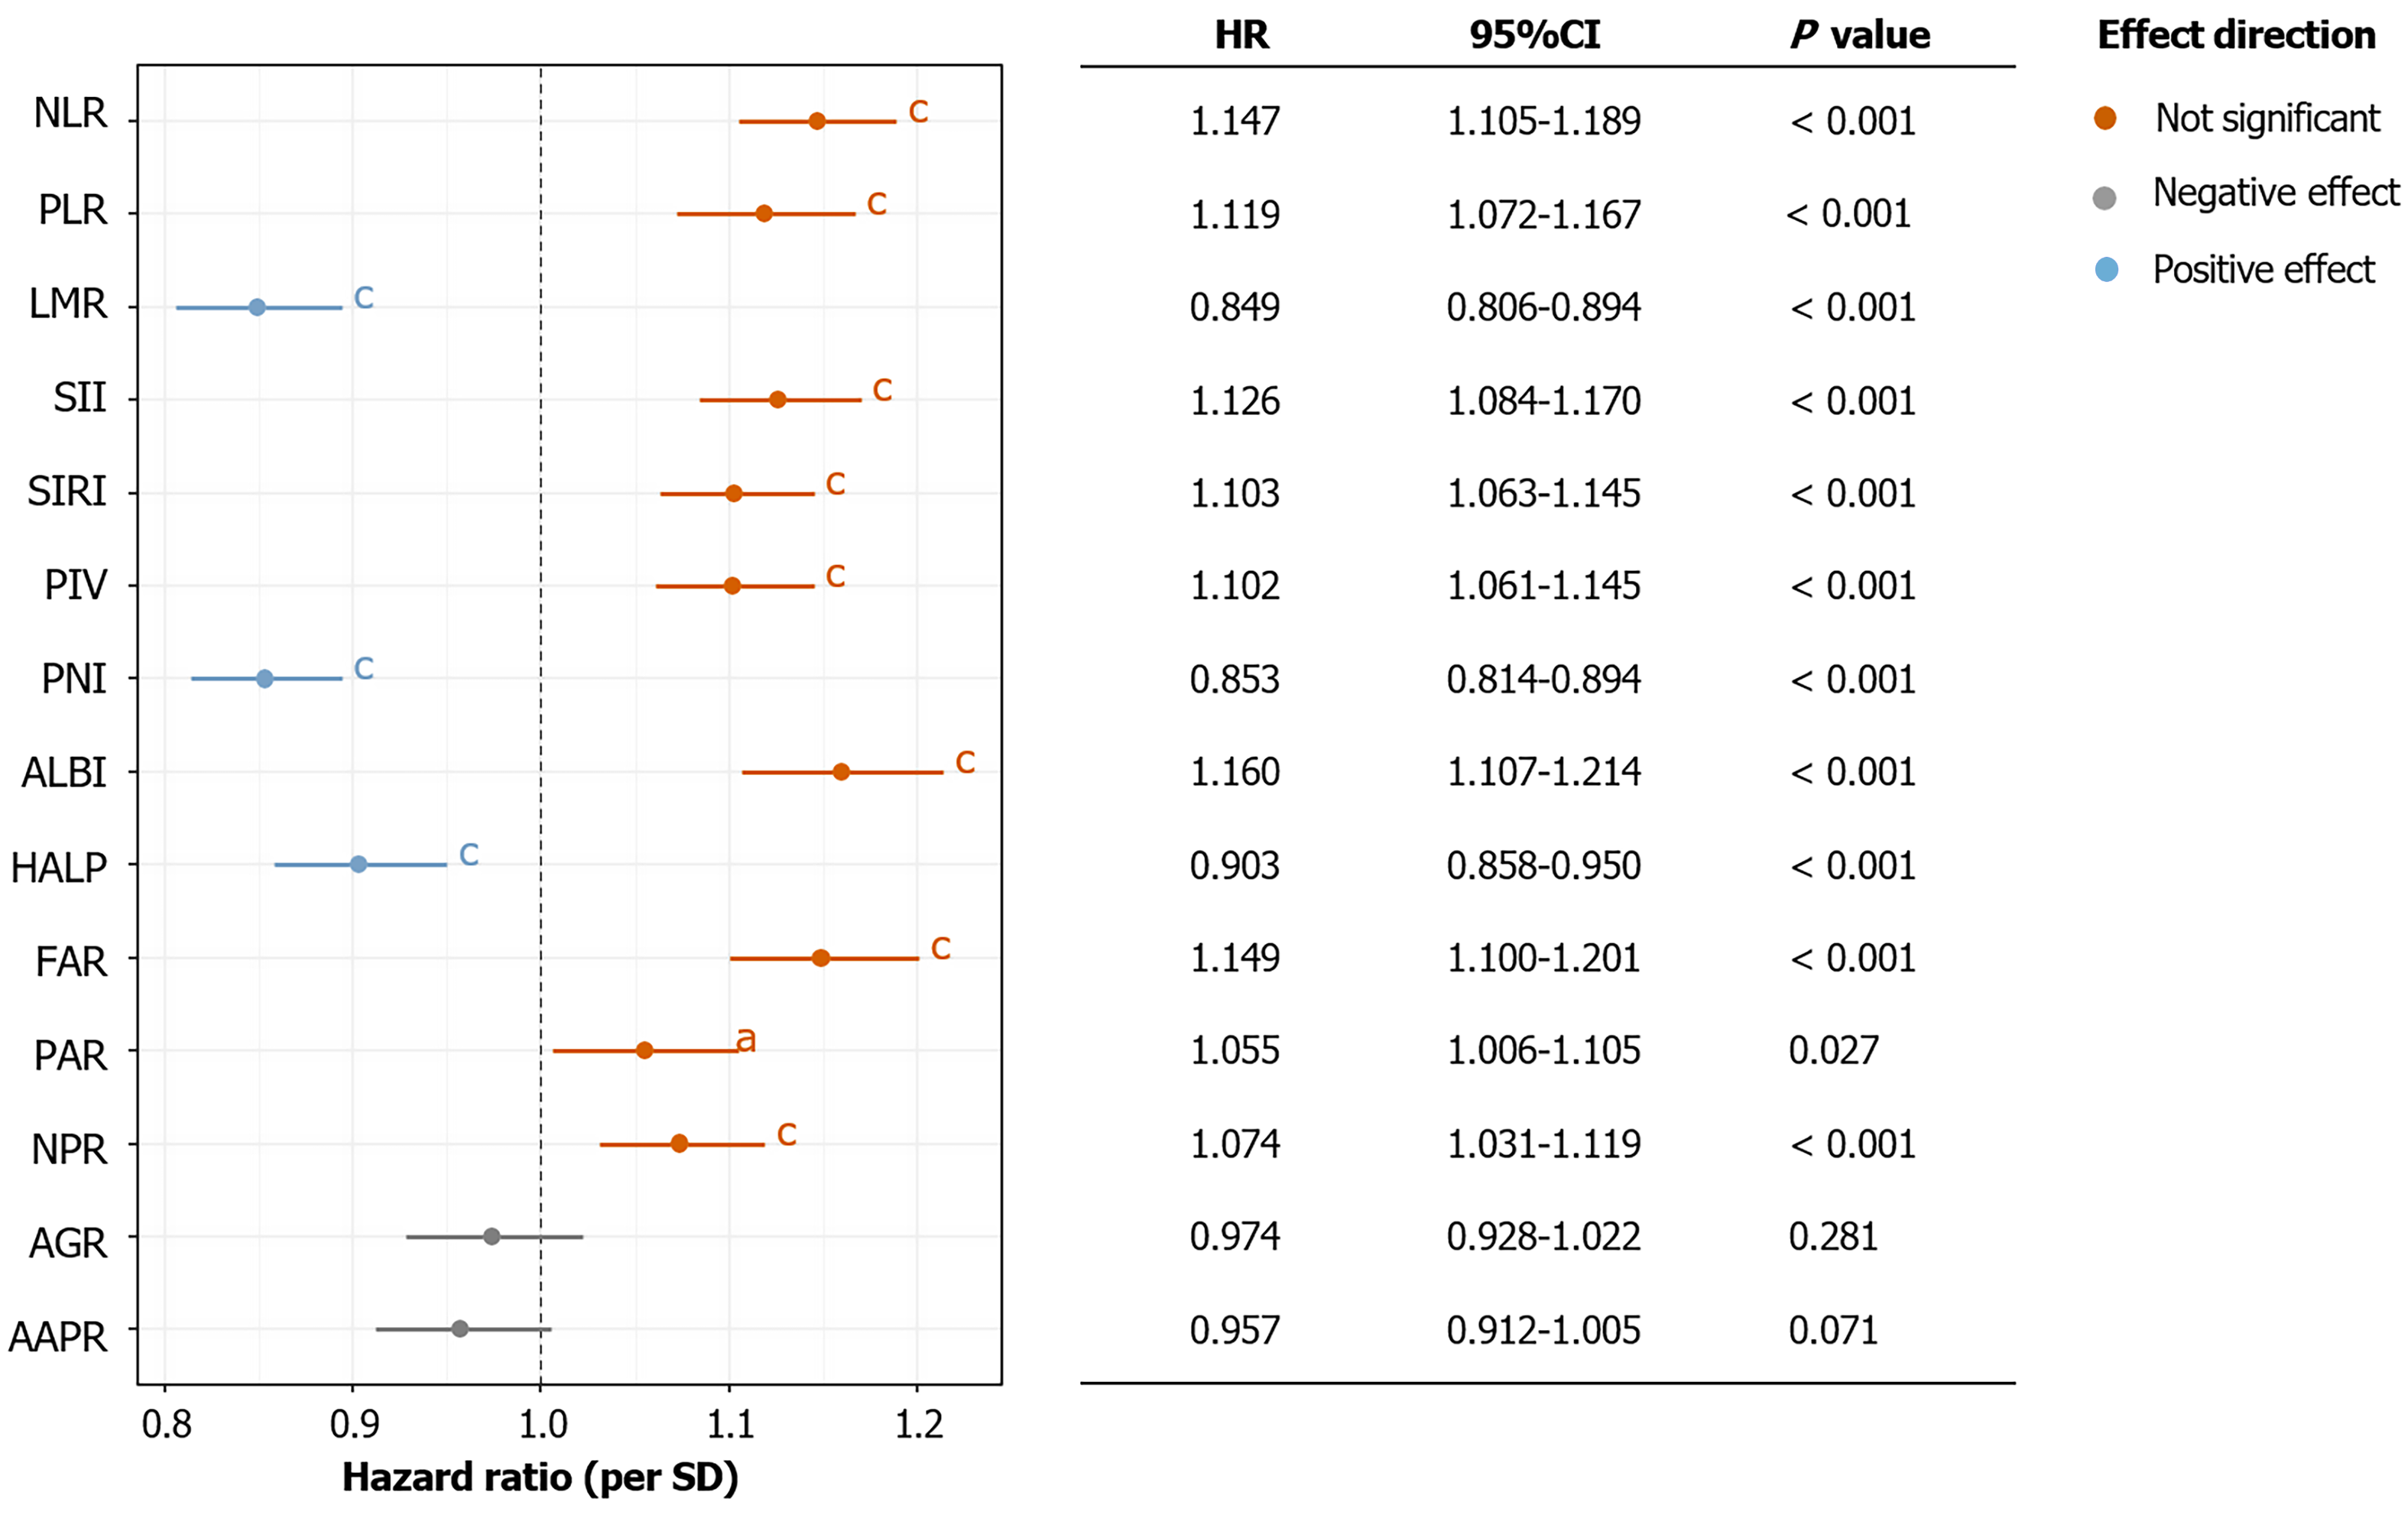
Figure 4 Associations between systemic inflammation- and nutrition-related indicators and overall survival.
aP < 0.05. cP < 0.001. AAPR: Albumin-to-alkaline phosphatase ratio; AGR: Albumin-to-globulin ratio; ALBI: Albumin-bilirubin index; CI: Confidence interval; FAR: Fibrinogen-to-albumin ratio; HALP: Hemoglobin, albumin, lymphocyte, and platelet score; HR: Hazard ratio; LMR: Lymphocyte-to-monocyte ratio; NLR: Neutrophil-to-lymphocyte ratio; NPR: Neutrophil-to-platelet ratio; PAR: Platelet-to-albumin ratio; PIV: Pan-immune-inflammation value; PLR: Platelet-to-lymphocyte ratio; PNI: Prognostic nutritional index; SII: Systemic immune-inflammation index; SIRI: Systemic inflammation response index.
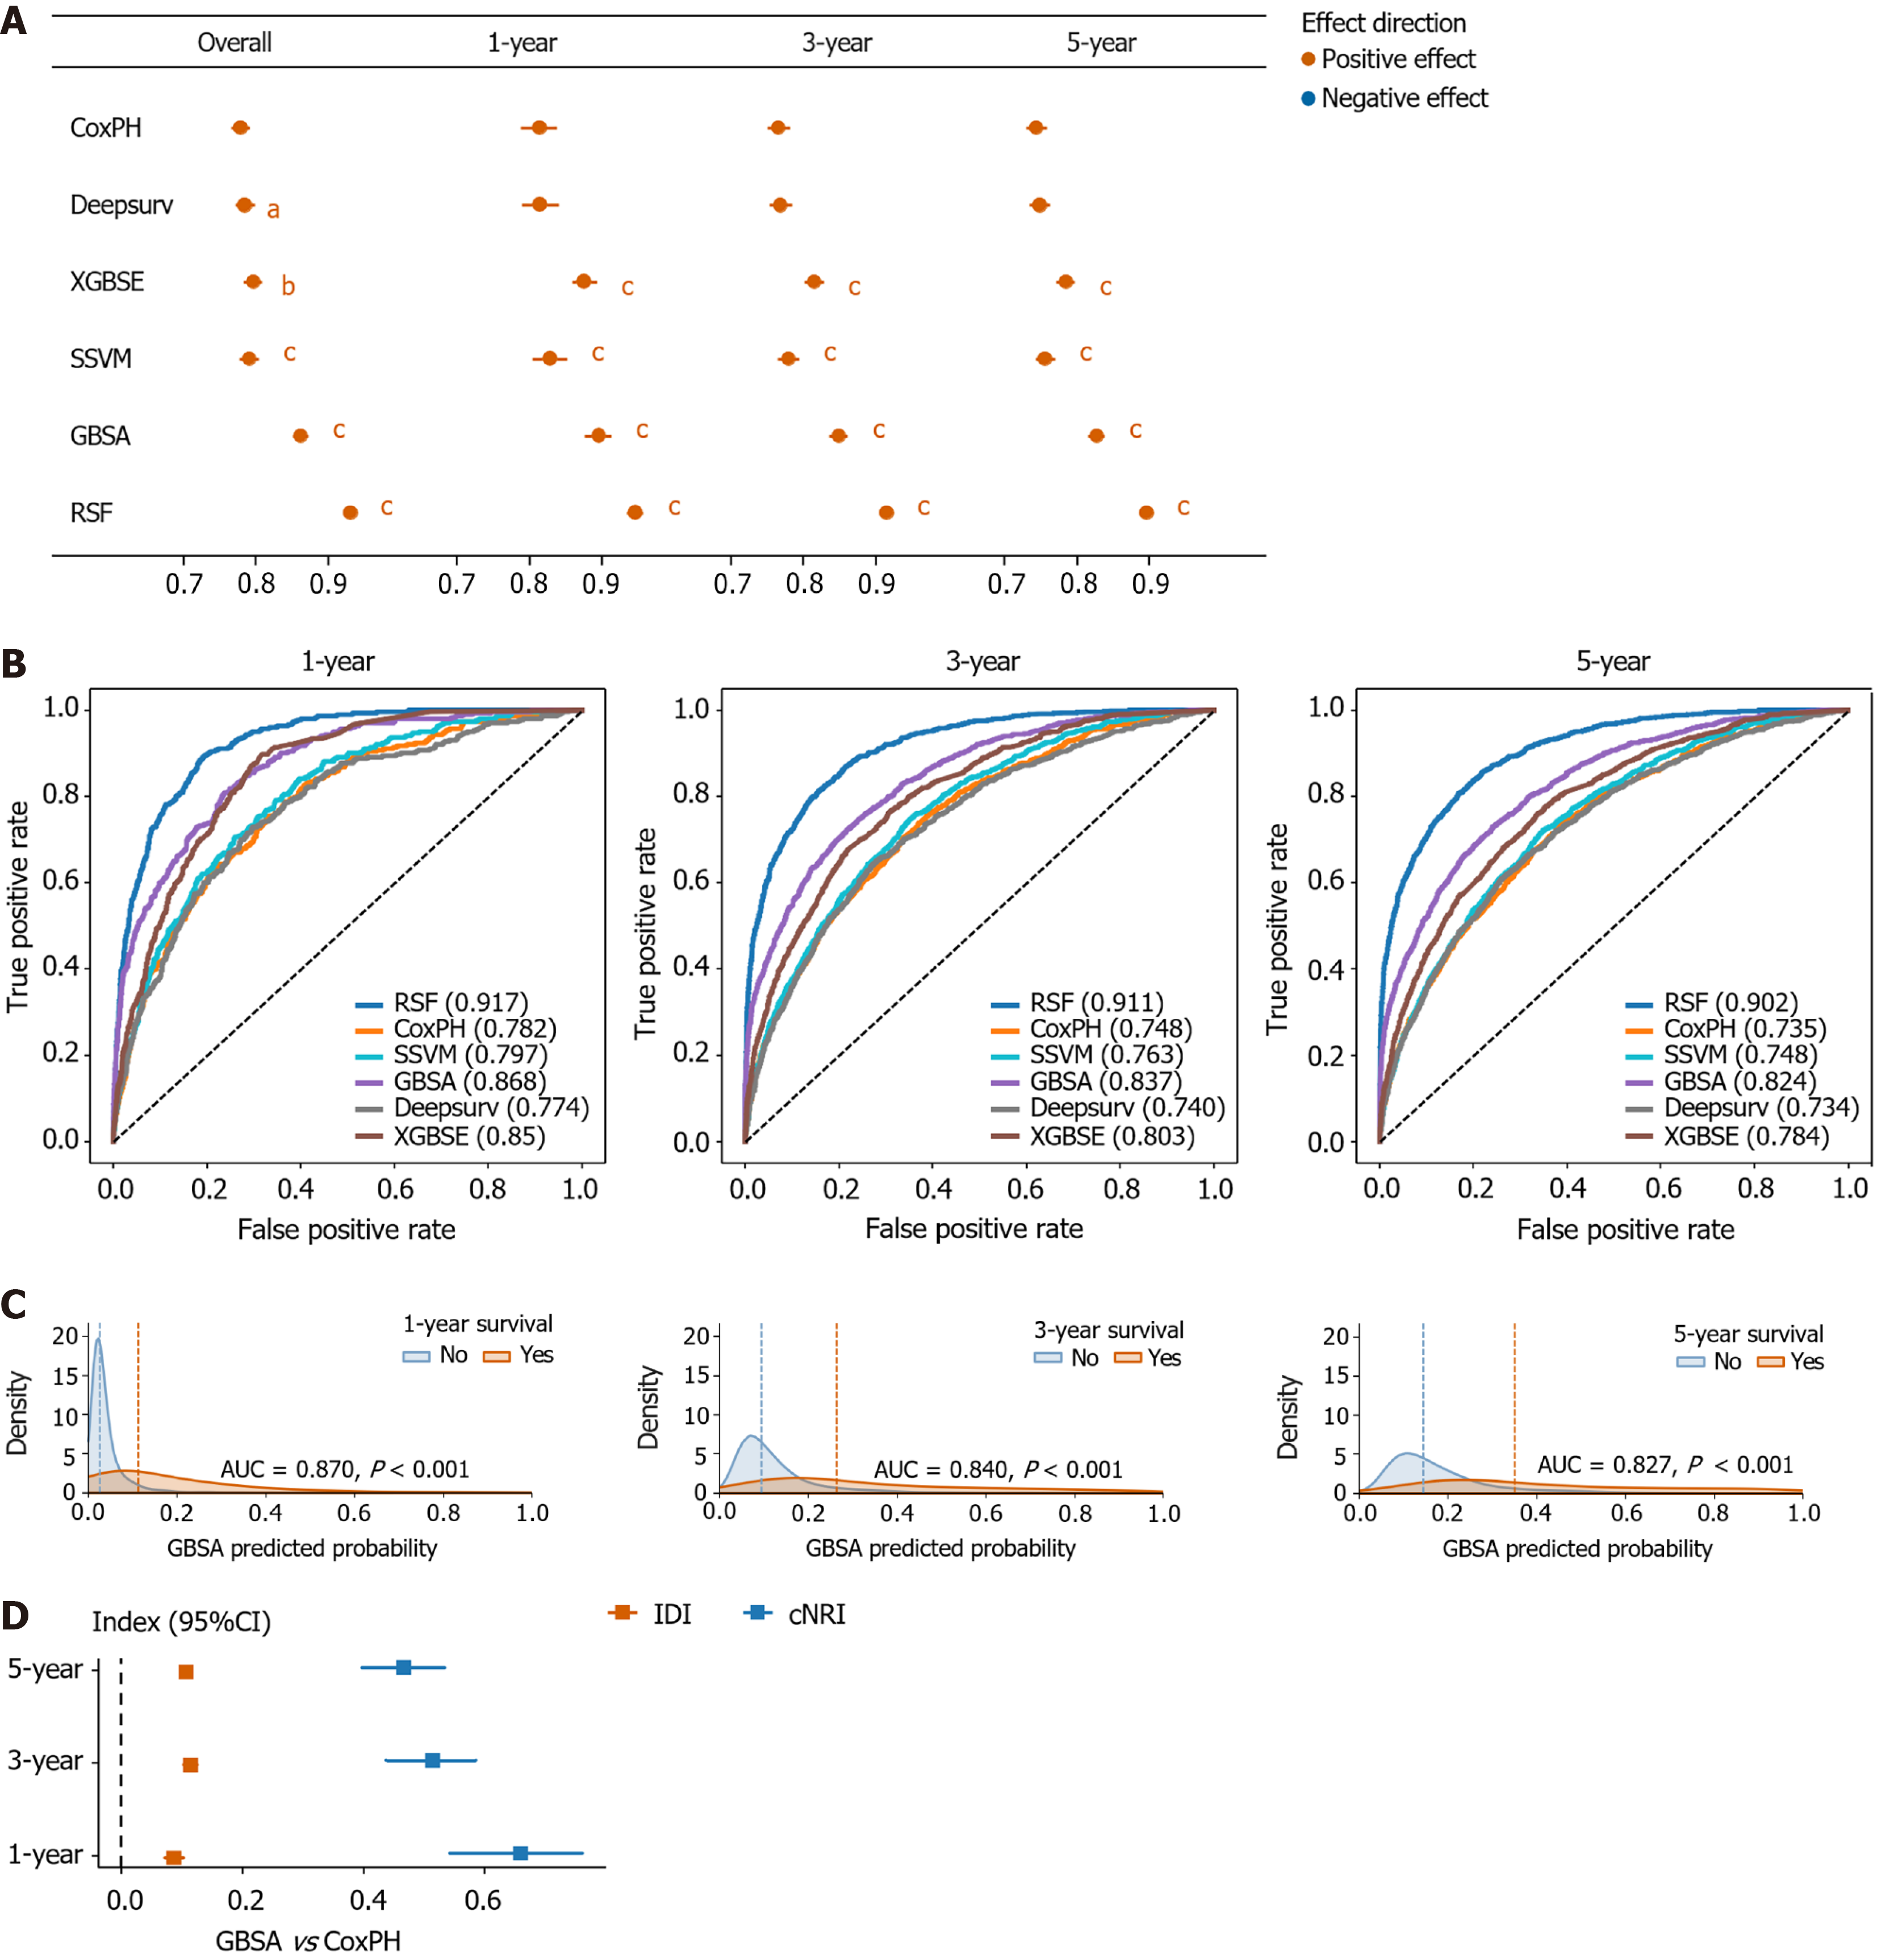
Figure 5 Performance of the prognostic models in the training cohort.
A: Harrell’s concordance index values at overall, 1-year, 3-year, and 5-year time points across models; B: Time-dependent receiver operating characteristic curves at 1-year, 3-year, and 5-year across models; C: Probability density function plots of the gradient boosting survival analysis (GBSA) model for 1-year, 3-year, and 5-year survival prediction; D: Integrated discrimination improvement and continuous net reclassification improvement of the GBSA model compared with the Cox proportional hazards model for 1-year, 3-year, and 5-year survival prediction. aP < 0.05. bP < 0.01. cP < 0.001. AUC: Area under the curve; CI: Confidence interval; cNRI: Continuous net reclassification improvement; CoxPH: Cox proportional hazards; GBSA: Gradient boosting survival analysis; IDI: Integrated discrimination improvement; RSF: Random survival forest; SSVM: Survival support vector machine; XGBSE: EXtreme gradient boosting for survival embeddings.
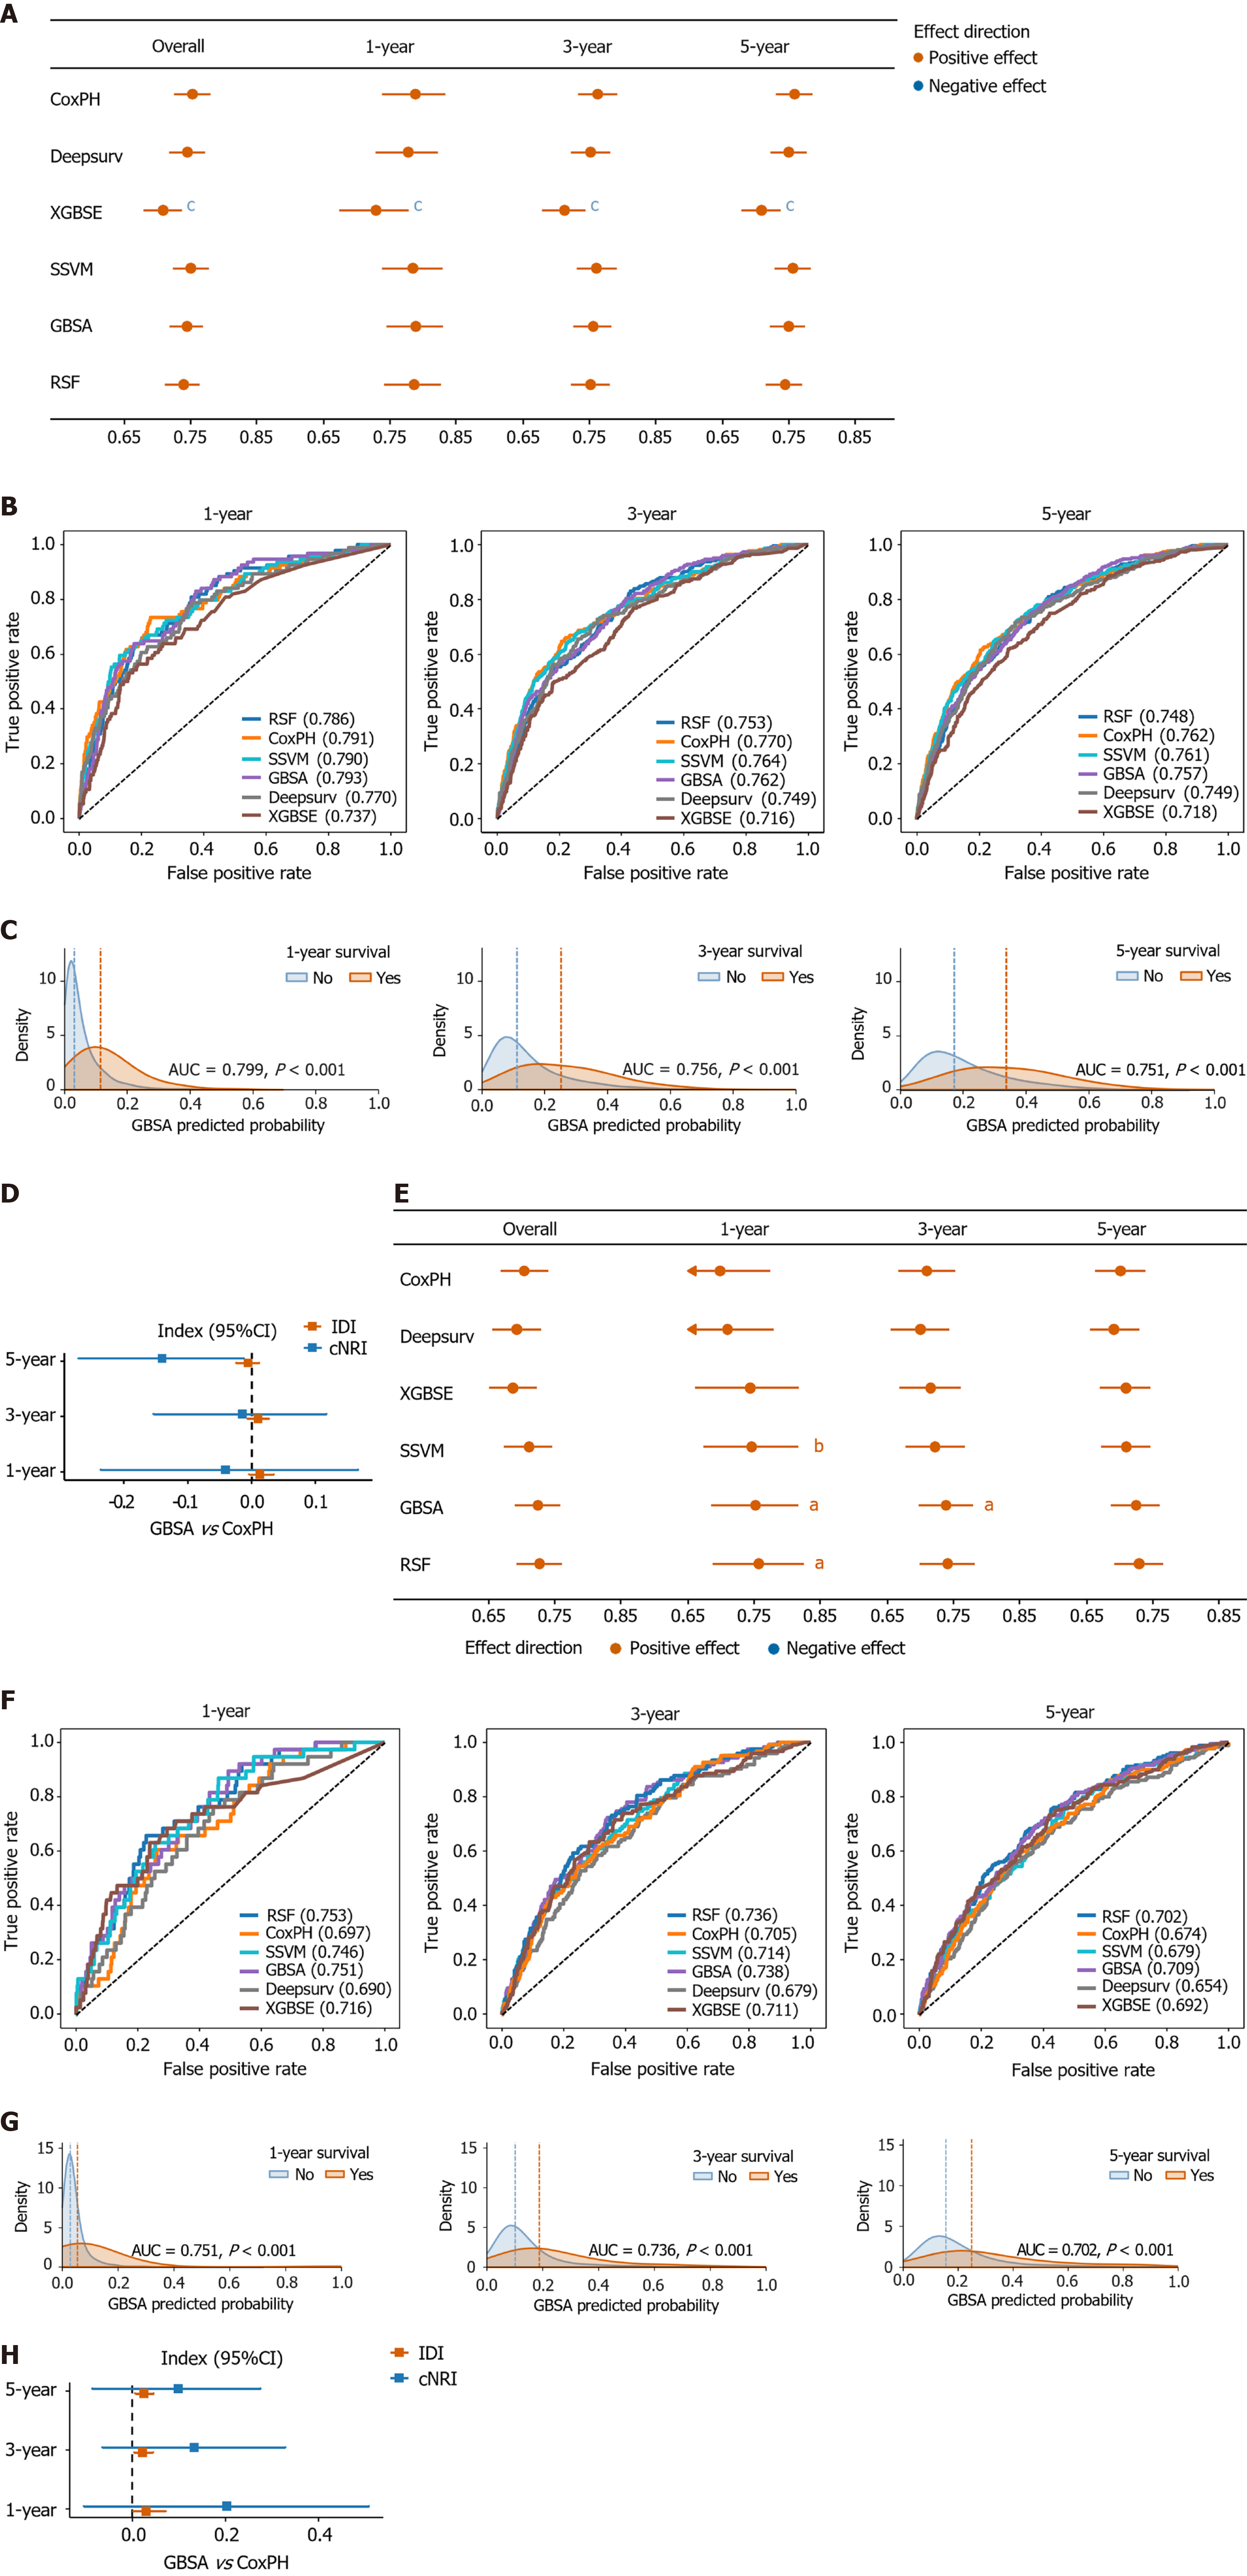
Figure 6 Performance of the prognostic model in the external validation cohorts.
A: Harrell’s concordance index (C-index) values at overall, 1-year, 3-year, and 5-year time points across models in external validation cohort 1; B: Time-dependent receiver operating characteristic (ROC) curves at 1-year, 3-year, and 5-year in cohort 1; C: Probability density function (PDF) plots of the gradient boosting survival analysis (GBSA) model for predicting 1-year, 3-year, and 5-year survival probabilities in cohort 1; D: Integrated discrimination improvement (IDI), and continuous net reclassification improvement (cNRI) of the GBSA model compared with the Cox proportional hazards (CoxPH) model for 1-year, 3-year, and 5-year survival prediction in external validation cohort 1; E: C-index values at overall, 1-year, 3-year, and 5-year time points across models in external validation cohort 2; F: Time-dependent ROC curves at 1-year, 3-year, and 5-year in external validation cohort 2; G: PDF plots of the GBSA model for 1-year, 3-year, and 5-year survival prediction in external validation cohort 2; H: IDI and cNRI of the GBSA model compared with the CoxPH model for 1-year, 3-year, and 5-year survival prediction in external validation cohort 2. aP < 0.05. bP < 0.01. cP < 0.001. AUC: Area under the curve; CI: Confidence interval; cNRI: Continuous net reclassification improvement; CoxPH: Cox proportional hazards; IDI: Integrated discrimination improvement; GBSA: Gradient boosting survival analysis; RSF: Random survival forest; SSVM: Survival support vector machine; XGBSE: EXtreme gradient boosting for survival embeddings.
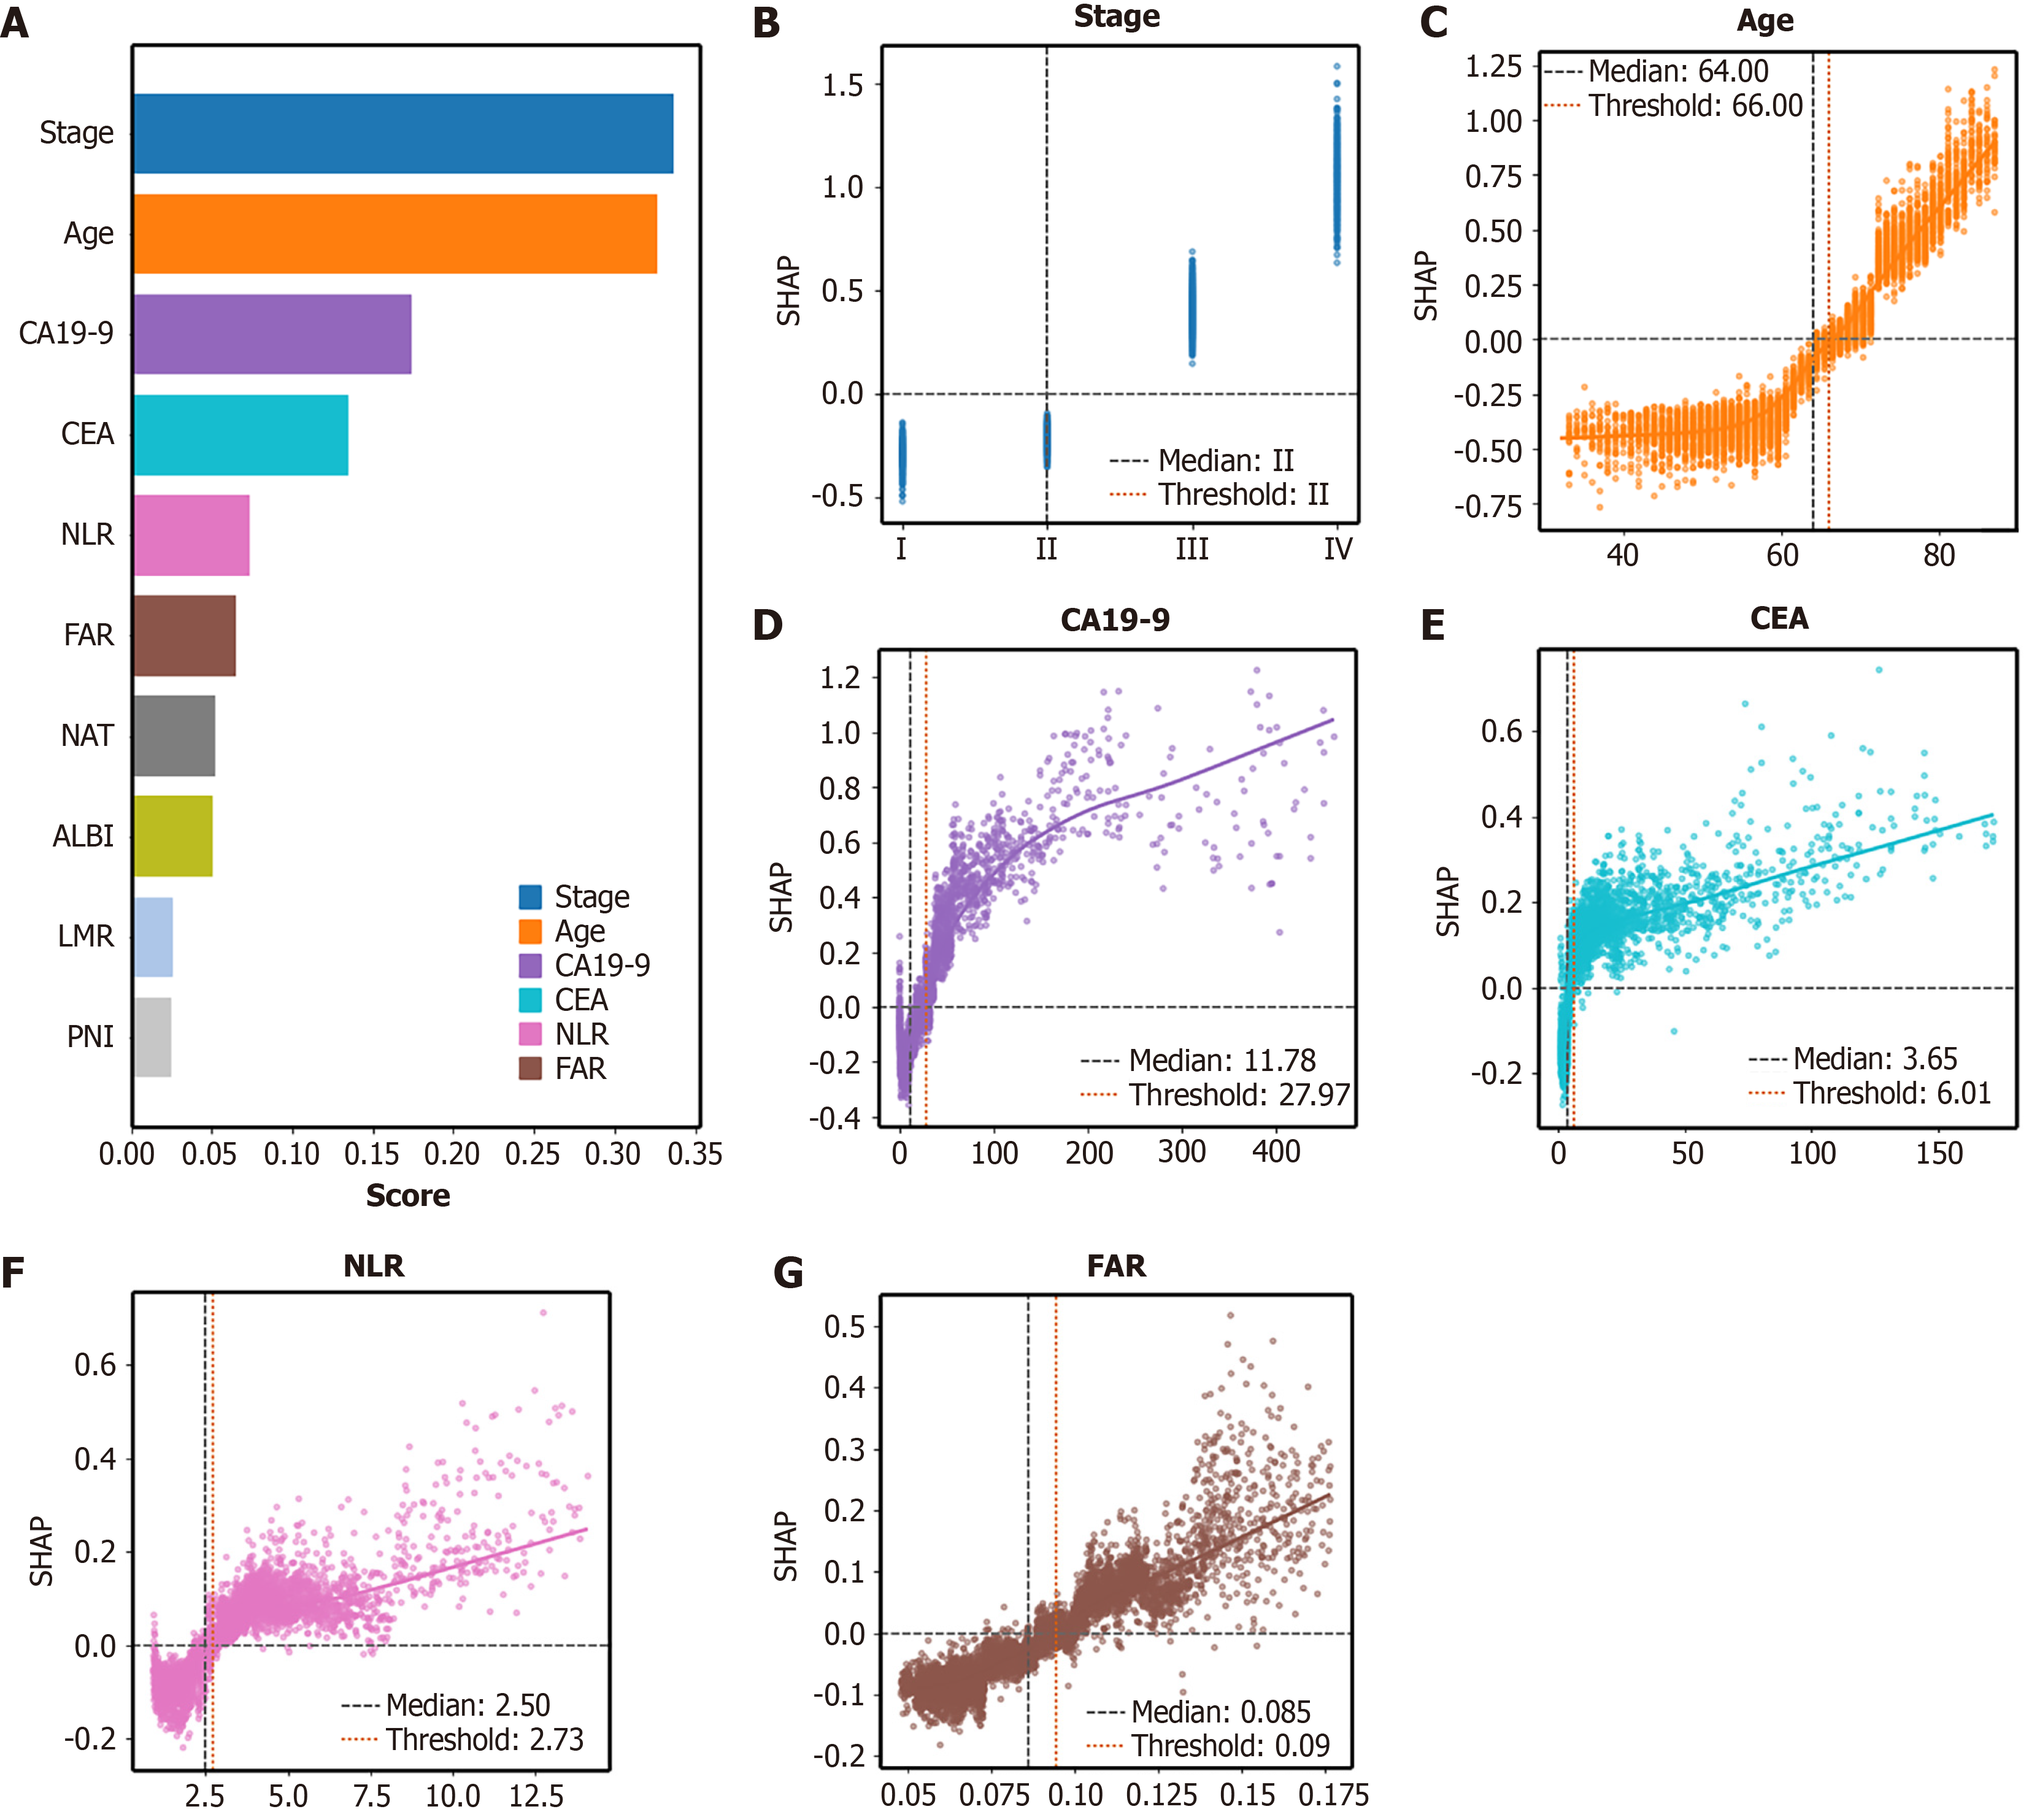
Figure 7 SHapley Additive exPlanations-based explanation of survival prediction in colorectal cancer patients.
A: SHapley Additive exPlanations (SHAP) bar plot for variables ranked by mean absolute SHAP values; B-G: SHAP dependence plots of the top six features showing their effects on model output. ALBI: Albumin-bilirubin index; CA19-9: Carbohydrate antigen 19-9; CEA: Carcinoembryonic antigen; FAR: Fibrinogen-to-albumin ratio; LMR: Lymphocyte-to-monocyte ratio; NAT: Neoadjuvant therapy; NLR: Neutrophil-to-lymphocyte ratio; PNI: Prognostic nutritional index; SHAP: SHapley Additive exPlanations.
- Citation: Wang L, Liu C, Xie J, Liu JS, Zhou X, Liu F, Xiang CY, Zhao JN, Liu XR, Liu XY, Kang B, Cheng Y, Peng D. Integrating immune-inflammatory and nutritional indicators into machine learning-driven risk stratification for colorectal cancer. World J Gastroenterol 2027; 33(2): 123195
- URL: https://www.wjgnet.com/1007-9327/full/v33/i2/123195.htm
- DOI: https://dx.doi.org/10.3748/wjg.123195